Water Quality Testing Equipment Market Growth and Recent Trends by 2027
Historic Data: 2017-2018 | Base Year: 2019 | Forecast Period: 2020-2027Water Quality Testing Equipment Market to 2027 - Global Analysis and Forecasts by Product Type (pH Meter, Dissolved Oxygen Meter, Conductivity Meter, Turbidity Tester, and Others); Type (Handheld and Portable); and End-User (Industrial, Commercial, Government, and Others)
- Report Date : Jun 2019
- Report Code : TIPRE00004108
- Category : Electronics and Semiconductor
- Status : Published
- Available Report Formats :


- No. of Pages : 173
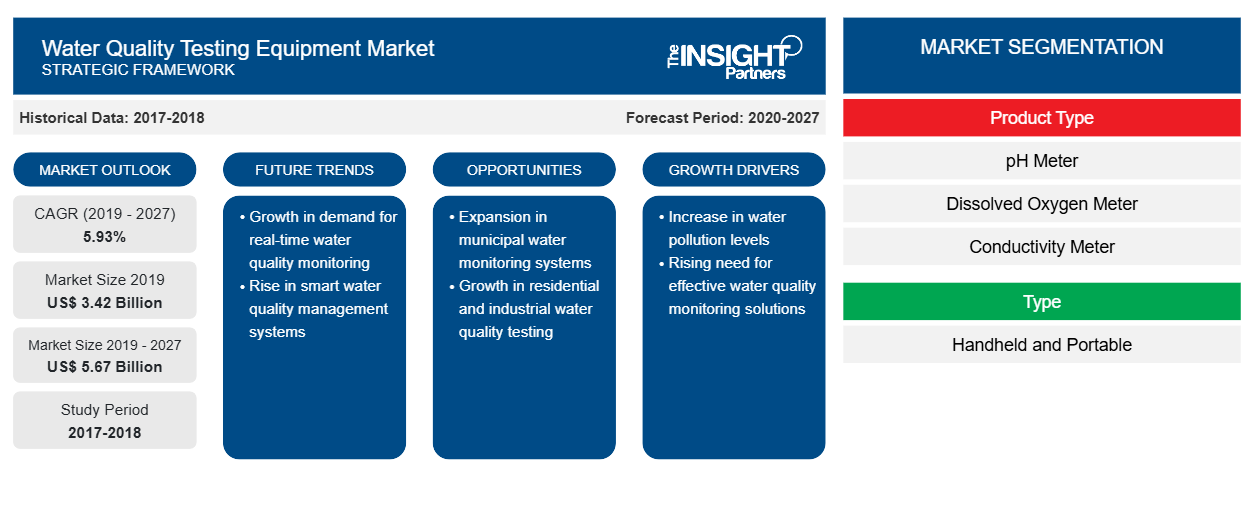
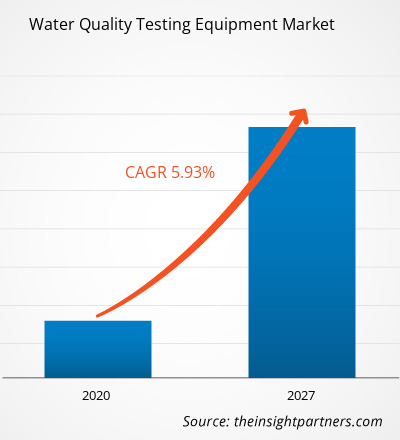
The water quality testing equipment market accounted to US$ 3.42 Bn in 2018 and is expected to grow at a CAGR of 5.93% during the forecast period 2019 - 2027, to account to US$ 5.67 Bn by 2027.
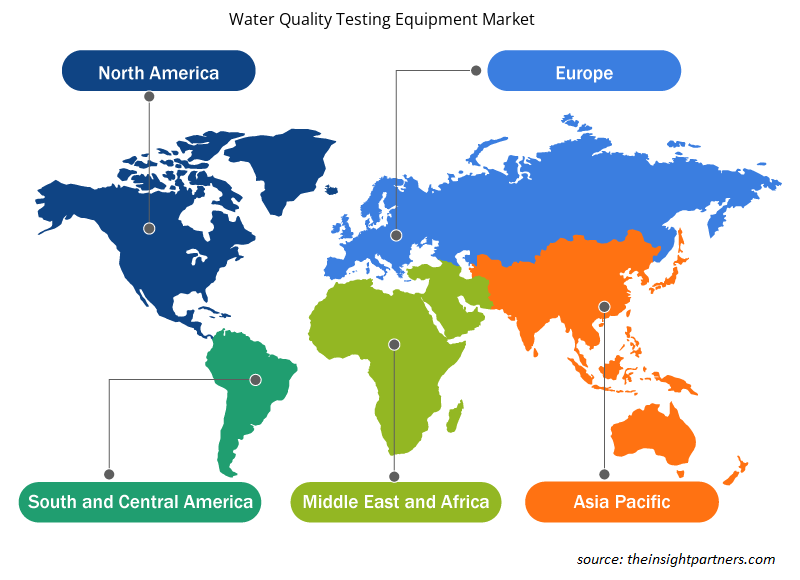
North America was the leading geographic market, and it is anticipated to be the highest revenue contributor throughout the forecast period. Significant investments in the water infrastructure sector by Government in the developed nations of the US and Canada are expected to fuel the water quality testing equipment market in this region.Market Insights
Stringent legislations across the globe on maintaining water quality to contribute to the water quality testing equipment market growth
The Clean Water Act (CWA) in the US is responsible for the protection of water bodies in the US with the standards set as per the desired usage of it. The Safe Drinking Water Act (SWDA) in the country is responsible for maintaining and improving the quality of drinking water supplied to the masses. The SWDA is also accountable for listing the standards in public water treatment plants.
Customize This Report To Suit Your Requirement
You will get customization on any report - free of charge - including parts of this report, or country-level analysis, Excel Data pack, as well as avail great offers and discounts for start-ups & universities
Water Quality Testing Equipment Market: Strategic Insights
- Get Top Key Market Trends of this report.This FREE sample will include data analysis, ranging from market trends to estimates and forecasts.
Innovative water processing techniques to drive the overall growth in water quality testing equipment market
The water desalination process is a widely adopted process in the Middle Eastern countries to bring a balance in the demand-supply of water. However, the process is observed to have specific negative impacts on the water bodies and the allied water ecosystem. It has been noted that the desalination process results in the diffusion of chemicals and anti-fouling agents in the sea. As a corrective measure, water agencies use automated warning stations and much other water quality testing equipment for monitoring the quality of water. The adoptions of water quality monitoring systems are therefore anticipated to spike up in the Middle Eastern region.
Product Type Insights
The global water quality testing equipment market by product type was led by pH meter segment. The other systems for water quality testing equipment market include temperature sensors, silica measurement sensor, sodium measurement, iron measurement, and total organic carbon (TOC) sensor, among others. Turbidity tester held the second largest market in 2017, and is anticipated to lose its shares during the forecast period from 2019 – 2027.
Type Insights
The global water quality testing equipment market by type was led by benchtop segment. With the increasing concentration toward research and development of water quality analysis by government and for academic research, the demand for benchtop equipment primarily for laboratory purposes is boosting the requirement of benchtop water quality equipment significantly.
End User Insights
The global water quality testing equipment market is segmented on the basis of end-user as handheld/portable and Benchtop testing equipment. Commercial sectors held the second largest market in 2017 and are anticipated to continue its shares during the forecast period from 2019 – 2027. The other end-user of water quality testing equipment market includes education, life science, and other natural science sectors.
The market players present in water quality testing equipment market are mainly focusing on product enhancements by implementing advanced technologies. By signing partnership, contracts, joint ventures, funding, and inaugurating new offices across the world permit the company to maintain its brand name globally. Few of the recent developments are listed below;
2019:Emerson announced the introduction of new sensor technology to provide about ten times greater sensor stability, and reduce risk in quality and yield for biopharmaceutical manufacturers.
2017:AquaPhoenix announced a new Mobile Testing App named as “Aliquot,” mainly for water technicians to make their daily testing simple and efficient. This application is available in iOS and Android mobiles.
2017:Shimadzu announced a joint research and development innovation center in Singapore. This center comprises of 7 members of staff working, for the development of a high sensitivity environmental sensor to detect nitrogen and phosphorous contained in lakes and rivers.
Water Quality Testing Equipment Market Regional Insights
The regional trends and factors influencing the Water Quality Testing Equipment Market throughout the forecast period have been thoroughly explained by the analysts at Insight Partners. This section also discusses Water Quality Testing Equipment Market segments and geography across North America, Europe, Asia Pacific, Middle East and Africa, and South and Central America.
- Get the Regional Specific Data for Water Quality Testing Equipment Market
Water Quality Testing Equipment Market Report Scope
| Report Attribute | Details |
|---|---|
| Market size in 2019 | US$ 3.42 Billion |
| Market Size by 2027 | US$ 5.67 Billion |
| Global CAGR (2019 - 2027) | 5.93% |
| Historical Data | 2017-2018 |
| Forecast period | 2020-2027 |
| Segments Covered |
By Product Type
|
| Regions and Countries Covered | North America
|
| Market leaders and key company profiles |
Water Quality Testing Equipment Market Players Density: Understanding Its Impact on Business Dynamics
The Water Quality Testing Equipment Market is growing rapidly, driven by increasing end-user demand due to factors such as evolving consumer preferences, technological advancements, and greater awareness of the product's benefits. As demand rises, businesses are expanding their offerings, innovating to meet consumer needs, and capitalizing on emerging trends, which further fuels market growth.
Market players density refers to the distribution of firms or companies operating within a particular market or industry. It indicates how many competitors (market players) are present in a given market space relative to its size or total market value.
Major Companies operating in the Water Quality Testing Equipment Market are:
- ABB Ltd
- Agilent Technologies Inc.
- AquaPhoenix Scientific Inc.
- Danaher Corporation,
- Emerson Electric Co.
Disclaimer: The companies listed above are not ranked in any particular order.
- Get the Water Quality Testing Equipment Market top key players overview
GLOBAL WATER QUALITY TESTING EQUIPMENT – MARKET SEGMENTATION
By Product Type
- pH Meter
- Dissolved Oxygen Meter
- Conductivity Meter
- Turbidity Tester
- Others
By Type
- Handheld/ Portable
- Benchtop
By End User
- Industrial
- Commercial
- Government
- Others
By Geography
North America
- U.S.
- Canada
- Mexico
Europe
- France
- Germany
- UK
- Russia
- Italy
- Rest of Europe
Asia Pacific (APAC)
- Australia
- China
- India
- Japan
- South Korea
- Rest of APAC
Middle East & Africa (MEA)
- Saudi Arabia
- South Africa
- UAE
- Rest of MEA
South America (SAM)
- Brazil
- Argentina
- Rest of SAM
Company Profiles
- ABB Ltd
- Agilent Technologies Inc.
- AquaPhoenix Scientific Inc.
- Danaher Corporation,
- Emerson Electric Co.
- Eurofins Scientific SE
- General Electric (GE)
- Horiba, Ltd.
- Shimadzu Corporation
- Thermo-Fisher Scientific

Market Research & Consulting
- Historical Analysis (2 Years), Base Year, Forecast (7 Years) with CAGR
- PEST and SWOT Analysis
- Market Size Value / Volume - Global, Regional, Country
- Industry and Competitive Landscape
- Excel Dataset
Testimonials
I wish to appreciate your support and the professionalism you displayed in the course of attending to my request for information regarding to infectious disease IVD market in Nigeria. I appreciate your patience, your guidance, and the fact that you were willing to offer a discount, which eventually made it possible for us to close a deal. I look forward to engaging The Insight Partners in the future, all thanks to the impression you have created in me as a result of this first encounter.
DR CHIJIOKE ONYIA, MANAGING DIRECTOR, PineCrest Healthcare Ltd.The Insight Partners delivered insightful, well-structured market research with strong domain expertise. Their team was professional and responsive throughout. The user-friendly website made accessing industry reports seamless. We highly recommend them for reliable, high-quality research services
Yukihiko Adachi CEO, Deep Blue, LLC.Reason to Buy
- Informed Decision-Making
- Understanding Market Dynamics
- Competitive Analysis
- Customer Insights
- Market Forecasts
- Risk Mitigation
- Strategic Planning
- Investment Justification
- Identifying Emerging Markets
- Enhancing Marketing Strategies
- Boosting Operational Efficiency
- Tracking Industry Innovations
- Aligning with Regulatory Trends
Yes! We provide a free sample of the report, which includes Report Scope (Table of Contents), report structure, and selected insights to help you assess the value of the full report. Please click on the "Download Sample" button or contact us to receive your copy.
Absolutely — analyst assistance is part of the package. You can connect with our analyst post-purchase to clarify report insights, methodology or discuss how the findings apply to your business needs.
Once your order is successfully placed, you will receive a confirmation email along with your invoice.
• For published reports: You’ll receive access to the report within 4–6 working hours via a secured email sent to your email.
• For upcoming reports: Your order will be recorded as a pre-booking. Our team will share the estimated release date and keep you informed of any updates. As soon as the report is published, it will be delivered to your registered email.
We offer customization options to align the report with your specific objectives. Whether you need deeper insights into a particular region, industry segment, competitor analysis, or data cut, our research team can tailor the report accordingly. Please share your requirements with us, and we’ll be happy to provide a customized proposal or scope.
The report is available in either PDF format or as an Excel dataset, depending on the license you choose.
The PDF version provides the full analysis and visuals in a ready-to-read format. The Excel dataset includes all underlying data tables for easy manipulation and further analysis.
Please review the license options at checkout or contact us to confirm which formats are included with your purchase.
Our payment process is fully secure and PCI-DSS compliant.
We use trusted and encrypted payment gateways to ensure that all transactions are protected with industry-standard SSL encryption. Your payment details are never stored on our servers and are handled securely by certified third-party processors.
You can make your purchase with confidence, knowing your personal and financial information is safe with us.
Yes, we do offer special pricing for bulk purchases.
If you're interested in purchasing multiple reports, we’re happy to provide a customized bundle offer or volume-based discount tailored to your needs. Please contact our sales team with the list of reports you’re considering, and we’ll share a personalized quote.
Yes, absolutely.
Our team is available to help you make an informed decision. Whether you have questions about the report’s scope, methodology, customization options, or which license suits you best, we’re here to assist. Please reach out to us at sales@theinsightpartners.com, and one of our representatives will get in touch promptly.
Yes, a billing invoice will be automatically generated and sent to your registered email upon successful completion of your purchase.
If you need the invoice in a specific format or require additional details (such as company name, GST, or VAT information), feel free to contact us, and we’ll be happy to assist.
Yes, certainly.
If you encounter any difficulties accessing or receiving your report, our support team is ready to assist you. Simply reach out to us via email or live chat with your order information, and we’ll ensure the issue is resolved quickly so you can access your report without interruption.


The List of Companies - Water Quality Testing Equipment Market
- ABB Ltd
- Agilent Technologies Inc.
- AquaPhoenix Scientific Inc.
- Danaher Corporation,
- Emerson Electric Co.
- Eurofins Scientific SE
- General Electric (GE)
- Horiba, Ltd.
- Shimadzu Corporation
- Thermo-Fisher Scientific


 Get Free Sample For