
3D 显示器市场分析及预测(按规模、份额、增长、趋势)2028
2028 年 3D 显示器市场预测 - COVID-19 影响和全球分析,按类型(立体 3D 显示器和自动立体 3D 显示器)、技术(数字光处理、有机发光二极管和发光二极管)和应用(消费电子、汽车、医疗、广告、零售、军事和国防等)
- 状态 : 已发布
- 报告代码 : TIPTE100000774
- 类别 : 电子和半导体
- 页数 : 188
- 可用报告格式 :


- 最后更新日期 : June 12, 2024

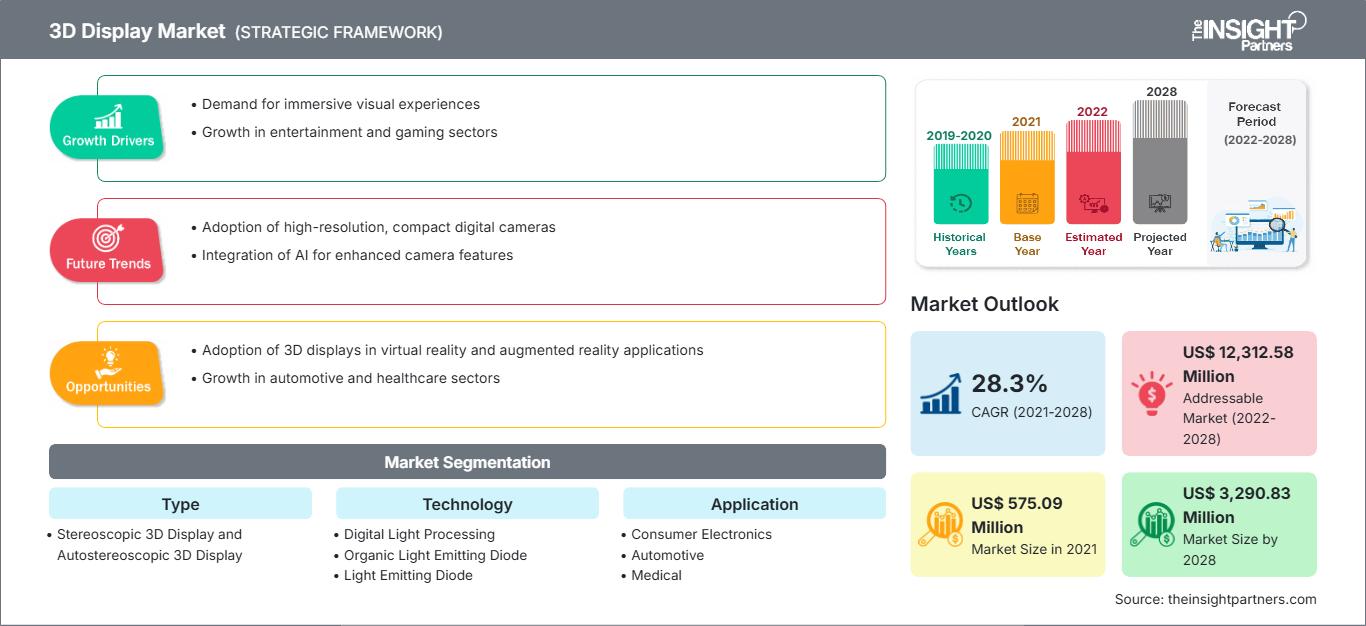
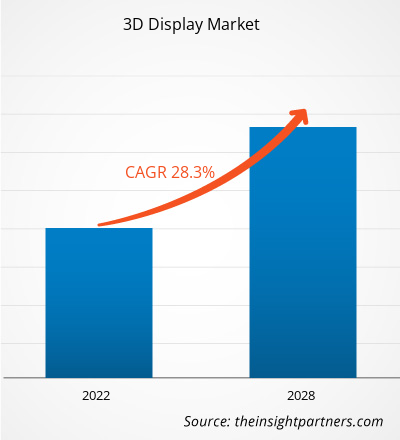
2021年,3D显示器市场规模为5.7509亿美元,预计到2028年将达到32.9083亿美元;预计2021年至2028年的复合年增长率将达到28.3%。
消费电子、汽车、医疗、军事和国防、工业、媒体和娱乐以及游戏都是3D显示器的潜在市场。此外,娱乐和游戏行业的增长也对3D显示器市场产生了积极影响,因为影院屏幕数量大幅增加,例如,2021年全球约有12.5万块影院屏幕开始在数字平台上运营。此外,增强现实 (AR) 技术在各种医疗应用中的应用日益广泛,有助于提升外科医生的视觉能力、缩短手术时间并优化术前规划,这为 3D 显示市场创造了机遇。例如,2020 年 5 月,Ocutrx Vision Technologies, LLC 宣布开发其新型手术可视化影院“Ocutrx OR-Bot”,该影院配备 3D 8K 显示器,用于操作手术工具。此外,持续的投资,尤其是在自动立体 3D 显示解决方案方面的投资,以及市场参与者和最终用户之间为开发用于广泛应用的先进全息和体积 3D 显示系统而建立的合作伙伴关系数量的不断增加,也是推动全球 3D 显示市场增长的因素之一。
自定义此报告以满足您的要求
您将免费获得任何报告的定制,包括本报告的部分内容,或国家级分析、Excel 数据包,以及为初创企业和大学提供超值优惠和折扣
3D显示市场: 战略洞察
-
获取本报告的主要市场趋势。这个免费样本将包括数据分析,从市场趋势到估计和预测。
COVID-19 疫情对 3D 显示市场的影响
COVID-19 危机影响了全球各行各业,全球经济在 2020 年受到的打击最为严重,并且这种情况很可能在 2021 年持续下去。疫情对汽车、零售和消费电子等主要产业造成了严重破坏。电子和制造业的急剧下滑正在影响全球 3D 显示市场的增长。北美是新技术应用和发展最有利的地区之一,这得益于政府支持创新的政策、庞大的工业基础以及高购买力,尤其是在美国和加拿大等发达国家。北美拥有大量制造业和科技公司,因此,截至 2021 年中期,COVID-19 疫情的影响一直相当严重。随着 COVID-19 疫苗接种运动的开展,该地区预计市场将复苏,经济将改善。
市场洞察 – 3D显示器市场
行业合作伙伴数量不断增长,推动市场增长
目前,3D显示器的主要应用领域是营销和广告领域。医疗、汽车和国防预计将成为3D显示器的潜在应用领域。随着市场增长和技术发展,3D显示器技术的潜在应用领域数量可能达到前所未有的水平。
基于类型的洞察
根据类型,3D显示器市场细分为立体3D显示器和自动立体3D显示器。 2021年,自动立体3D显示器领域占据了更大的市场份额。
3D显示器市场的参与者主要致力于开发先进高效的产品。
- 2021年4月,友达光电在Touch Taiwan 2021上推出了令人惊艳的ALED显示器系列,展示了世界领先的Micro LED技术和应用。
- 2021年9月,三星的可拉伸显示器可以将2D内容转换为移动的3D场景。
3D 显示器市场区域洞察
The Insight Partners 的分析师已详尽阐述了预测期内影响 3D 显示器市场的区域趋势和因素。本节还讨论了北美、欧洲、亚太地区、中东和非洲以及南美和中美洲的 3D 显示器市场细分和地域分布。
3D显示市场报告范围
| 报告属性 | 细节 |
|---|---|
| 市场规模 2021 | US$ 575.09 Million |
| 市场规模 2028 | US$ 3,290.83 Million |
| 全球复合年增长率 (2021 - 2028) | 28.3% |
| 历史数据 | 2019-2020 |
| 预测期 | 2022-2028 |
| 涵盖的领域 |
By 类型
|
| 覆盖地区和国家 |
北美
|
| 市场领导者和主要公司简介 |
|
3D 显示器市场参与者密度:了解其对业务动态的影响
3D 显示市场正在快速增长,这得益于终端用户需求的不断增长,而这些需求的驱动因素包括消费者偏好的不断变化、技术进步以及对产品优势的认知度不断提高。随着需求的增长,企业正在扩展其产品线,不断创新以满足消费者需求,并抓住新兴趋势,从而进一步推动市场增长。
- 获取 3D显示市场 主要参与者概述
3D 显示器市场分为类型、技术、应用和地域。根据类型,市场分为立体 3D 显示器和自动立体 3D 显示器。2021 年,自动立体 3D 显示器细分市场引领 3D 显示器市场,并占据最大的市场份额。根据技术,市场分为数字光处理、有机发光二极管和发光二极管。2021 年,数字光处理细分市场引领 3D 显示器市场,并占据最大的市场份额。根据应用,市场细分为消费电子、汽车、医疗、广告、零售、军事和国防等。2021 年,消费电子细分市场引领 3D 显示器市场,并占据最大的市场份额。从地域上看,市场大致分为北美、欧洲、亚太地区 (APAC)、中东和非洲 (MEA) 和南美 (SAM)。 2021 年,北美在全球市场中占有相当大的份额。
全球 3D 显示器市场的一些主要供应商包括友达光电株式会社、群创光电株式会社、LG 电子、三菱电机株式会社、松下株式会社、三星集团、夏普株式会社、Looking Glass Factory Inc、Light Field Lab Inc、Leia Inc、索尼、东芝株式会社和富士胶片株式会社等公司。

Naveen 是一位经验丰富的市场研究和咨询专业人士,在定制项目、联合项目和咨询项目方面拥有超过 9 年的专业经验。他目前担任副总裁,成功管理了项目价值链中的利益相关者,撰写了 100 多份研究报告和 30 多项咨询项目。他的工作涵盖工业和政府项目,为客户的成功和数据驱动的决策做出了重要贡献。
Naveen 拥有卡纳塔克邦 VTU 的电子与通信工程学位,以及马尼帕尔大学的市场营销与运营 MBA 学位。他已担任 IEEE 会员 9 年,积极参与各种会议、技术研讨会,并在分部和地区层面担任志愿者。在此之前,他曾担任 IndustryARC 的助理战略顾问和惠普(惠普全球)的工业服务器顾问。
- 全面的市场规模与预测分析
- 详细的细分市场分析
- 深入的市场动态评估
- 区域及国家级洞察
- 竞争格局与企业对标分析
- 战略性商业情报
客户评价
Insight Partners 的 SCADA 系统市场报告内容全面,对当前趋势和未来预测提供了宝贵的见解。该团队始终高度专业、响应迅速且乐于助人。我们非常满意,强烈推荐他们的服务。
兰·凯德姆 伙伴, Reali Technologies LTD我请求一份关于特定软件市场的报告,团队在几天内就完成了。报告信息非常相关,而且呈现得非常出色。之后,我请求对报告进行一些修改和补充。团队再次迅速响应,不到一周我就收到了最终报告。
让-埃尔韦·詹恩 主席, 未来分析公司我们与 Insight Partners 合作进行了一项重要的市场研究和预测。他们清晰地洞察了机遇和风险,帮助我们制定了计划。他们的研究简单易用,数据可靠,帮助我们做出了明智而自信的决策。我们强烈推荐他们。
皮尤什·纳格帕尔 高级副总裁, 远光全球Insight Partners 凭借其深厚的行业专业知识,提供了富有洞察力、结构合理的市场研究。他们的团队始终专业且响应迅速。用户友好的网站让访问行业报告变得顺畅无阻。我们强烈推荐他们可靠、高质量的研究服务。
安达幸彦 首席执行官, 深蓝有限责任公司这是我第一次从The Insight Partners购买市场报告。起初我有些犹豫,但访问了他们的网站后,我更放心地冒险购买市场报告。我对报告的质量和客户服务非常满意。我对最初的报告有一些疑问和意见,但在与他们的分析师通过电子邮件沟通了几次后,我相信这份报告可以作为我们战略规划流程的参考。非常感谢您抽出宝贵的时间,让这次体验如此愉快。我一定会向其他人推荐你们的服务,当我们需要更多市场数据时,你们将是我的首选。
约翰·铃木 总裁兼首席执行官、董事会董事, BK科技感谢您在处理我关于尼日利亚传染病体外诊断市场信息请求的过程中所展现的支持和专业精神。感谢您的耐心、指导,以及您愿意提供的折扣,最终促成了这笔交易。我期待未来与 Insight Partners 继续合作,这一切都要归功于您与我初次接触后留下的良好印象。
奇吉奥克博士 ONYIA 董事总经理, PineCrest 医疗保健有限公司购买理由
- 明智的决策
- 了解市场动态
- 竞争分析
- 客户洞察
- 市场预测
- 风险规避
- 战略规划
- 投资论证
- 识别新兴市场
- 优化营销策略
- 提升运营效率
- 顺应监管趋势


