
Marktübersicht, Wachstum, Trends, Analyse, Forschungsbericht für 3D-Displays (2021–2028)
Marktprognose für 3D-Displays bis 2028 – Auswirkungen von COVID-19 und globale Analyse nach Typ (stereoskopisches 3D-Display und autostereoskopisches 3D-Display), Technologie (digitale Lichtverarbeitung, organische Leuchtdiode und Leuchtdiode) und Anwendung (Unterhaltungselektronik, Automobil, Medizin, Werbung, Einzelhandel, Militär und Verteidigung und andere)
- Status : Veröffentlicht
- Berichtscode : TIPTE100000774
- Kategorie : Elektronik und Halbleiter
- Anzahl der Seiten : 188
- Verfügbare Berichtsformate :


- Datum der letzten Aktualisierung : June 12, 2024

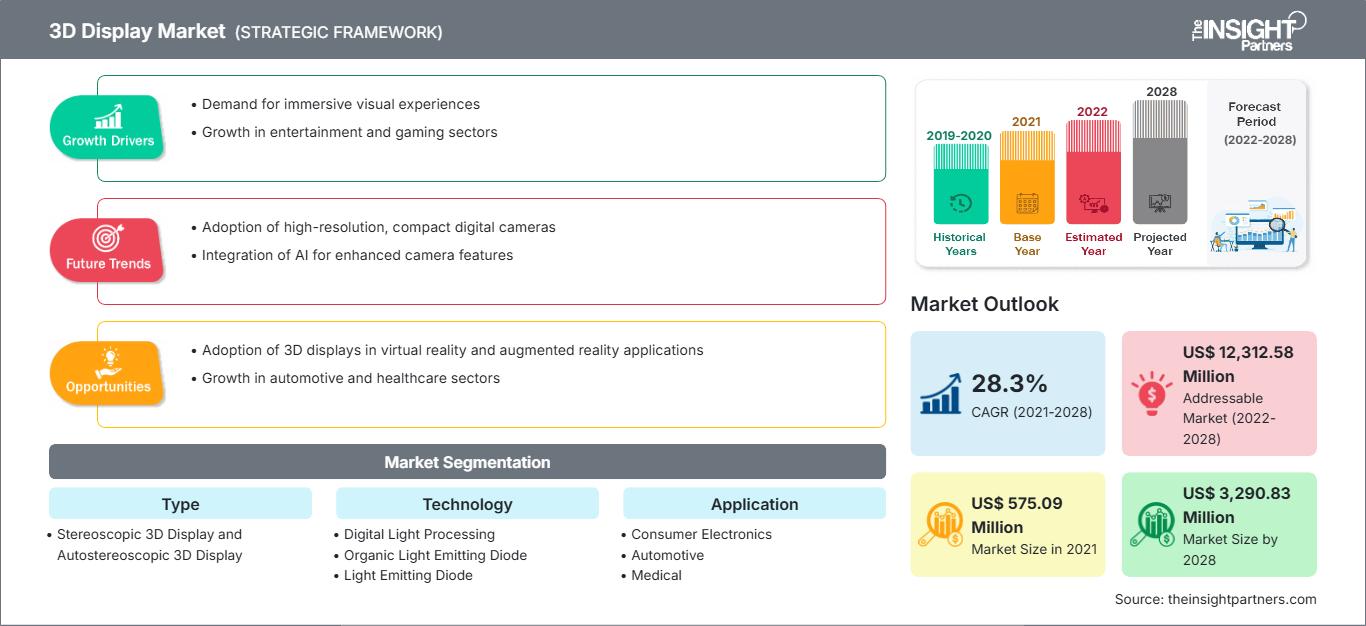
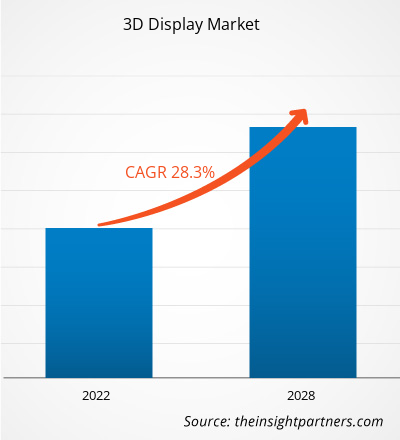
Der Markt für 3D-Displays wurde im Jahr 2021 auf 575,09 Millionen US-Dollar geschätzt und soll bis 2028 3.290,83 Millionen US-Dollar erreichen. Schätzungen zufolge wird er zwischen 2021 und 2028 eine durchschnittliche jährliche Wachstumsrate (CAGR) von 28,3 % verzeichnen.
Zu den potenziellen Märkten für 3D-Displays zählen Unterhaltungselektronik, Automobilindustrie, Medizin, Militär & Verteidigung, Industrie, Medien & Unterhaltung sowie Gaming. Darüber hinaus wirkte sich das Wachstum in der Unterhaltungs- und Gaming-Branche positiv auf den 3D-Display-Markt aus, da die Anzahl der Kinoleinwände deutlich zugenommen hat. So wurden im Jahr 2021 weltweit etwa 125.000 Kinosäle auf einer digitalen Plattform in Betrieb genommen. Darüber hinaus schafft die zunehmende Nutzung von Augmented Reality in verschiedenen medizinischen Anwendungen zur Verbesserung der Sehfähigkeit von Chirurgen, zur Verkürzung von Operationszeiten und zur präoperativen Planung Chancen für den 3D-Display-Markt. So kündigte Ocutrx Vision Technologies, LLC im Mai 2020 die Entwicklung seines neuen Operationsvisualisierungssystems „Ocutrx OR-Bot“ an, das mit einem 3D-8K-Display-Monitor zur Bedienung chirurgischer Instrumente ausgestattet ist. Zu den Wachstumsfaktoren des globalen 3D-Display-Marktes zählen jedoch auch die kontinuierlichen Investitionen, insbesondere in autostereoskopische 3D-Display-Lösungen, und die wachsende Zahl von Partnerschaften zwischen Marktteilnehmern und Endnutzern zur Entwicklung fortschrittlicher holografischer und volumetrischer 3D-Display-Systeme für ein breites Anwendungsspektrum.
Passen Sie diesen Bericht Ihren Anforderungen an
Sie erhalten kostenlos Anpassungen an jedem Bericht, einschließlich Teilen dieses Berichts oder einer Analyse auf Länderebene, eines Excel-Datenpakets sowie tolle Angebote und Rabatte für Start-ups und Universitäten.
3D-Display-Markt: Strategische Einblicke
-
Holen Sie sich die wichtigsten Markttrends aus diesem Bericht.Dieses KOSTENLOSE Beispiel umfasst Datenanalysen, die von Markttrends bis hin zu Schätzungen und Prognosen reichen.
Auswirkungen der COVID-19-Pandemie auf den 3D-Display-Markt
Die COVID-19-Krise betraf Branchen weltweit, und die Weltwirtschaft wurde 2020 am stärksten getroffen, was sich voraussichtlich 2021 fortsetzen wird. Der Ausbruch verursachte erhebliche Störungen in Schlüsselindustrien wie der Automobilindustrie, dem Einzelhandel und der Unterhaltungselektronik. Der starke Rückgang in der Elektronik- und Fertigungsindustrie beeinträchtigt das Wachstum des globalen 3D-Display-Marktes. Nordamerika ist eine der günstigsten Regionen für die Einführung und das Wachstum neuer Technologien aufgrund unterstützender staatlicher Maßnahmen zur Förderung von Innovationen, einer riesigen industriellen Basis und einer hohen Kaufkraft, insbesondere in entwickelten Ländern wie den USA und Kanada. Nordamerika ist die Heimat einer großen Anzahl von Fertigungs- und Technologieunternehmen, daher waren die Auswirkungen des COVID-19-Ausbruchs bis Mitte 2021 recht schwerwiegend. Die Region erwartet mit den COVID-19-Impfkampagnen eine Markterholung und eine wirtschaftliche Verbesserung.
Markteinblicke – 3D-Display-Markt
Steigende Zahl von Branchenpartnerschaften fördert Marktwachstum
Die wichtigsten Anwendungsbereiche für 3D-Displays sind derzeit die Bereiche Marketing und Werbung. Zu den potenziellen Anwendungsbereichen für 3D-Displays zählen Medizin, Automobilindustrie und Verteidigung. Abhängig vom positiven Wachstum und der technologischen Entwicklung des Marktes könnten die potenziellen Anwendungsbereiche für 3D-Display-Technologien beispiellos zahlreich sein.
Typbasierte Erkenntnisse
Basierend auf dem Typ ist der 3D-Display-Markt in stereoskopische 3D-Displays und autostereoskopische 3D-Displays unterteilt. Das Segment der autostereoskopischen 3D-Displays hatte 2021 einen größeren Marktanteil.
Akteure auf dem 3D-Display-Markt konzentrieren sich hauptsächlich auf die Entwicklung fortschrittlicher und effizienter Produkte.
- Im April 2021 stellte AUO auf der Touch Taiwan 2021 eine beeindruckende Serie von ALED-Displays vor, bei denen weltweit führende Mikro-LED-Technologie und -Anwendungen präsentiert wurden.
- Im September 2021 kann das dehnbare Display von Samsung 2D-Inhalte in bewegte 3D-Szenen umwandeln.
Regionale Einblicke in den 3D-Display-Markt
Die Analysten von The Insight Partners haben die regionalen Trends und Faktoren, die den 3D-Display-Markt im Prognosezeitraum beeinflussen, ausführlich erläutert. In diesem Abschnitt werden auch die Marktsegmente und die geografische Verteilung von 3D-Displays in Nordamerika, Europa, dem asiatisch-pazifischen Raum, dem Nahen Osten und Afrika sowie Süd- und Mittelamerika erläutert.
Umfang des 3D-Display-Marktberichts
| Berichtsattribut | Einzelheiten |
|---|---|
| Marktgröße in 2021 | US$ 575.09 Million |
| Marktgröße nach 2028 | US$ 3,290.83 Million |
| Globale CAGR (2021 - 2028) | 28.3% |
| Historische Daten | 2019-2020 |
| Prognosezeitraum | 2022-2028 |
| Abgedeckte Segmente |
By Typ
|
| Abgedeckte Regionen und Länder |
Nordamerika
|
| Marktführer und wichtige Unternehmensprofile |
|
Dichte der Marktteilnehmer für 3D-Displays: Auswirkungen auf die Geschäftsdynamik verstehen
Der 3D-Display-Markt wächst rasant. Die steigende Nachfrage der Endverbraucher ist auf Faktoren wie veränderte Verbraucherpräferenzen, technologische Fortschritte und ein stärkeres Bewusstsein für die Produktvorteile zurückzuführen. Mit der steigenden Nachfrage erweitern Unternehmen ihr Angebot, entwickeln Innovationen, um den Bedürfnissen der Verbraucher gerecht zu werden, und nutzen neue Trends, was das Marktwachstum weiter ankurbelt.
- Holen Sie sich die 3D-Display-Markt Übersicht der wichtigsten Akteure
Der Markt für 3D-Displays ist nach Typ, Technologie, Anwendung und Geografie segmentiert. Nach Typ wird der Markt in stereoskopische 3D-Displays und autostereoskopische 3D-Displays segmentiert. Im Jahr 2021 führte das Segment der autostereoskopischen 3D-Displays den 3D-Display-Markt an und hatte den größten Marktanteil. Nach Technologie wird der Markt in digitale Lichtverarbeitung, organische Leuchtdioden und Leuchtdioden kategorisiert. Im Jahr 2021 führte das Segment der digitalen Lichtverarbeitung den 3D-Display-Markt an und hatte den größten Marktanteil. Nach Anwendung wird der Markt in Unterhaltungselektronik, Automobil, Medizin, Werbung, Einzelhandel, Militär & Verteidigung und Sonstige segmentiert. Im Jahr 2021 führte das Segment der Unterhaltungselektronik den 3D-Display-Markt an und hatte den größten Marktanteil. Geografisch ist der Markt grob in Nordamerika, Europa, Asien-Pazifik (APAC), Naher Osten & Afrika (MEA) und Südamerika (SAM) segmentiert. Im Jahr 2021 hatte Nordamerika einen bedeutenden Anteil am Weltmarkt.
Zu den wichtigsten Anbietern auf dem globalen 3D-Display-Markt gehören Unternehmen wie AU OPTRONICS CORP, Innolux Corporation, LG Electronics, Mitsubishi Electric Corporation, Panasonic Corporation, Samsung Group, Sharp Corporation, Looking Glass Factory Inc, Light Field Lab Inc, Leia Inc, Sony, Toshiba Corporation und Fujifilm Corporation.

Naveen ist ein erfahrener Marktforschungs- und Beratungsexperte mit über 9 Jahren Erfahrung in kundenspezifischen, syndizierten und Beratungsprojekten. In seiner aktuellen Funktion als Associate Vice President hat er erfolgreich Stakeholder entlang der gesamten Projektwertschöpfungskette gemanagt und ist Autor von über 100 Forschungsberichten und über 30 Beratungsaufträgen. Seine Arbeit erstreckt sich auf Industrie- und Regierungsprojekte und trägt maßgeblich zum Kundenerfolg und zur datengesteuerten Entscheidungsfindung bei.
Naveen hat einen Ingenieursabschluss in Elektronik und Kommunikation von der VTU, Karnataka, und einen MBA in Marketing und Operations von der Manipal University. Er ist seit 9 Jahren aktives IEEE-Mitglied und nimmt an Konferenzen und technischen Symposien teil und engagiert sich ehrenamtlich auf Sektions- und regionaler Ebene. Vor seiner aktuellen Position arbeitete er als Associate Strategic Consultant bei IndustryARC und als Industrial Server Consultant bei Hewlett Packard (HP Global).
- Umfassende Analyse der Marktgröße und Prognosen
- Detaillierte Segmentierungsanalyse
- Tiefgehende Bewertung der Marktdynamik
- Einblicke auf regionaler und nationaler Ebene
- Wettbewerbslandschaft und Unternehmens-Benchmarking
- Strategische Business Intelligence
Erfahrungsberichte
Der SCADA-Systemmarktbericht von Insight Partners ist umfassend und bietet wertvolle Einblicke in aktuelle Trends und Zukunftsprognosen. Das Team war durchweg hochprofessionell, reaktionsschnell und hilfsbereit. Wir sind sehr zufrieden und können die Dienstleistungen wärmstens empfehlen.
RAN KEDEM Partner, Reali Technologies LTDsIch habe einen Bericht über einen sehr spezifischen Softwaremarkt angefordert, und das Team hat ihn innerhalb weniger Tage erstellt. Die Informationen waren sehr relevant und gut präsentiert. Anschließend habe ich einige Änderungen und Ergänzungen zum Bericht angefordert. Das Team reagierte erneut sehr schnell, und ich erhielt den Abschlussbericht in weniger als einer Woche.
JEAN-HERVE JENN Vorsitzende, Future AnalyticaWir haben mit The Insight Partners für eine wichtige Marktstudie und Prognose zusammengearbeitet. Sie gaben uns klare Einblicke in Chancen und Risiken, die uns bei der Gestaltung unserer Pläne halfen. Ihre Recherchen waren benutzerfreundlich und basierten auf soliden Daten. Sie halfen uns, kluge und sichere Entscheidungen zu treffen. Wir können sie wärmstens empfehlen.
PIYUSH NAGPAL Sr. Vizepräsident, Fernlicht GlobalDie Insight Partners lieferten aufschlussreiche, gut strukturierte Marktforschung mit fundierter Fachkompetenz. Ihr Team war durchweg professionell und reaktionsschnell. Die benutzerfreundliche Website ermöglichte den Zugriff auf Branchenberichte. Wir empfehlen sie wärmstens für zuverlässige und hochwertige Forschungsdienstleistungen.
YUKIHIKO ADACHI Geschäftsführer, Deep Blue, LLC.Dies ist das erste Mal, dass ich einen Marktbericht von The Insight Partners erworben habe. Obwohl ich zunächst unsicher war, besuchte ich die Website und fühlte mich dann sicherer, das Risiko einzugehen und einen Marktbericht zu kaufen. Ich bin mit der Qualität des Berichts und dem Kundenservice rundum zufrieden. Ich hatte einige Fragen und Anmerkungen zum ersten Bericht, aber nach einigen E-Mail-Gesprächen mit dem Analysten bin ich überzeugt, dass ich einen Bericht habe, den ich als Input für unseren strategischen Planungsprozess verwenden kann. Vielen Dank, dass Sie sich die Zeit genommen und dies zu einer positiven Erfahrung gemacht haben. Ich werde Ihren Service auf jeden Fall weiterempfehlen und Sie werden meine erste Anlaufstelle sein, wenn wir weitere Marktdaten benötigen.
JOHN SUZUKI Präsident und Chief Executive Officer, Vorstandsmitglied, BK TechnologiesIch möchte mich für Ihre Unterstützung und die Professionalität bedanken, die Sie bei der Bearbeitung meiner Informationsanfrage zum IVD-Markt für Infektionskrankheiten in Nigeria gezeigt haben. Ich schätze Ihre Geduld, Ihre Beratung und die Tatsache, dass Sie bereit waren, einen Rabatt anzubieten, der uns schließlich den Abschluss eines Geschäfts ermöglichte. Ich freue mich darauf, The Insight Partners in Zukunft wieder zu beauftragen, dank des Eindrucks, den Sie bei dieser ersten Begegnung bei mir hinterlassen haben.
DR. CHIJIOKE ONYIA GESCHÄFTSFÜHRERIN, PineCrest Healthcare Ltd.Grund zum Kauf
- Fundierte Entscheidungsfindung
- Marktdynamik verstehen
- Wettbewerbsanalyse
- Kundeneinblicke
- Marktprognosen
- Risikominimierung
- Strategische Planung
- Investitionsbegründung
- Identifizierung neuer Märkte
- Verbesserung von Marketingstrategien
- Steigerung der Betriebseffizienz
- Anpassung an regulatorische Trends


