
自适应交通控制系统市场增长机遇及至2031年预测
自适应交通控制系统市场规模及预测(2021-2031年),全球及区域份额、趋势和增长机会分析报告涵盖范围:按类型(硬件、软件和服务)、组件(OPAC、SCOOT、RHODES 和 SCATS)、应用[高速公路和城市]以及地理位置划分
- 状态 : 已发布
- 报告代码 : TIPRE00017749
- 类别 : 电子和半导体
- 页数 : 178
- 可用报告格式 :


- 最后更新日期 : August 06, 2024

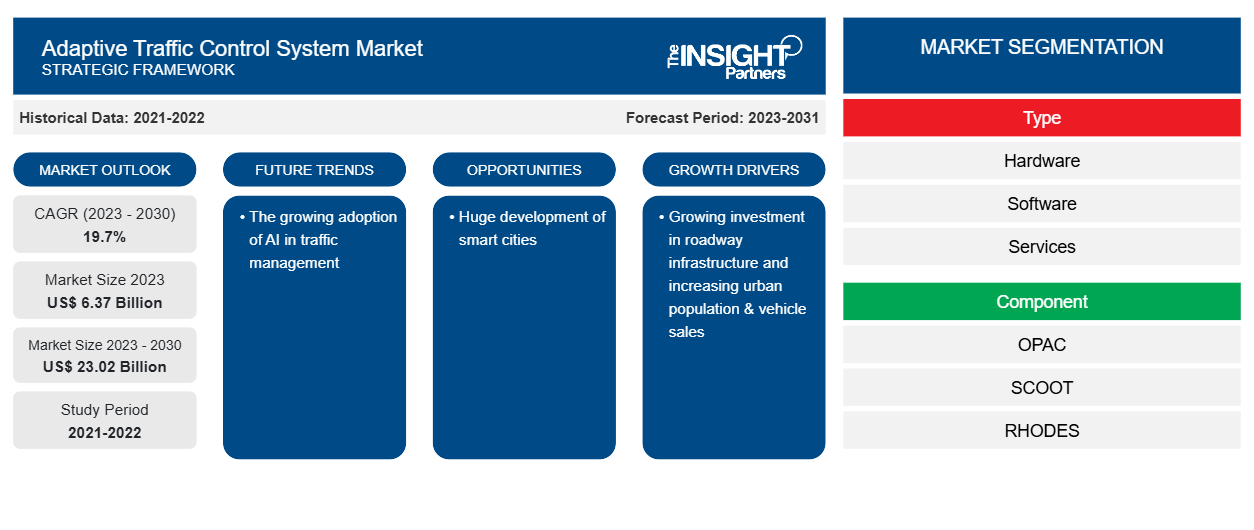
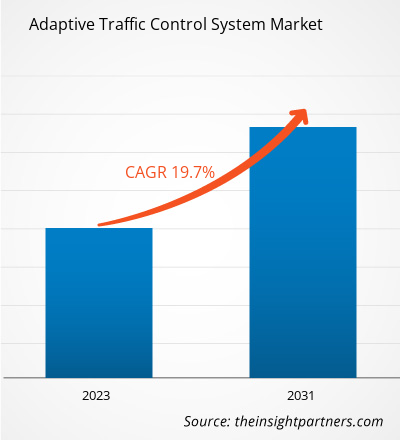
自适应交通控制系统市场规模预计将从 2023 年的 63.7 亿美元增至 2030 年的 230.2 亿美元。预计 2023-2030 年期间市场复合年增长率将达到 19.7%。交通管理中人工智能的日益普及可能仍将是市场的主要趋势。
自适应交通控制系统市场分析
过去几年,自适应交通控制系统市场由于道路基础设施投资不断增加、城市人口和汽车销量不断增加等因素而实现了显着增长。智慧城市的巨大发展为自适应交通控制系统市场提供了丰厚的增长机会。
自适应交通控制系统市场概况
自适应交通控制系统 (ATCS) 是一种解决方案,可帮助城市管理交通和行人信号以及复杂的道路网络,从而优化交通流量。自适应交通控制系统可适应实时交通模式,通过动态更改绿灯时间,从而优化交通流量。根据每个路口的交通量以及附近路口的预计到达人数,ATCS 算法会不断修改交通信号的时间。通过逐步让汽车通过绿灯,它可以显著缩短旅行时间,并通过促进更顺畅的交通来缓解交通压力。
定制此报告以满足您的需求
您可以免费定制任何报告,包括本报告的部分内容、国家级分析、Excel 数据包,以及为初创企业和大学提供优惠和折扣
自适应交通控制系统市场:战略洞察
-
获取此报告的关键市场趋势。这个免费样品将包括数据分析,从市场趋势到估计和预测。
自适应交通控制系统市场驱动因素和机遇
公路基础设施投资不断增长利好市场
由于人口不断增长,全球对更好的交通设施的需求不断增加,例如更好的道路状况、顺畅的交通流量和不同地区之间的连通性。因此,各国政府部门都致力于发展其道路基础设施。2022 年 6 月,中国政府宣布计划启动 120 条新高速公路和普通国道和省道项目,覆盖超过 3,600 公里。这些项目将共计拨款 272 亿美元(1820 亿元人民币)。同样,2022 年 3 月,VINCI Highways 宣布德国米尔豪森和巴特朗根萨尔察之间的 B247 公路扩建工程已经开始。对于这条公路的建设,政府已批准投资约 5.4561 亿美元(5 亿欧元)。此外,安大略省政府宣布,从 2022 年 4 月到 2023 年 3 月,将投资约 30 亿美元用于修复和扩建省级公路和桥梁。安大略省南部投入了近 17 亿美元,安大略省北部投入了约 6.24 亿美元用于修复和扩建公路和桥梁。对道路基础设施的投资不断增加,增加了实施自动交通控制系统以改善交通流量和提高车辆安全性的必要性。因此,乘客和驾驶员安全基础设施支出的增加促进了自适应交通控制系统市场的增长。
人工智能在交通管理中的应用日益广泛
由于人工智能 (AI) 的快速发展,道路交通管理发生了根本性的变化。如今,人工智能 (AI) 可以准确预测和管理交通网络沿线各个位置的人、物、汽车和货物的流动。人工智能不仅为公民提供了比以前更好的服务,而且还在道路因施工或其他事件而关闭时实现了更安全的出行时间,并通过优化路口的交通模式减少了事故数量。此外,人工智能处理和评估大量数据的能力使类似公共交通的拼车服务变得有效。
自适应交通控制系统市场报告细分分析
有助于得出自适应交通控制系统市场分析的关键部分是类型、组件和应用。
- 根据类型,自适应交通控制系统市场分为硬件、软件和服务。硬件部分将在 2022 年占据相当大的市场份额。
- 按组件划分,市场分为 OPAC、SCOOT、RHODES 和 SCATS。SCATS 部分在 2022 年占据了最大的市场份额。
- 在应用方面,市场分为高速公路和城市。2022 年,城市细分市场占据了最大的市场份额。
自适应交通控制系统市场份额(按地区)分析
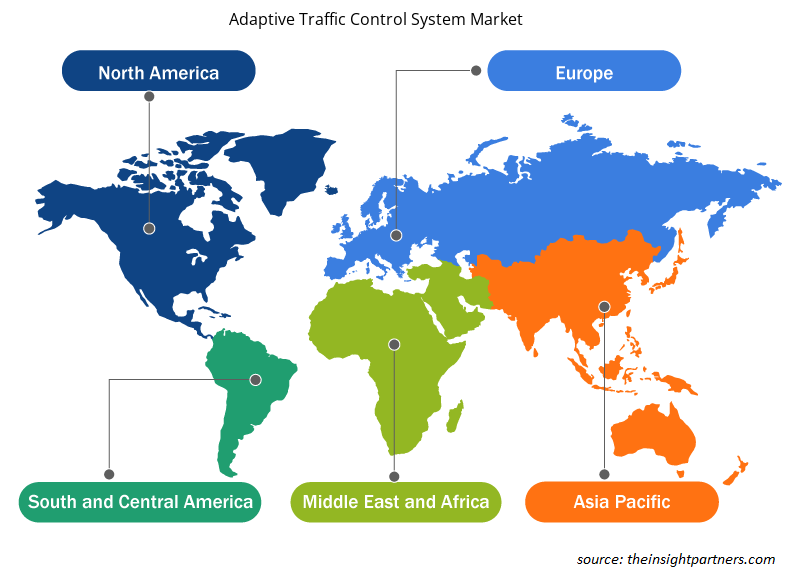
自适应交通控制系统市场报告的地理范围主要分为五个地区:北美、亚太、欧洲、中东和非洲、南美和中美。
自适应交通控制系统在英国、亚洲和澳大利亚得到广泛应用。美国只有不到 1% 的信号交叉口安装了自适应信号控制技术。除了硬件的潜在费用外,其他障碍(例如配置和维护系统所需的知识、缺乏主动性能测量以及对自适应信号控制技术优势的误解)可能会限制各国采用自适应交通控制系统。
自适应交通控制系统市场区域洞察
Insight Partners 的分析师已详尽解释了预测期内影响自适应交通控制系统市场的区域趋势和因素。本节还讨论了北美、欧洲、亚太地区、中东和非洲以及南美和中美洲的自适应交通控制系统市场细分和地理位置。
- 获取自适应交通控制系统市场的区域具体数据
自适应交通控制系统市场报告范围
| 报告属性 | 细节 |
|---|---|
| 2023 年的市场规模 | 63.7 亿美元 |
| 2030 年的市场规模 | 230.2亿美元 |
| 全球复合年增长率(2023 - 2030 年) | 19.7% |
| 史料 | 2021-2022 |
| 预测期 | 2023-2031 |
| 涵盖的领域 |
按类型
|
| 覆盖地区和国家 |
北美
|
| 市场领导者和主要公司简介 |
|
自适应交通控制系统市场参与者密度:了解其对业务动态的影响
自适应交通控制系统市场正在快速增长,这得益于终端用户需求的不断增长,这些需求源于消费者偏好的不断变化、技术进步以及对产品优势的认识不断提高等因素。随着需求的增加,企业正在扩大其产品范围,进行创新以满足消费者的需求,并利用新兴趋势,从而进一步推动市场增长。
市场参与者密度是指在特定市场或行业内运营的企业或公司的分布情况。它表明在给定市场空间中,相对于其规模或总市场价值,有多少竞争对手(市场参与者)存在。
在自适应交通控制系统市场运营的主要公司有:
- 奥尔德里奇交通管制员有限公司
- 数码相机公司
- EFKON 印度私人有限公司
- Efftronics Systems Pvt Ltd
- 卡普施交通通讯公司
- Trafiksol ITS Technologies Pvt Ltd
免责声明:上面列出的公司没有按照任何特定顺序排列。
- 获取自适应交通控制系统市场顶级关键参与者概览
自适应交通控制系统市场新闻和最新发展
自适应交通控制系统市场通过收集一手和二手研究后的定性和定量数据进行评估,其中包括重要的公司出版物、协会数据和数据库。自适应交通控制系统市场的一些发展如下所列:
- Yunex Traffic 宣布向美国市场推出 Yutraffic Blade 高级交通控制器平台。下一代边缘计算控制器具有双核处理器,功能强大,足以满足当今所有交通控制应用的需求,并为未来的应用做好准备。(来源:Yunex Traffic,新闻稿,2023 年 4 月)
- 城市土地运输局 (DULT) 已在 Ulsoor 附近的 Kensington Road 和 Murphy Road 交界处开始试运行新的交通信号系统。该系统采用了日本的 MODERATO(交通优化起点-终点相关适应管理)技术。(来源:THE HINDU BUREAU,新闻稿,2024 年 2 月)
自适应交通控制系统市场报告范围和交付成果
“自适应交通控制系统市场规模和预测(2020-2030 年)”报告对以下领域进行了详细的市场分析:
- 自适应交通控制系统市场规模及全球、区域和国家层面所有主要细分市场的预测,涵盖范围
- 自适应交通控制系统市场趋势,以及驱动因素、限制因素和关键机遇等市场动态
- 详细的 PEST/波特五力分析和 SWOT 分析
- 自适应交通控制系统市场分析涵盖主要市场趋势、全球和区域框架、主要参与者、法规和最新市场发展
- 行业格局和竞争分析,涵盖市场集中度、热图分析、知名参与者以及自适应交通控制系统市场的最新发展
- 详细的公司简介

Naveen 是一位经验丰富的市场研究和咨询专业人士,在定制项目、联合项目和咨询项目方面拥有超过 9 年的专业经验。他目前担任副总裁,成功管理了项目价值链中的利益相关者,撰写了 100 多份研究报告和 30 多项咨询项目。他的工作涵盖工业和政府项目,为客户的成功和数据驱动的决策做出了重要贡献。
Naveen 拥有卡纳塔克邦 VTU 的电子与通信工程学位,以及马尼帕尔大学的市场营销与运营 MBA 学位。他已担任 IEEE 会员 9 年,积极参与各种会议、技术研讨会,并在分部和地区层面担任志愿者。在此之前,他曾担任 IndustryARC 的助理战略顾问和惠普(惠普全球)的工业服务器顾问。
- 全面的市场规模与预测分析
- 详细的细分市场分析
- 深入的市场动态评估
- 区域及国家级洞察
- 竞争格局与企业对标分析
- 战略性商业情报
客户评价
Insight Partners 的 SCADA 系统市场报告内容全面,对当前趋势和未来预测提供了宝贵的见解。该团队始终高度专业、响应迅速且乐于助人。我们非常满意,强烈推荐他们的服务。
兰·凯德姆 伙伴, Reali Technologies LTD我请求一份关于特定软件市场的报告,团队在几天内就完成了。报告信息非常相关,而且呈现得非常出色。之后,我请求对报告进行一些修改和补充。团队再次迅速响应,不到一周我就收到了最终报告。
让-埃尔韦·詹恩 主席, 未来分析公司我们与 Insight Partners 合作进行了一项重要的市场研究和预测。他们清晰地洞察了机遇和风险,帮助我们制定了计划。他们的研究简单易用,数据可靠,帮助我们做出了明智而自信的决策。我们强烈推荐他们。
皮尤什·纳格帕尔 高级副总裁, 远光全球Insight Partners 凭借其深厚的行业专业知识,提供了富有洞察力、结构合理的市场研究。他们的团队始终专业且响应迅速。用户友好的网站让访问行业报告变得顺畅无阻。我们强烈推荐他们可靠、高质量的研究服务。
安达幸彦 首席执行官, 深蓝有限责任公司这是我第一次从The Insight Partners购买市场报告。起初我有些犹豫,但访问了他们的网站后,我更放心地冒险购买市场报告。我对报告的质量和客户服务非常满意。我对最初的报告有一些疑问和意见,但在与他们的分析师通过电子邮件沟通了几次后,我相信这份报告可以作为我们战略规划流程的参考。非常感谢您抽出宝贵的时间,让这次体验如此愉快。我一定会向其他人推荐你们的服务,当我们需要更多市场数据时,你们将是我的首选。
约翰·铃木 总裁兼首席执行官、董事会董事, BK科技感谢您在处理我关于尼日利亚传染病体外诊断市场信息请求的过程中所展现的支持和专业精神。感谢您的耐心、指导,以及您愿意提供的折扣,最终促成了这笔交易。我期待未来与 Insight Partners 继续合作,这一切都要归功于您与我初次接触后留下的良好印象。
奇吉奥克博士 ONYIA 董事总经理, PineCrest 医疗保健有限公司购买理由
- 明智的决策
- 了解市场动态
- 竞争分析
- 客户洞察
- 市场预测
- 风险规避
- 战略规划
- 投资论证
- 识别新兴市场
- 优化营销策略
- 提升运营效率
- 顺应监管趋势


