模数转换器市场分析、规模及份额预测(至2031年)
历史数据 : 2021-2022 | 基准年 : 2022 | 预测期 : 2023-2031模数转换器市场规模及预测(2021-2031年),全球及区域份额、趋势及增长机会分析报告涵盖范围:按类型(积分型模数转换器、Delta-Sigma型模数转换器、逐次逼近型模数转换器、斜坡型模数转换器及其他)、分辨率(8位、10位、12位、14位、16位及其他)、应用(工业、消费电子、汽车、医疗保健、电信及其他)和地域划分
- 状态 : 已发布
- 报告代码 : TIPRE00034165
- 类别 : 电子和半导体
- 页数 : 208
- 可用报告格式 :


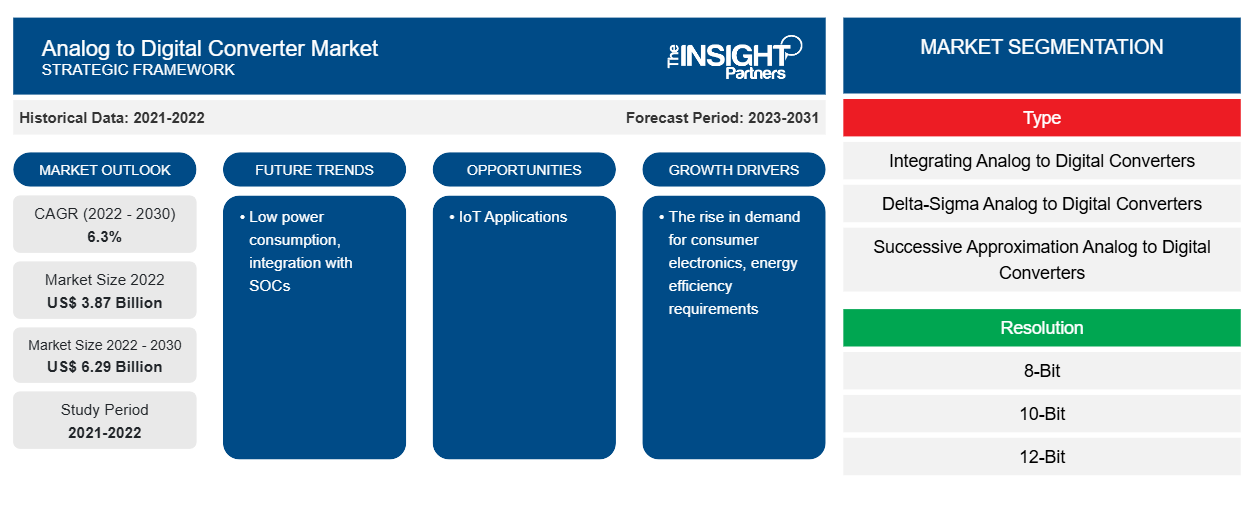
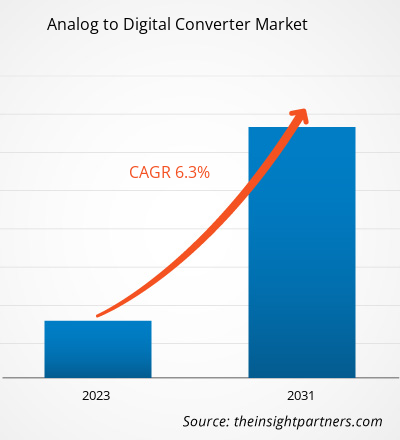
预计到 2030 年,模拟数字转换器市场规模将从 2022 年的 38.7 亿美元增至 62.9 亿美元。预计 2022-2030 年期间市场复合年增长率将达到 6.3%。低功耗和与 SOC 的集成可能仍是市场的主要趋势。
模拟数字转换器市场分析
数据转换器在实现高分辨率内容以实现超高质量播放音乐体验方面发挥着关键作用。这些转换器可过滤不需要的噪声并确保低功耗,从而最大程度地延长耳机等设备的电池寿命。制造商发现对更快转换速度和更高分辨率的需求日益增加。 模拟数字转换器市场正在进行多项开发 ,以实现更高的精度、更宽的动态范围和有效的兼容性。新过采样技术的进步显著有助于降低转换器的成本。据许多制造商称,数据采集系统设计人员对更高分辨率的需求归因于他们希望利用分辨率的每一位。更高分辨率的转换器提供有关数据的关键和附加详细信息。
预计通信领域的进步(例如 5G 的推出)将为模数转换器开辟新的应用领域。模数转换器 (ADC) 集成到 5G 基站中 ,用于将模拟值转换为数字值,以方便用户使用。印度、中国、美国、德国和巴西等国家正在经历 5G 试验的兴起。此外,ADC 还用于汽车领域,并应用于远程信息处理系统和激光雷达。半导体、汽车、电信和工业等无数行业都需要 ADC。它们还用于成像电荷耦合器件 (CCD),包括扫描仪、数码相机、摄像机和测试仪器。
模拟数字转换器市场概况
模数转换器 (ADC) 有助于将从环境现象接收到的模拟信号转换为数字信号。整个转换过程包括几个步骤,例如采样、量化和编码。ADC 是必不可少的组件,因为必须将模拟值转换为数字值才能进行进一步处理。市场上存在各种类型的 ADC,包括同步或闪存 ADC、跟踪型 ADC、计数器型 ADC、逐次逼近型 ADC、sigma-delta ADC 以及单斜率、双斜率和多斜率 ADC。这些转换器可应用于数字信号处理(微控制器、电视调谐卡、数字存储示波器)、科学仪器(数字成像系统、 温度传感器、雷达系统)和数字音频(录音、数字音频工作站和脉冲编码调制)。
定制此报告以满足您的需求
您可以免费定制任何报告,包括本报告的部分内容、国家级分析、Excel 数据包,以及为初创企业和大学提供优惠和折扣
模拟数字转换器市场:战略洞察
-
获取此报告的关键市场趋势。这个免费样品将包括数据分析,从市场趋势到估计和预测。
模拟数字转换器市场驱动因素和机遇
消费电子产品需求上升利好市场
城市化进程加快和可支配收入增加是电子行业蓬勃发展的主要推动力。根据美国经济分析局的数据,2023 年 3 月,美国 2023 年 2 月的可支配个人收入 (DPI) 与 2023 年 1 月相比增长了 0.5%。人们可支配收入的增长促进了强劲的购买力,从而推动了电视机、微波炉和其他 消费电子产品的销售。此外,政府为提高国内生产产量而采取的举措增多,对促进不同国家的电子行业发展起着至关重要的作用。根据电子和信息技术部的数据,2023 年 3 月,预计到 2025-2026 年,印度电子制造业将达到 3000 亿美元。政府的战略步骤和举措有利于电子行业的发展。根据印度 2019 年国家电子政策 (NPE 2019),为大规模电子制造业引入了特殊计划。
智能手机、平板电脑、智能电视、游戏设备、AR/VR 设备和智能扬声器等消费电子设备的需求不断增长,推动了消费电子行业的发展。ADC 部署在最先进的电子设备和应用中。它有助于将现实世界的输入转换为数字信号进行处理和存储。消费音频和家庭影院系统制造中对音频 ADC 的需求激增,推动了模拟数字转换器市场的增长。
物联网应用
传感器是物联网 (IoT) 复杂生态系统中不可或缺的代理,可监测各种物理特性,例如温度、湿度、压力、光线、运动等。大多数传感器提供与它们应该测量的物理现象相关的模拟信号。然而,为了有效地收集、分析和传输物联网网络上的传感器数据,必须将模拟信号转换为数字格式。这项关键工作由模数转换器 (ADC) 完成。
模拟数字转换器市场报告细分分析
有助于得出模数转换器市场分析的关键部分是传感类型、电流方向和最终用户。
- 根据类型,模拟数字转换器市场分为集成模拟数字转换器、delta-sigma 模拟数字转换器、逐次逼近模拟数字转换器、斜坡模拟数字转换器等。逐次逼近模拟数字转换器部分在 2023 年占据最大份额。
- 根据分辨率,市场分为 8 位、10 位、12 位、14 位、16 位和其他。
- 根据应用,市场分为工业、消费电子、汽车、医疗保健、电信等。
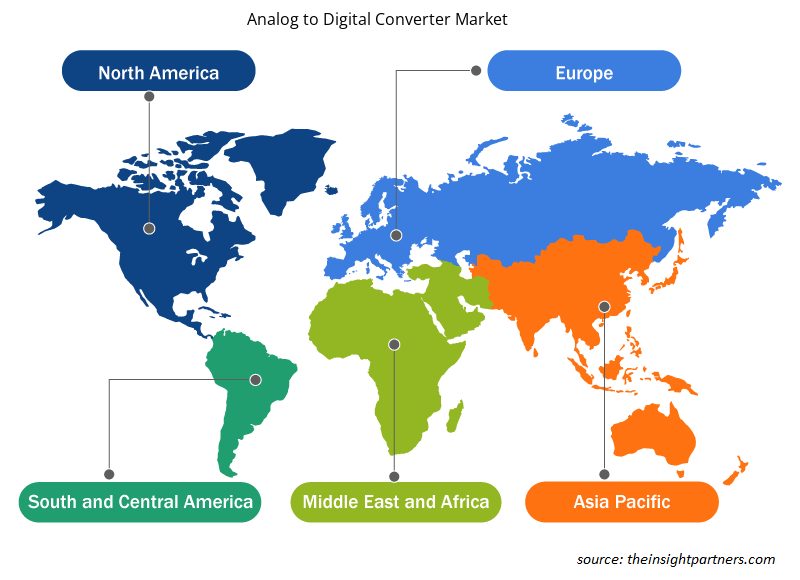
模拟数字转换器市场份额按地区分析
模拟数字转换器市场报告的地理范围主要分为五个区域:北美、亚太、欧洲、中东和非洲、南美和中美。
2022 年,北美占据了模拟数字转换器市场份额的主导地位。北美市场分为美国、加拿大和墨西哥。2022 年,美国占据了北美模拟数字转换器市场的最大份额。美国是 Analog Devices, Inc.、Cirrus Logic, Inc.、Microchip Technology, Inc. 和 Texas Instruments Incorporated 等主要市场参与者的所在地。美国是制造业、IT 和汽车业的中心,其他行业需要技术先进的解决方案来确保生产和其他流程的精确性和准确性。美国总统拜登签署的《两党基础设施法》是美国基础设施的千载难逢的投资。此类举措预计将增加电信基础设施,进一步推动北美对 ADC 的采用。
模拟数字转换器市场区域洞察
Insight Partners 的分析师已详尽解释了预测期内影响模拟数字转换器市场的区域趋势和因素。本节还讨论了北美、欧洲、亚太地区、中东和非洲以及南美和中美洲的模拟数字转换器市场细分和地理位置。
- 获取模拟数字转换器市场的区域特定数据
模拟数字转换器市场报告范围
| 报告属性 | 细节 |
|---|---|
| 2022 年市场规模 | 38.7 亿美元 |
| 2030 年的市场规模 | 62.9 亿美元 |
| 全球复合年增长率(2022 - 2030 年) | 6.3% |
| 史料 | 2021-2022 |
| 预测期 | 2023-2031 |
| 涵盖的领域 |
按类型
|
| 覆盖地区和国家 |
北美
|
| 市场领导者和主要公司简介 |
|
模拟数字转换器市场参与者密度:了解其对业务动态的影响
模拟数字转换器市场正在快速增长,这得益于终端用户需求的不断增长,而这些需求又源于消费者偏好的不断变化、技术进步以及对产品优势的认识不断提高等因素。随着需求的增加,企业正在扩大其产品范围,进行创新以满足消费者的需求,并利用新兴趋势,从而进一步推动市场增长。
市场参与者密度是指在特定市场或行业内运营的企业或公司的分布情况。它表明在给定市场空间中,相对于其规模或总市场价值,有多少竞争对手(市场参与者)存在。
在模拟数字转换器市场运营的主要公司有:
- 旭化成微电子公司
- ADI 公司
- Cirrus Logic 公司
- 微芯片科技公司
- 半导体元件行业
- LL罗姆有限公司
免责声明:上面列出的公司没有按照任何特定顺序排列。
- 获取模拟数字转换器市场顶级关键参与者概述
模拟数字转换器市场新闻和最新发展
模拟数字转换器市场通过收集一手和二手研究后的定性和定量数据进行评估,其中包括重要的公司出版物、协会数据和数据库。模拟数字转换器市场的一些发展如下所列:
- Agile Analog 推出了其首款可定制、与工艺无关的 12 位模数转换器 IP,以满足对这些转换器越来越高的分辨率的需求。(来源:Agile Analog,新闻稿,2023 年 2 月)
- 瑞萨电子公司为其广受欢迎的 RL78 微控制器 (MCU) 系列推出了一款新产品,该系列包括适用于功耗敏感型应用的 8 位和 16 位器件。新推出的 RL78/G24 系列的主要功能之一是其 12 位模拟数字转换器,能够同时对 3 个通道进行采样,最大转换速度为 1 微秒 (µs)。(来源:瑞萨电子公司,新闻稿,2019 年 3 月)
模拟数字转换器市场报告覆盖范围和交付成果
“模数转换器市场规模和预测(2020-2030)”报告对以下领域进行了详细的市场分析:
- 模拟数字转换器市场规模及全球、区域和国家层面所有主要细分市场的预测
- 模拟数字转换器市场趋势,以及驱动因素、限制因素和关键机遇等市场动态
- 详细的 PEST/波特五力分析和 SWOT 分析
- 模拟数字转换器市场分析涵盖主要市场趋势、全球和区域框架、主要参与者、法规和最新市场发展
- 行业格局和竞争分析,涵盖市场集中度、热图分析、知名参与者以及模拟数字转换器市场的最新发展
- 详细的公司简介

Naveen 是一位经验丰富的市场研究和咨询专业人士,在定制项目、联合项目和咨询项目方面拥有超过 9 年的专业经验。他目前担任副总裁,成功管理了项目价值链中的利益相关者,撰写了 100 多份研究报告和 30 多项咨询项目。他的工作涵盖工业和政府项目,为客户的成功和数据驱动的决策做出了重要贡献。
Naveen 拥有卡纳塔克邦 VTU 的电子与通信工程学位,以及马尼帕尔大学的市场营销与运营 MBA 学位。他已担任 IEEE 会员 9 年,积极参与各种会议、技术研讨会,并在分部和地区层面担任志愿者。在此之前,他曾担任 IndustryARC 的助理战略顾问和惠普(惠普全球)的工业服务器顾问。
- 历史分析(2 年)、基准年、预测(7 年)及复合年增长率
- PEST和SWOT分析
- 市场规模、价值/数量 - 全球、区域、国家
- 行业和竞争格局
- Excel 数据集
客户评价
Insight Partners 的 SCADA 系统市场报告内容全面,对当前趋势和未来预测提供了宝贵的见解。该团队始终高度专业、响应迅速且乐于助人。我们非常满意,强烈推荐他们的服务。
兰·凯德姆 伙伴, Reali Technologies LTD我请求一份关于特定软件市场的报告,团队在几天内就完成了。报告信息非常相关,而且呈现得非常出色。之后,我请求对报告进行一些修改和补充。团队再次迅速响应,不到一周我就收到了最终报告。
让-埃尔韦·詹恩 主席, 未来分析公司我们与 Insight Partners 合作进行了一项重要的市场研究和预测。他们清晰地洞察了机遇和风险,帮助我们制定了计划。他们的研究简单易用,数据可靠,帮助我们做出了明智而自信的决策。我们强烈推荐他们。
皮尤什·纳格帕尔 高级副总裁, 远光全球Insight Partners 凭借其深厚的行业专业知识,提供了富有洞察力、结构合理的市场研究。他们的团队始终专业且响应迅速。用户友好的网站让访问行业报告变得顺畅无阻。我们强烈推荐他们可靠、高质量的研究服务。
安达幸彦 首席执行官, 深蓝有限责任公司这是我第一次从The Insight Partners购买市场报告。起初我有些犹豫,但访问了他们的网站后,我更放心地冒险购买市场报告。我对报告的质量和客户服务非常满意。我对最初的报告有一些疑问和意见,但在与他们的分析师通过电子邮件沟通了几次后,我相信这份报告可以作为我们战略规划流程的参考。非常感谢您抽出宝贵的时间,让这次体验如此愉快。我一定会向其他人推荐你们的服务,当我们需要更多市场数据时,你们将是我的首选。
约翰·铃木 总裁兼首席执行官、董事会董事, BK科技感谢您在处理我关于尼日利亚传染病体外诊断市场信息请求的过程中所展现的支持和专业精神。感谢您的耐心、指导,以及您愿意提供的折扣,最终促成了这笔交易。我期待未来与 Insight Partners 继续合作,这一切都要归功于您与我初次接触后留下的良好印象。
奇吉奥克博士 ONYIA 董事总经理, PineCrest 医疗保健有限公司购买理由
- 明智的决策
- 了解市场动态
- 竞争分析
- 客户洞察
- 市场预测
- 风险规避
- 战略规划
- 投资论证
- 识别新兴市场
- 优化营销策略
- 提升运营效率
- 顺应监管趋势


 获取免费样品 - 模数转换器市场