

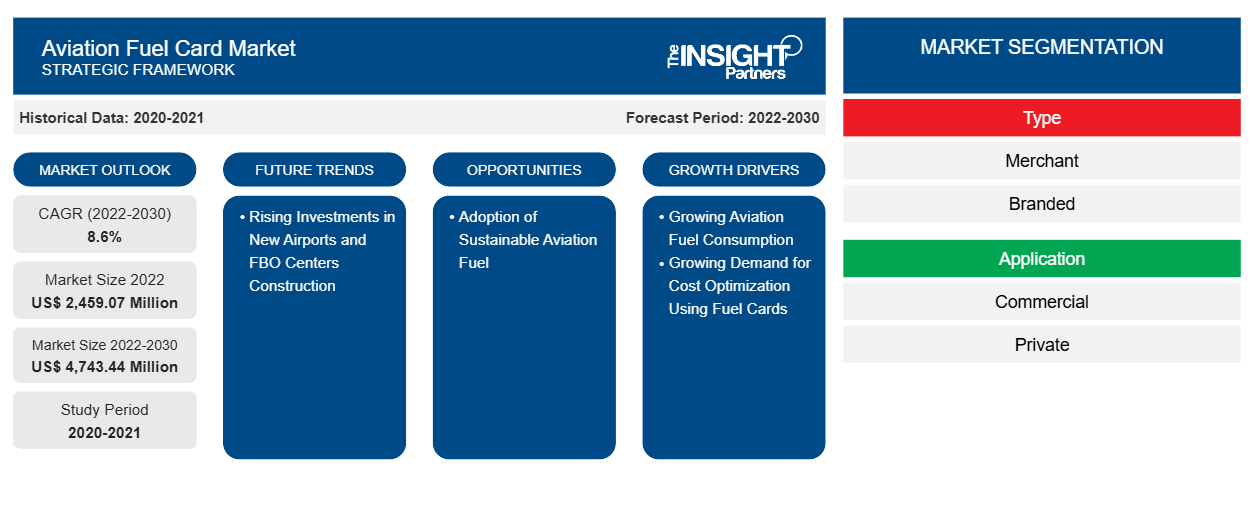
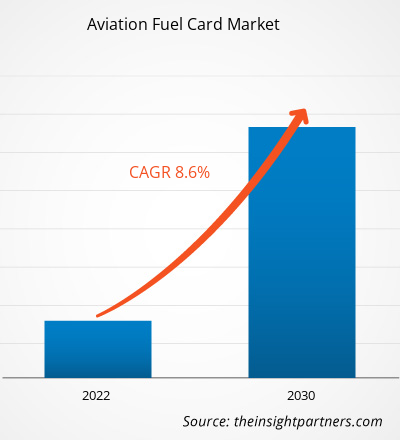
航空燃料卡市场规模预计将从 2022 年的 24.5907 亿美元增至 2030 年的 47.4344 亿美元。预计 2022-2030 年市场复合年增长率为 8.6%。
传统上,航空业以多种方式支付燃油费用,具体取决于燃油行业和航空公司的经济状况以及现有的协议。航空公司和其他航空业经常在现货市场上购买燃油,要么直接从石油公司购买,要么通过燃油经纪人购买。在这种情况下,航空公司很可能会以现金和信用相结合的方式支付燃油费用。总体而言,航空业用于购买燃油的付款方式将由多种标准决定,例如公司的规模、位置、采购策略、市场条件和可用的可能性。集成成本管理软件的高限额公司卡可以更轻松地监控燃油支付。高限额卡为企业提供了更大的支付灵活性,这意味着他们可以继续运营而无需面对银行延迟和贷款费用。此外,与很少与成本管理软件挂钩的汽油卡不同 ,来自支出管理公司的高限额公司信用卡提供了完全集成的体验。公司信用卡使集中燃油账单和简化整体费用管理流程变得简单。无需依赖不同的付款方式或退款,一张信用卡即可用于所有与燃料相关的购买,从而更轻松地跟踪和管理支出。使用商业信用卡整合燃料支出有助于与燃料供应商建立更紧密的联系。经常使用一张卡进行燃料交易的航空公司可以在批量折扣或优惠条款方面与燃料供应商拥有更大的谈判能力。因此,其他替代方法提供的好处阻碍了航空燃料卡市场的增长。
航空燃料卡市场分析
许多燃料生产商和航空公司都在积极开发和采用可持续航空燃料。2023 年,在迪拜航展上,波音公司和 Zero Petroleum 的官员签署了一项协议,以加速合成可持续航空燃料 (SAF) 的开发。2023 年,Neste 协助特罗尔海坦-维纳斯堡机场和航空公司 Västflyg 成为世界上第一家在所有航班上使用可持续航空燃料的航空公司。2023 年,阿联酋航空同意通过与壳牌航空的合作,向该航空公司在迪拜 (DXB) 的国际枢纽供应约 30 万加仑的混合可持续航空燃料 (SAF)。预计此类举措将增加可持续航空燃料的采用。航空燃料卡供应商可以通过在购买可持续航空燃料时提供有吸引力的优惠和折扣来扩大业务。这最终将导致航空燃料卡的采用和使用率更高。此外,通过与固定基地运营商合作,燃料卡服务提供商可以扩大供应可持续航空燃料的网络。因此,预计可持续航空燃料交易的增长将为预测期内航空燃料卡市场的增长提供充足的机会。
航空燃料卡市场概览
燃油卡供应商在航空燃油卡市场生态系统中的作用对于确保燃油卡的无缝运行和可靠性至关重要。航空燃油卡供应商在向商业和私人航空公司等最终用户提供燃油卡服务方面发挥着重要作用。燃油卡供应商确保航空燃油支付流程的安全和高效。提供燃油卡服务的主要燃油供应商被称为品牌燃油供应商,包括 BP plc、Shell Global、ExxonMobil、Titan Aviation Fuels、Jio-BP、AEGFUELS 和 TotalEnergies Aviation。这些实体负责自行供应航空燃油和航空燃油卡,从而确保可靠的航空燃油卡供应链。提供燃油卡服务的第三方和私营公司被称为商户燃油供应商,包括 World Fuel Services、CSI global-fleet、Aviation Pros 和 Avfuel Corporation。商户燃油卡供应商是与主要航空燃油供应商建立合作伙伴关系或合作并确保无缝和安全支付流程的实体。这种伙伴关系或合作涉及集成系统以促进高效交易并维持可靠的燃油供应。
定制此报告以满足您的需求
您可以免费定制任何报告,包括本报告的部分内容、国家级分析、Excel 数据包,以及为初创企业和大学提供优惠和折扣
航空燃料卡市场:战略洞察
-
获取此报告的关键市场趋势。这个免费样品将包括数据分析,从市场趋势到估计和预测。
航空燃料卡市场的驱动因素和机遇
航空燃料消耗增加
由于航空旅行需求旺盛,总体燃料消耗增加。2022 年,美国航空公司运送的乘客比 2021 年多 1.94 亿人次,同比增长 30%。2022 年 1 月至 12 月,美国航空公司运送乘客 8.53 亿人次,高于 2021 年的 6.58 亿人和 2020 年的 3.88 亿人次。2021 年,欧盟 (EU) 的航空旅行出现显著反弹,乘客总数达到 3.73 亿人次。与上一年 2020 年相比,这一数字显著增长了 34.9%。克罗地亚的航空客运量激增,与 2021 年相比,显著增长了 84%。此外,塞浦路斯和希腊分别录得 104.8% 和 85.9% 的大幅增长率。乘客数量的激增,特别是在克罗地亚、塞浦路斯和希腊等国家,凸显了航空旅行需求的不断增长以及随之而来的燃料需求。
新机场和固定基地运营商中心建设投资不断增加
全球各发达国家和发展中国家都在致力于增加机场总数。2023 年,越南政府计划到 2030 年建成 30 多个机场,以促进旅游业和贸易发展。该国已建成 22 个机场;然而,政府正致力于建设新机场,以容纳越来越多的飞机。越南政府于 2021 年批准建设隆城国际机场,预计 2025 年竣工。隆城国际机场将成为越南最大的机场,每年可容纳 1 亿人次。政府的目标是到 2030 年将机场扩建到 30 多个,这表明该国致力于发展航空业。2023 年,沙特阿拉伯宣布扩大其国内航空业,这将需要1000 亿美元的投资。 2023 年,印度宣布未来两年将在机场投资 120 亿美元,包括订购数百架新飞机,以满足不断增长的旅行需求,这给现有的基础设施带来了负担。
航空燃料卡市场报告细分分析
有助于得出航空燃料卡市场分析的关键部分是类型、应用和地理位置。
- 根据类型,航空燃料卡市场分为商户和品牌。商户部分在 2022 年占据了更大的市场份额。
- 根据应用,航空燃料卡市场分为商业和私人。商业领域在 2022 年占据了最大的市场份额。
航空燃料卡市场份额(按地区)分析
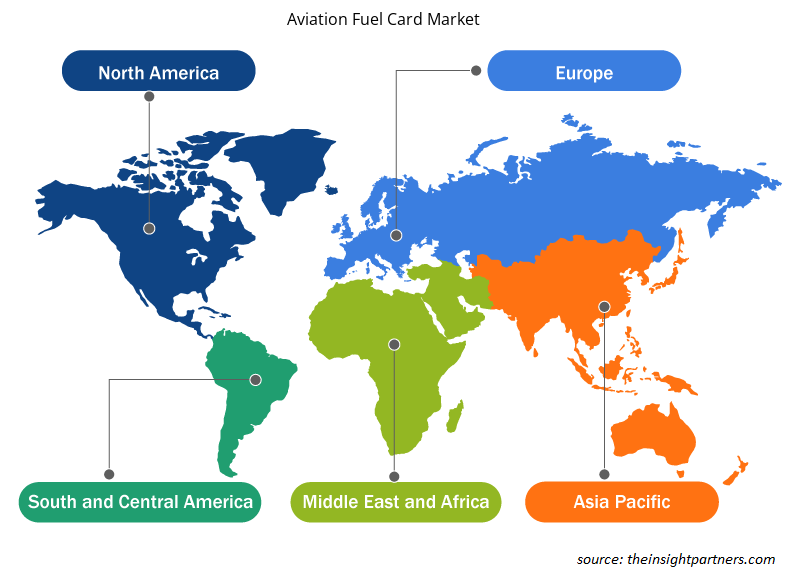
The geographic scope of the Aviation Fuel Card Market report is mainly divided into five regions: North America, Europe, Asia Pacific, Middle East & Africa, and South America.
North America has dominated the Aviation Fuel Card Market in 2022, and it is expected to retain its dominance during the forecast period as well. The North America aviation fuel card industry is mainly driven by the growing awareness of the fuel card concept. Moreover, the growing aviation industry in countries such as the US and Canada is further driving the aviation fuel card market. The aviation industry is one of the notable industries in the US. As per the data published by the Airlines for America in 2023, commercial aviation accounted for 5% of US GDP and US$ 1.25 trillion in 2022. In addition, a large network of airports and fixed base operators in the US has supported the increased use of aviation fuel cards. In 2022, the US operated more than 5,100 public airports and 14,850 private airports. The air transportation industry contributes significantly to the Canadian economy. As per the International Air Transport Association (IATA), the industry contributed US$ 37 billion to Canadian GDP in 2018. Rising aviation fuel consumption and increasing aviation prices are driving the aviation fuel card market in Mexico. In June 2022, state-owned Pemex's wholesale jet fuel prices increased dramatically. The US held the largest share in the North America aviation fuel card market in 2022.
Aviation Fuel Card Market Regional Insights
The regional trends and factors influencing the Aviation Fuel Card Market throughout the forecast period have been thoroughly explained by the analysts at Insight Partners. This section also discusses Aviation Fuel Card Market segments and geography across North America, Europe, Asia Pacific, Middle East and Africa, and South and Central America.
- Get the Regional Specific Data for Aviation Fuel Card Market
Aviation Fuel Card Market Report Scope
| Report Attribute | Details |
|---|---|
| Market size in 2022 | US$ 2,459.07 Million |
| Market Size by 2030 | US$ 4,743.44 Million |
| Global CAGR (2022-2030) | 8.6% |
| Historical Data | 2020-2021 |
| Forecast period | 2022-2030 |
| Segments Covered |
By Type
|
| Regions and Countries Covered |
North America
|
| Market leaders and key company profiles |
|
Aviation Fuel Card Market Players Density: Understanding Its Impact on Business Dynamics
航空燃油卡市场正在快速增长,这得益于终端用户需求的不断增长,而这些需求又源于消费者偏好的不断变化、技术进步以及对产品优势的认识不断提高等因素。随着需求的增加,企业正在扩大其产品范围,进行创新以满足消费者的需求,并利用新兴趋势,从而进一步推动市场增长。
市场参与者密度是指在特定市场或行业内运营的企业或公司的分布情况。它表明在给定市场空间中,相对于其规模或总市场价值,有多少竞争对手(市场参与者)存在。
在航空燃料卡市场运营的主要公司有:
- 壳牌公司
- 英国石油公司
- 联合能源集团有限公司
- 维瓦能源集团有限公司
- 泰坦航空燃料公司
免责声明:上面列出的公司没有按照任何特定顺序排列。
- 获取航空燃料卡市场顶级关键参与者概览
航空燃料卡市场新闻和最新发展
航空燃油卡市场通过收集一级和二级研究后的定性和定量数据进行评估,其中包括重要的公司出版物、协会数据和数据库。以下是航空燃油卡市场的发展和战略列表:
- 2023 年 9 月,国际航空燃料产品和服务供应商 Air bp 在与 ExecuJet 达成的新代理合作中,在柏林勃兰登堡机场 (BER) 通用航空 (GA) 航站楼推出了 Jet-A1 燃料。(来源:Air BP,新闻稿/公司网站/通讯)
- 2022 年 10 月,全球 B2B 支付和发票网络 TreviPay 推出了由 KHI 提供支持的 TreviPay 航空网络,旨在提供联合品牌的闭环卡解决方案,以满足为通用和国防航空行业提供服务的 FBO(固定基地运营商)和飞行支持服务组织及其客户的需求。(来源:TreviPay,新闻稿/公司网站/通讯)
航空燃料卡市场报告范围和交付成果
“航空燃油卡市场规模和预测(2020-2030 年)”报告对以下领域进行了详细的市场分析:
- 范围内所有主要细分市场的全球、区域和国家层面的市场规模和预测
- 市场动态,如驱动因素、限制因素和关键机遇
- 未来主要趋势
- 详细的波特五力分析
- 全球和区域市场分析涵盖关键市场趋势、主要参与者、法规和最新市场发展
- 行业格局和竞争分析,涵盖市场集中度、热点图分析、知名参与者和最新发展
- 带有 SWOT 分析的详细公司简介

Ankita 是一位充满活力的市场研究和咨询专家,在科技、媒体、信息通信技术 (ICT) 以及电子和半导体领域拥有超过 8 年的经验。她成功领导并完成了 100 多项咨询和研究项目,服务对象包括微软、甲骨文、NEC Corporation、SAP、毕马威和 Expeditors International 等全球客户。她的核心能力包括市场评估、数据分析、预测、战略制定、竞争情报和报告撰写。
Ankita 擅长处理完整的项目周期——从售前的方案设计和客户洽谈,到售后提供切实可行的洞察。她擅长管理跨职能团队、构建复杂的研究模块,并根据客户特定的业务目标调整解决方案。她卓越的沟通能力、领导能力和演讲能力使她能够在快速变化的市场环境中持续提供价值驱动的成果。
- 历史分析(2 年)、基准年、预测(7 年)及复合年增长率
- PEST和SWOT分析
- 市场规模、价值/数量 - 全球、区域、国家
- 行业和竞争格局
- Excel 数据集
近期报告
客户评价
Insight Partners 的 SCADA 系统市场报告内容全面,对当前趋势和未来预测提供了宝贵的见解。该团队始终高度专业、响应迅速且乐于助人。我们非常满意,强烈推荐他们的服务。
兰·凯德姆 伙伴, Reali Technologies LTD我请求一份关于特定软件市场的报告,团队在几天内就完成了。报告信息非常相关,而且呈现得非常出色。之后,我请求对报告进行一些修改和补充。团队再次迅速响应,不到一周我就收到了最终报告。
让-埃尔韦·詹恩 主席, 未来分析公司我们与 Insight Partners 合作进行了一项重要的市场研究和预测。他们清晰地洞察了机遇和风险,帮助我们制定了计划。他们的研究简单易用,数据可靠,帮助我们做出了明智而自信的决策。我们强烈推荐他们。
皮尤什·纳格帕尔 高级副总裁, 远光全球Insight Partners 凭借其深厚的行业专业知识,提供了富有洞察力、结构合理的市场研究。他们的团队始终专业且响应迅速。用户友好的网站让访问行业报告变得顺畅无阻。我们强烈推荐他们可靠、高质量的研究服务。
安达幸彦 首席执行官, 深蓝有限责任公司这是我第一次从The Insight Partners购买市场报告。起初我有些犹豫,但访问了他们的网站后,我更放心地冒险购买市场报告。我对报告的质量和客户服务非常满意。我对最初的报告有一些疑问和意见,但在与他们的分析师通过电子邮件沟通了几次后,我相信这份报告可以作为我们战略规划流程的参考。非常感谢您抽出宝贵的时间,让这次体验如此愉快。我一定会向其他人推荐你们的服务,当我们需要更多市场数据时,你们将是我的首选。
约翰·铃木 总裁兼首席执行官、董事会董事, BK科技感谢您在处理我关于尼日利亚传染病体外诊断市场信息请求的过程中所展现的支持和专业精神。感谢您的耐心、指导,以及您愿意提供的折扣,最终促成了这笔交易。我期待未来与 Insight Partners 继续合作,这一切都要归功于您与我初次接触后留下的良好印象。
奇吉奥克博士 ONYIA 董事总经理, PineCrest 医疗保健有限公司购买理由
- 明智的决策
- 了解市场动态
- 竞争分析
- 客户洞察
- 市场预测
- 风险规避
- 战略规划
- 投资论证
- 识别新兴市场
- 优化营销策略
- 提升运营效率
- 顺应监管趋势


 获取免费样品 - 航空燃油卡市场