
2028 年二氧化碳分析仪市场报告(按细分市场、地域、动态、最新发展和战略见解)
二氧化碳分析仪市场预测至 2028 年 - COVID-19 影响和全球分析,按产品类型(二氧化碳分析仪配件和一次性用品、二氧化碳分析仪)、技术(主流二氧化碳分析仪、侧流二氧化碳分析仪和微流二氧化碳分析仪)、应用(心脏护理、创伤和急救护理、程序镇静、呼吸监测和其他应用)和最终用户(医院、门诊手术中心、家庭护理机构等)
- 状态 : 已发布
- 报告代码 : TIPRE00003130
- 类别 : 生命科学
- 页数 : 250
- 可用报告格式 :


- 最后更新日期 : June 13, 2024

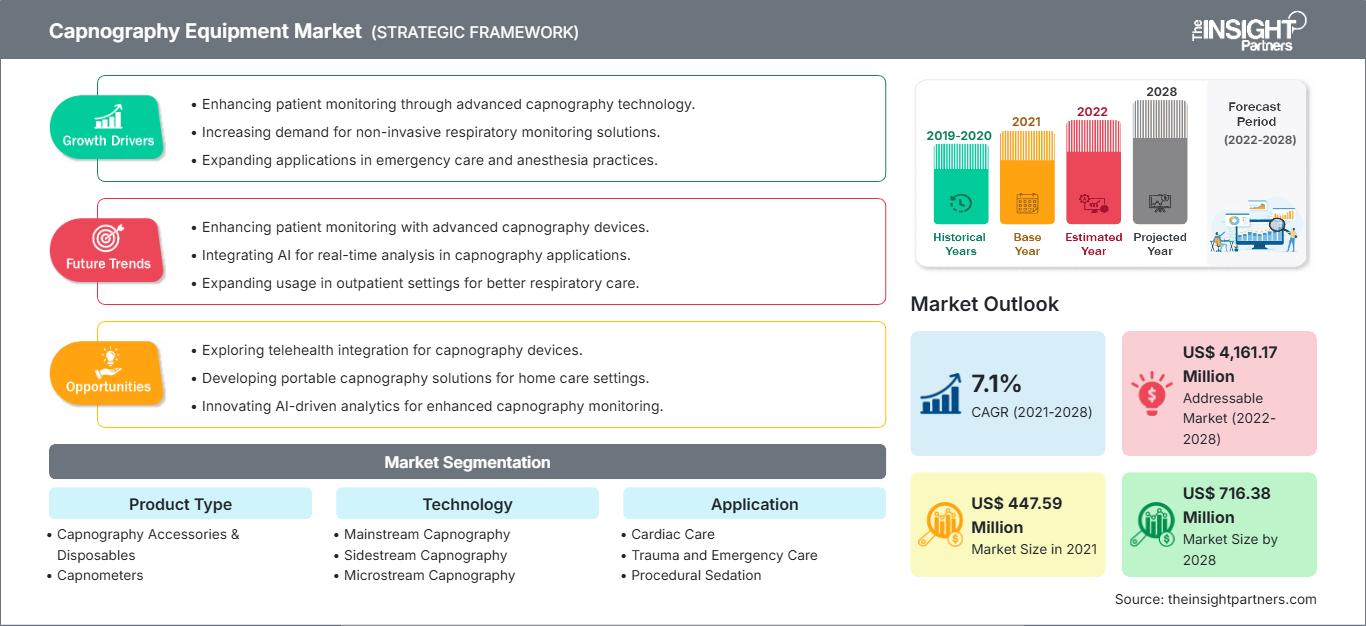
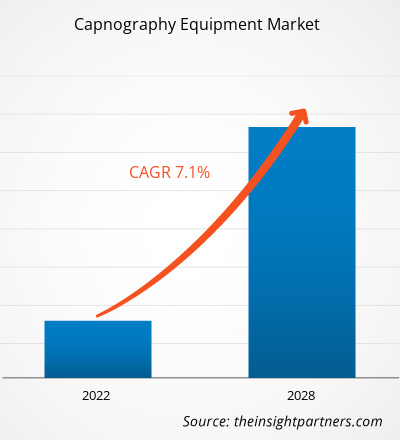
[研究报告]二氧化碳分析仪市场预计将从2021年的4.4759亿美元增长到2028年的7.1638亿美元;预计2022年至2028年的复合年增长率为7.1%。
市场增长归因于呼吸系统疾病的普遍存在以及二氧化碳分析仪设备相对于脉搏血氧仪的临床优势。
二氧化碳分析仪市场由众多主要竞争参与者组成,他们采取的策略包括产品发布、地域扩张和技术进步。以下列出了市场的一些最新发展:
- 2020年7月,伟伦公司(Hill Rom Holdings, Inc.)宣布推出“Connex生命体征监测仪”,这是一款配备直观触摸屏的新产品,适用于大多数低敏感度医疗环境和临床工作流程。该产品还可以使用 3 或 5 导联心电图监测来跟踪心脏活动,测量脉搏血氧仪、无创血压 (NIBP)、体温、呼气末二氧化碳 2 (EtCO2)、呼吸等等。
- 2021 年 12 月,百特国际公司宣布收购 Hill Rom Holdings Inc.。此次收购开启了下一阶段的转型,为患者、临床医生、员工、股东和其他社区在全球范围内的服务带来了新一轮潜在的驱动影响。
- 2021 年 7 月,OSI Systems Inc. 旗下部门 Spacelabs Healthcare 与 Masimo 合作,将 SET 脉搏血氧仪、NomoLine 二氧化碳图、rainbow SET 脉搏碳氧-血氧仪、SedLine 脑功能监测和 O3 区域血氧仪集成到选定的 Spacelabs 多参数监测仪中。
自定义此报告以满足您的要求
您将免费获得任何报告的定制,包括本报告的部分内容,或国家级分析、Excel 数据包,以及为初创企业和大学提供超值优惠和折扣
二氧化碳分析仪设备市场: 战略洞察
-
获取本报告的主要市场趋势。这个免费样本将包括数据分析,从市场趋势到估计和预测。
市场参与者积极参与产品创新和开发,以及产品审批的增加,推动了二氧化碳分析仪市场的增长。
2010年,国际心肺复苏和紧急心血管护理科学共识和美国心脏协会 (AHA) 修订了《成人和儿童高级生命支持指南》,其中纳入了危急事件中使用二氧化碳分析仪的建议。新指南支持在插管和心肺复苏期间常规使用定量波形二氧化碳分析仪。在美国,制造商需要大约3到7年的时间才能证明一种设备的医疗安全性。根据该国法律,即使先前批准的设备尺寸略有变化,修改后的产品也需要经过整个审批过程才能商业化。尽管如此,FDA 对简单二氧化碳分析仪设备的审批流程比复杂二氧化碳分析仪设备的审批流程要简单。复杂的二氧化碳分析仪设备需要符合 FDA 的各项要求,这成为其大规模获批的一大障碍。FDA 通常会评估所有医疗器械的安全性和有效性,并进行适当的评估以确定风险收益比。然而,在某些情况下,FDA 可能会要求制造商提供额外数据,具体取决于设备的复杂程度。现行 FDA 法规将二氧化碳分析仪设备归入传统制造的医疗产品类别以供审批。因此,法规的差异化和缺乏标准化阻碍了二氧化碳分析仪设备市场的增长。
区域概览
预计在预测期内,亚太地区二氧化碳分析仪设备市场的复合年增长率最高。对二氧化碳测量仪器的高需求、呼吸系统疾病患病率的上升以及主要市场参与者对研发的投入增加,都是推动亚太地区二氧化碳分析仪设备市场增长的因素。 《中国胸部疾病杂志》发表的研究数据显示,慢阻肺 (COPD) 日益成为公众关注的疾病,并位居致残原因之首。2018 年,中国 COPD 总体患病率为 8.2%,死亡率约为 1.6%。COPD 是农村地区第四大死亡原因,患病率为 4.4-16.7%。因此,COPD 患病率的上升推动了中国二氧化碳分析仪市场的增长。据 Statista 统计,2020 年中国医院的住院手术超过 6600 万例,不同地区之间差异很大。南部省份广东省的医疗机构当年进行了超过 800 万例手术,而西部省份青海省的手术不到 20 万例。中国外科手术数量的激增促进了亚太地区二氧化碳分析仪市场的增长。
在印度,由于呼吸系统疾病的日益流行,二氧化碳分析仪市场正在增长。例如,根据 DownToEarth 在 2018 年发表的一篇文章,全球至少十分之一的哮喘患者生活在印度,该国记录的哮喘患者人数约为 1.5-2 千万。印度成人哮喘、呼吸道症状和慢性支气管炎流行病学研究 (INSEARCH) 估计,全国哮喘患者人数为 1723 万人,总体患病率为 2.05%。最近的全球疾病负担估计,印度哮喘总负担为 3430 万人,占全球负担的 13.09%。该研究还指出,印度有 1.32 万人死于哮喘。总体而言,与全球哮喘负担比例相比,印度的死亡率高出三倍,残疾调整生命年 (DALY) 高出两倍多。环境条件变化导致哮喘的流行,这推动了印度二氧化碳分析仪设备市场的增长。
因此,预计在预测期内,老龄人口的增长、呼吸系统疾病的流行以及手术数量的增加将推动二氧化碳分析仪设备市场的发展。
技术洞察
基于技术,二氧化碳分析仪设备市场细分为主流二氧化碳分析仪、侧流二氧化碳分析仪和微流二氧化碳分析仪。2021 年,主流二氧化碳分析仪领域占据了最大的市场份额。在主流二氧化碳分析仪中,CO2 传感器位于气管插管和呼吸回路之间。它的特点是侵入式的,ETCO2 的测量是在气道或采样部位进行的。主流二氧化碳分析仪市场的增长主要归因于其易用性、对插管患者呼吸监测的准确性以及更短的响应时间。2021 年 4 月,Masimo 宣布 FDA 批准 Radius PCG 用于 Root 患者监测和连接平台。该产品无需任何常规校准。它提供精确的 ETCO2、呼吸频率测量,并在 15 秒内显示连续的 EtCO2 波形。
预计在预测期内,侧流二氧化碳分析仪细分市场将在二氧化碳分析仪设备市场中实现最高的复合年增长率。在侧流二氧化碳分析仪中,CO2 远离气道。传感器位于主机中,CO2 通过连接到位于气管插管和呼吸回路中的 T 型接头的采样管收集。侧流式二氧化碳分析仪由于其导管较细且比主流式二氧化碳分析仪更轻,因此对患者来说更舒适。此外,侧流技术能够提供关于肺泡排空不均匀和通气灌注不匹配的充分定量信息。Masimo 提供具有气体监测功能的侧流式二氧化碳分析仪解决方案。它适用于院前、院内转运、长期护理和家庭护理等护理领域的气体监测。
在二氧化碳分析仪设备市场运营的公司采用产品创新战略,以满足全球不断变化的客户需求,这也使他们能够在市场上保持自己的品牌声誉。
二氧化碳分析仪市场区域洞察
The Insight Partners 的分析师已详尽阐述了预测期内影响二氧化碳监测设备市场的区域趋势和因素。本节还探讨了北美、欧洲、亚太地区、中东和非洲以及南美和中美洲的二氧化碳监测设备市场细分和地域分布。
二氧化碳监测设备市场报告范围
| 报告属性 | 细节 |
|---|---|
| 市场规模 2021 | US$ 447.59 Million |
| 市场规模 2028 | US$ 716.38 Million |
| 全球复合年增长率 (2021 - 2028) | 7.1% |
| 历史数据 | 2019-2020 |
| 预测期 | 2022-2028 |
| 涵盖的领域 |
By 产品类型
|
| 覆盖地区和国家 |
北美
|
| 市场领导者和主要公司简介 |
|
二氧化碳监测设备市场参与者密度:了解其对业务动态的影响
二氧化碳监测设备市场正在快速增长,这得益于终端用户需求的不断增长,而这些需求的驱动因素包括消费者偏好的演变、技术进步以及对产品优势的认知度的提升。随着需求的增长,企业正在扩展其产品线,不断创新以满足消费者需求,并抓住新兴趋势,从而进一步推动市场增长。
- 获取 二氧化碳分析仪设备市场 主要参与者概述
二氧化碳分析仪市场 — 细分
二氧化碳分析仪市场根据产品类型、技术、应用、最终用户和地域进行分析。根据产品类型,市场细分为二氧化碳分析仪配件及一次性用品和二氧化碳测定仪。根据技术,市场细分为主流二氧化碳分析仪、侧流二氧化碳分析仪和微流二氧化碳分析仪。根据应用,二氧化碳分析仪设备市场细分为心脏护理、创伤和急救护理、程序镇静、呼吸监测和其他应用。根据最终用户,市场细分为医院、门诊手术中心、家庭护理机构和其他。根据地域划分,二氧化碳分析仪市场分为北美(美国、加拿大和墨西哥)、欧洲(英国、德国、法国、意大利、西班牙和欧洲其他地区)、亚太地区(中国、日本、印度、澳大利亚、韩国和亚太其他地区)、中东和非洲(阿联酋、沙特阿拉伯、非洲和中东和非洲其他地区)以及南美洲和中美洲(巴西、阿根廷和南美洲和中美洲其他地区)。
公司简介
- 美敦力
- 荷兰皇家飞利浦公司
- 通用电气公司
- Dragerwerk AG & Co. KGaA
- Nihon Kohden Corporation
- Hill Rom Holding Inc.(巴克斯特)
- Masimo
- SCHILLER Americas Inc.
- ICU MEDICAL Inc.
- BD

Mrinal 是一位经验丰富的研究分析师,在生命科学市场情报和咨询领域拥有超过 8 年的经验。凭借战略思维和对卓越的不懈追求,她在医药预测、市场机遇评估和行业基准制定方面积累了深厚的专业知识。她的工作致力于提供切实可行的洞察,帮助客户做出明智的战略决策。
Mrinal 的核心优势在于将复杂的定量数据集转化为有意义的商业智能。她敏锐的分析能力有助于制定市场进入 (GTM) 战略,并发掘制药和医疗器械行业的增长机会。作为一名值得信赖的顾问,她始终致力于简化工作流程并建立最佳实践,从而为客户推动创新并提高运营效率。
- 全面的市场规模与预测分析
- 详细的细分市场分析
- 深入的市场动态评估
- 区域及国家级洞察
- 竞争格局与企业对标分析
- 战略性商业情报
客户评价
Insight Partners 的 SCADA 系统市场报告内容全面,对当前趋势和未来预测提供了宝贵的见解。该团队始终高度专业、响应迅速且乐于助人。我们非常满意,强烈推荐他们的服务。
兰·凯德姆 伙伴, Reali Technologies LTD我请求一份关于特定软件市场的报告,团队在几天内就完成了。报告信息非常相关,而且呈现得非常出色。之后,我请求对报告进行一些修改和补充。团队再次迅速响应,不到一周我就收到了最终报告。
让-埃尔韦·詹恩 主席, 未来分析公司我们与 Insight Partners 合作进行了一项重要的市场研究和预测。他们清晰地洞察了机遇和风险,帮助我们制定了计划。他们的研究简单易用,数据可靠,帮助我们做出了明智而自信的决策。我们强烈推荐他们。
皮尤什·纳格帕尔 高级副总裁, 远光全球Insight Partners 凭借其深厚的行业专业知识,提供了富有洞察力、结构合理的市场研究。他们的团队始终专业且响应迅速。用户友好的网站让访问行业报告变得顺畅无阻。我们强烈推荐他们可靠、高质量的研究服务。
安达幸彦 首席执行官, 深蓝有限责任公司这是我第一次从The Insight Partners购买市场报告。起初我有些犹豫,但访问了他们的网站后,我更放心地冒险购买市场报告。我对报告的质量和客户服务非常满意。我对最初的报告有一些疑问和意见,但在与他们的分析师通过电子邮件沟通了几次后,我相信这份报告可以作为我们战略规划流程的参考。非常感谢您抽出宝贵的时间,让这次体验如此愉快。我一定会向其他人推荐你们的服务,当我们需要更多市场数据时,你们将是我的首选。
约翰·铃木 总裁兼首席执行官、董事会董事, BK科技感谢您在处理我关于尼日利亚传染病体外诊断市场信息请求的过程中所展现的支持和专业精神。感谢您的耐心、指导,以及您愿意提供的折扣,最终促成了这笔交易。我期待未来与 Insight Partners 继续合作,这一切都要归功于您与我初次接触后留下的良好印象。
奇吉奥克博士 ONYIA 董事总经理, PineCrest 医疗保健有限公司购买理由
- 明智的决策
- 了解市场动态
- 竞争分析
- 客户洞察
- 市场预测
- 风险规避
- 战略规划
- 投资论证
- 识别新兴市场
- 优化营销策略
- 提升运营效率
- 顺应监管趋势


