
dPCR 和 qPCR 市场分析及预测(按规模、份额、增长、趋势)2030
dPCR 和 qPCR 市场规模和预测(2020-2030 年)、全球和区域份额、趋势和增长机会分析报告范围:按治疗 [定量 PCR (qPCR) 和数字 PCR (dPCR)]、产品(试剂和耗材、仪器、软件和服务)、应用(研究应用、临床应用和法医应用)、最终用户(医院和诊断中心、制药和生物技术公司、研究实验室和学术机构、法医实验室和临床研究组织)和地理位置
- 状态 : 已发布
- 报告代码 : TIPHE100000817
- 类别 : 生命科学
- 页数 : 159
- 可用报告格式 :


- 最后更新日期 : September 03, 2024

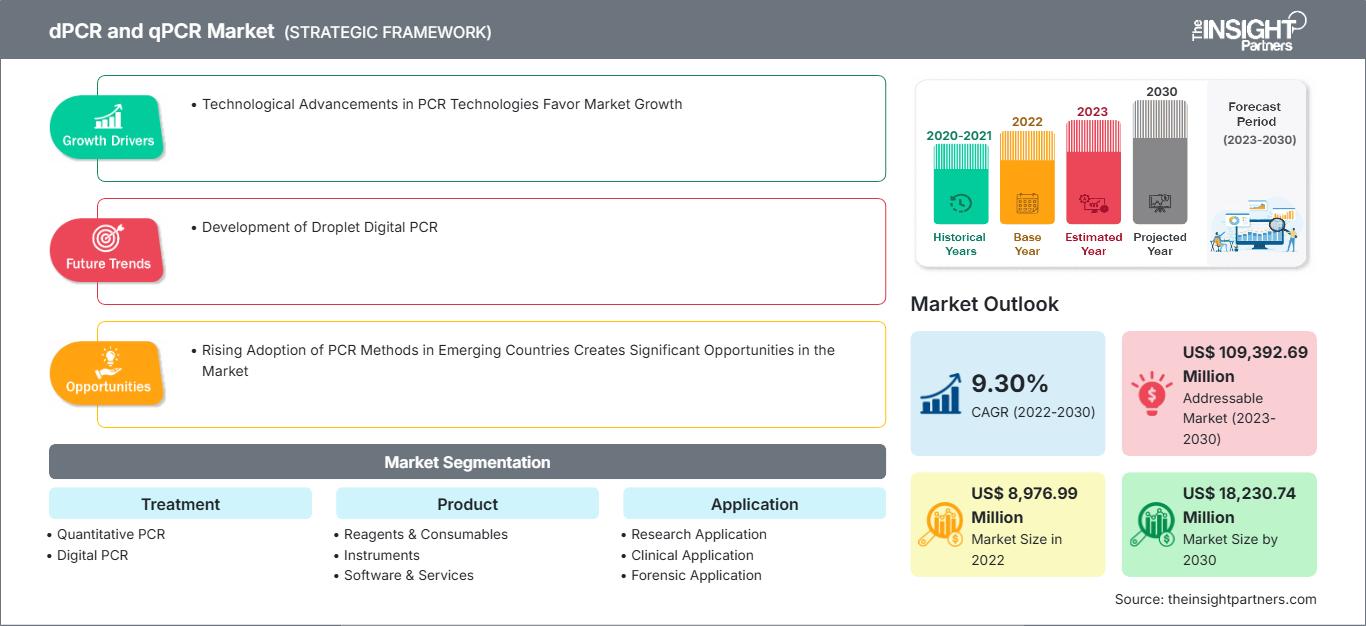
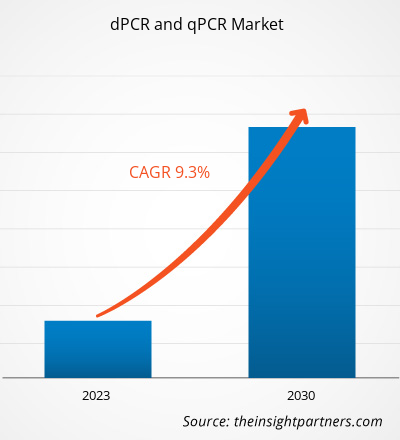
预计到2030年,dPCR和qPCR市场规模将从2022年的89.7699亿美元增至182.3074亿美元。预计该市场在2022年至2030年期间的复合年增长率为9.30%。液滴式数字PCR的发展可能仍将是市场的一个关键趋势。
dPCR和qPCR市场分析
分子生物学中的核酸定量由两项基本技术促进:定量PCR (qPCR)和数字PCR (dPCR)。随着PCR技术的持续创新,其准确性、效率和经济性不断提高,以及人工智能和机器学习的整合,以改进数据分析和解释,预计市场将继续增长。市场上的领先公司包括安捷伦科技公司 (Agilent Technologies Inc.)、凯杰公司 (QIAGEN NV)、罗氏诊断公司 (Roche Diagnostics)、赛默飞世尔科技公司 (Thermo Fisher Scientific Inc.) 和伯乐实验室公司 (Bio-Rad Laboratories, Inc.)。由于疾病患病率上升、技术进步和研发投入增加,预计 dPCR 和 qPCR 的需求将大幅增长。尽管存在成本高昂和技术限制等障碍,但市场仍提供了有利可图的发展和增长前景,尤其是在发展中国家。
dPCR 和 qPCR 市场概览
在重组 DNA 技术领域,包括重组蛋白合成和用于扩增和定量目标的 PCR 技术,基因合成是最广泛认可的工具。2021 年,Mercia 领投了 Camena Bioscience 的 1000 万美元 A 轮融资,这是一家为生物技术和制药行业提供基因的合成生物学初创公司。凭借这笔额外资金,该公司将继续发展壮大,并继续开发其革命性的 DNA 合成平台 gSynth。该技术平台及其他相关资源加速了该公司基因合成技术的研发。此外,企业也加大了研发投入,以改进基因合成技术。2020年,合成生物学初创公司EVONETIX LTD宣布完成B轮融资。该公司致力于开发一个用于高保真、快速且可扩展的基因合成桌面平台。在本轮融资中,该公司在新投资者Foresite Capital的指导下筹集了3000万美元(约合2300万英镑)。除了Rising Tide Fund和Civilization Ventures之外,参与此轮融资的其他投资者还包括Draper Esprit、DCVC(Data Collective)、晨兴集团、Providence Investment Company和剑桥咨询公司。由此可见,政府企业投资的不断增长,为全球基因合成市场的扩张提供了支持。
自定义此报告以满足您的要求
您将免费获得任何报告的定制,包括本报告的部分内容,或国家级分析、Excel 数据包,以及为初创企业和大学提供超值优惠和折扣
dPCR 和 qPCR 市场: 战略洞察
-
获取本报告的主要市场趋势。这个免费样本将包括数据分析,从市场趋势到估计和预测。
dPCR 和 qPCR 市场驱动因素和机遇
PCR 技术的进步有利于市场增长
在大多数分子生物学实验室中,聚合酶链式反应 (PCR) 是一种强大且几乎通用的技术,用于扩增特定的 DNA 片段,以进行基因分型、克隆和分析单核苷酸变异。它也是大多数下一代测序 (NGS) 制备的基础。技术进步正在产生不同类型的 PCR 技术。目前,人们正在研究 PCR 技术的几种非常规用途,这些用途将促进和加快分子诊断。具体而言,数字和实时 PCR 的改进可用于支持法医调查、识别病毒和细菌以及诊断疾病。
此外,研究人员正在尝试使用一些纳米材料来缩短测试时间。 2023年3月,韩国科学技术研究院(KIST,院长:尹硕镇)智能传感增强安全系统研究中心宣布开发超快速PCR技术。该技术由金相庆博士和郑承元博士领导的研究团队发布。超快速PCR利用光热纳米材料,与之前的检测方法相比,将检测时间缩短了一半。新方法只需五分钟即可完成,诊断性能与现有检测方法相当。因此,dPCR和qPCR市场的增长是由PCR技术的进步推动的。
新兴国家日益普及PCR方法,为市场创造了巨大的机遇
近年来,PCR等分子技术作为诊断工具不断发展。该技术被视为重要的研究和诊断工具,因为它使医疗专业人员能够准确诊断多种传染病。通过PCR,一条DNA链可以复制数百万个自身片段。它还可以实现疾病的早期诊断,这对于疾病控制至关重要。PCR 被广泛接受是因为其结果一致,可以在不同实验室之间进行比较。PCR 方法在发展中国家越来越受欢迎。根据世界卫生组织关于在发展中国家建立 PCR 实验室的报告(2016 年),世界卫生组织正在提供所需的技术援助,以在 11 个东南亚成员国中分别建立 PCR 实验室。这些实验室将支持提供一流的医疗服务。根据其需求,这些 PCR 实验室采用了各种 PCR 技术,包括数字 PCR (dPCR)、多重 PCR、实时 PCR、原位 PCR 和逆转录 PCR (RT-PCR)。由于其易于使用、速度快、在疾病筛查中具有高特异性,以及在临床微生物学、病毒学、寄生虫学、生物技术及相关领域的应用日益广泛,预计发展中国家的 dPCR 和 qPCR 市场将在未来几年内显着增长。
dPCR 和 qPCR 市场报告细分分析
有助于得出 dPCR 和 qPCR 市场分析的关键细分是治疗、产品、应用和最终用户。
- 根据治疗,dPCR 和 qPCR 市场细分为定量 PCR (qPCR) 和数字 PCR (dPCR)。数字 PCR (dPCR) 细分在 2022 年占据了最大的市场份额。
- 按产品,市场分为仪器、软件和服务以及试剂和耗材。试剂和耗材细分市场在 2022 年占据了最大的市场份额。
- 根据应用,dPCR 和 qPCR 市场细分为研究应用、临床应用和法医应用。临床应用细分市场在 2022 年占据了最大的市场份额。
- 按最终用户细分,市场细分为制药和生物技术公司、医院和诊断中心、法医实验室、研究实验室和学术机构以及临床研究组织。医院和诊断中心细分市场在 2022 年占据了相当大的市场份额。
按地区划分的 dPCR 和 qPCR 市场份额分析
dPCR 和 qPCR 市场报告的地理范围主要分为五个区域:北美、亚太地区、欧洲、中东和非洲以及南美和中美洲。
美国、加拿大和墨西哥构成了北美 dPCR 和 qPCR 市场细分。美国和加拿大在北美地区(该地区主要的生物技术市场)占据着最大的市场份额。关键市场参与者的存在、生物分析仪器制造商和PCR公司对创新产品需求的增长,以及众多学术和研究机构的广泛研发,都促进了北美市场的增长。医疗保健领域对先进技术的日益重视、公共和私营部门为推进精准医疗所做的努力,以及公共和私营部门对基因组研究的大量资助,预计都将刺激北美dPCR和qPCR市场的增长,并显著增加其收入。此外,美国的研究团队取得了与该地区的增长及其在全球市场中的主导地位相符的科学进步。
dPCR 和 qPCR 市场区域洞察
The Insight Partners 的分析师已详尽阐述了预测期内影响 dPCR 和 qPCR 市场的区域趋势和因素。本节还讨论了北美、欧洲、亚太地区、中东和非洲以及南美和中美洲的 dPCR 和 qPCR 市场细分和地域分布。
dPCR 和 qPCR 市场报告范围
| 报告属性 | 细节 |
|---|---|
| 市场规模 2022 | US$ 8,976.99 Million |
| 市场规模 2030 | US$ 18,230.74 Million |
| 全球复合年增长率 (2022 - 2030) | 9.30% |
| 历史数据 | 2020-2021 |
| 预测期 | 2023-2030 |
| 涵盖的领域 |
By 治疗
|
| 覆盖地区和国家 |
北美
|
| 市场领导者和主要公司简介 |
|
dPCR 和 qPCR 市场参与者密度:了解其对业务动态的影响
dPCR 和 qPCR 市场正在快速增长,这得益于终端用户需求的不断增长,而这些需求的驱动因素包括消费者偏好的演变、技术进步以及对产品优势的认知度的提升。随着需求的增长,企业正在扩展产品线,不断创新以满足消费者需求,并抓住新兴趋势,从而进一步推动市场增长。
- 获取 dPCR 和 qPCR 市场 主要参与者概述
dPCR 和 qPCR 市场新闻及最新发展
dPCR 和 qPCR 市场评估通过收集一手和二手研究后的定性和定量数据进行,这些数据包括重要的公司出版物、协会数据和数据库。dPCR 和 qPCR 市场的一些发展如下:
- QIAGEN NV 宣布扩展其数字 PCR (dPCR) 产品,以开发生物制药行业的细胞和基因疗法。该公司已与 Niba Labs 合作,为生物制药客户提供定制的数字 PCR 检测设计服务,并推出了新的 CGT 病毒载体裂解试剂盒,该试剂盒可实现从细胞裂解物到多种血清型病毒滴度绝对精确定量的标准化工作流程。(来源:QIAGEN NV,新闻稿,2023 年 7 月)
- 罗氏及其子公司 TIB Molbiol 开发了三种独特的 LightMix 模块化病毒试剂盒,以应对近期对猴痘病毒的担忧。过去两周内,欧洲多个国家和北美报告了多起猴痘病毒聚集性病例,而这些地区在该病毒并不常见。(来源:罗氏,新闻稿,2023 年 5 月)
dPCR 和 qPCR 市场报告覆盖范围和交付成果
“dPCR 和 qPCR 市场规模和预测(2020-2030 年)”报告提供了涵盖以下领域的市场详细分析:
- dPCR 和 qPCR 市场规模以及涵盖范围内所有关键细分市场的全球、区域和国家/地区预测
- dPCR 和 qPCR 市场趋势以及市场动态,例如驱动因素、限制因素和关键机遇
- 详细的 PEST/波特五力模型和 SWOT 分析
- dPCR 和 qPCR 市场分析涵盖关键市场趋势、全球和区域框架、主要参与者、法规和最新市场发展。
- 行业格局和竞争分析涵盖市场集中度、热图分析、知名参与者以及 dPCR 和 qPCR 市场的最新发展
- 详细的公司简介

Mrinal 是一位经验丰富的研究分析师,在生命科学市场情报和咨询领域拥有超过 8 年的经验。凭借战略思维和对卓越的不懈追求,她在医药预测、市场机遇评估和行业基准制定方面积累了深厚的专业知识。她的工作致力于提供切实可行的洞察,帮助客户做出明智的战略决策。
Mrinal 的核心优势在于将复杂的定量数据集转化为有意义的商业智能。她敏锐的分析能力有助于制定市场进入 (GTM) 战略,并发掘制药和医疗器械行业的增长机会。作为一名值得信赖的顾问,她始终致力于简化工作流程并建立最佳实践,从而为客户推动创新并提高运营效率。
- 全面的市场规模与预测分析
- 详细的细分市场分析
- 深入的市场动态评估
- 区域及国家级洞察
- 竞争格局与企业对标分析
- 战略性商业情报
客户评价
Insight Partners 的 SCADA 系统市场报告内容全面,对当前趋势和未来预测提供了宝贵的见解。该团队始终高度专业、响应迅速且乐于助人。我们非常满意,强烈推荐他们的服务。
兰·凯德姆 伙伴, Reali Technologies LTD我请求一份关于特定软件市场的报告,团队在几天内就完成了。报告信息非常相关,而且呈现得非常出色。之后,我请求对报告进行一些修改和补充。团队再次迅速响应,不到一周我就收到了最终报告。
让-埃尔韦·詹恩 主席, 未来分析公司我们与 Insight Partners 合作进行了一项重要的市场研究和预测。他们清晰地洞察了机遇和风险,帮助我们制定了计划。他们的研究简单易用,数据可靠,帮助我们做出了明智而自信的决策。我们强烈推荐他们。
皮尤什·纳格帕尔 高级副总裁, 远光全球Insight Partners 凭借其深厚的行业专业知识,提供了富有洞察力、结构合理的市场研究。他们的团队始终专业且响应迅速。用户友好的网站让访问行业报告变得顺畅无阻。我们强烈推荐他们可靠、高质量的研究服务。
安达幸彦 首席执行官, 深蓝有限责任公司这是我第一次从The Insight Partners购买市场报告。起初我有些犹豫,但访问了他们的网站后,我更放心地冒险购买市场报告。我对报告的质量和客户服务非常满意。我对最初的报告有一些疑问和意见,但在与他们的分析师通过电子邮件沟通了几次后,我相信这份报告可以作为我们战略规划流程的参考。非常感谢您抽出宝贵的时间,让这次体验如此愉快。我一定会向其他人推荐你们的服务,当我们需要更多市场数据时,你们将是我的首选。
约翰·铃木 总裁兼首席执行官、董事会董事, BK科技感谢您在处理我关于尼日利亚传染病体外诊断市场信息请求的过程中所展现的支持和专业精神。感谢您的耐心、指导,以及您愿意提供的折扣,最终促成了这笔交易。我期待未来与 Insight Partners 继续合作,这一切都要归功于您与我初次接触后留下的良好印象。
奇吉奥克博士 ONYIA 董事总经理, PineCrest 医疗保健有限公司购买理由
- 明智的决策
- 了解市场动态
- 竞争分析
- 客户洞察
- 市场预测
- 风险规避
- 战略规划
- 投资论证
- 识别新兴市场
- 优化营销策略
- 提升运营效率
- 顺应监管趋势


