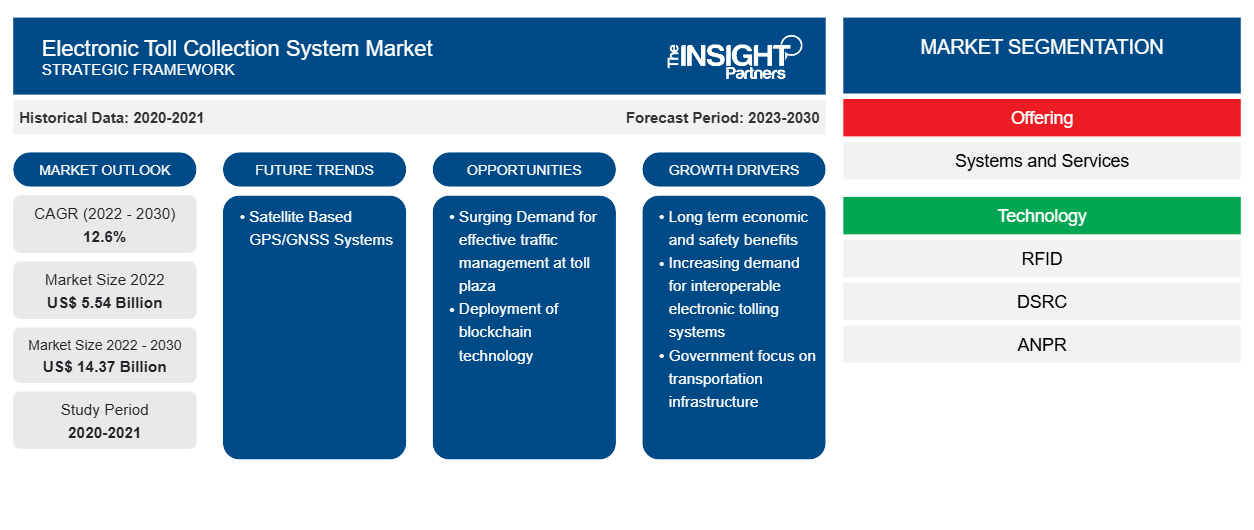
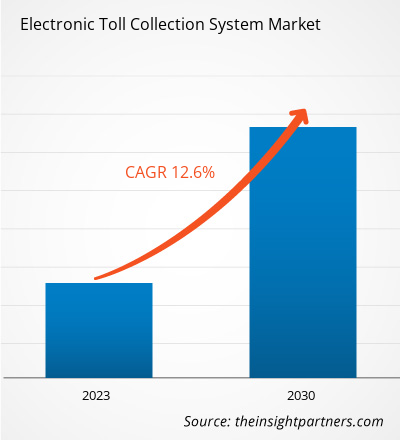
[研究报告] 2022 年电子收费系统市场规模价值 55.4191 亿美元,预计到 2030 年将达到 143.698 亿美元。预计 2022 年至 2030 年电子收费系统市场复合年增长率为 12.6%。
分析师观点:
随着时间的推移,收费系统的智能化和效率不断提高。除了消除道路上物理安装的需求外,智能收费系统还将数据视为一种资源,并利用它来提高无现金收费的安全性和效率。由于收费可用于资助高速公路建设和维护,因此收费是高速公路运营的重要组成部分。电子收费使用各种检测和支付技术,使收费更加有效和省时,在越来越多的情况下取代了人工收费。
电子收费系统市场概况:
事实证明,在公路、隧道或高速公路上收费是一种有效的解决方案,可用于收取费用和税款,为公私合作的基础设施项目创造收入或为州和政府机构收取维护费。收取的通行费随后用于各种公共服务,例如高速公路、隧道和桥梁的维护;为项目的未来扩建提供资金;以及管理拥堵。此外,最近注册车辆数量的激增与交通基础设施的增长相比出现了显著增长,这可能导致拥堵并产生对电子收费 (ETC) 系统的需求。拥堵的显著增加导致需要强大而高效的关口收费方法,这推动了对自动收费系统的需求。电子收费系统市场中的解决方案由一组硬件设备和软件程序组成,形成一个有凝聚力的单元,以促进自动收费过程。ETC 系统根据系统设计有效地识别、分类并随后从预付费用户账户中收集过境交易。此外,该系统还提供收费违规执法、车辆登记、后台支持、拥堵管理和智能交通相关服务等服务。
ETC 系统除了提供无缝收费流程外,还具有多种优势,例如拥堵管理、最大限度地减少收费站的交通量、减少高速公路上的车辆交通量以及提供可操作的交通模式见解。这些优势提高了该系统在发达国家的普及度,并刺激了新兴经济体对该系统的需求。此外,预计长期的经济和安全效益将在预测期内推动市场发展。先进技术的集成以及随后 ETC 系统服务应用范围的改进预计将对未来几年的市场增长产生深远影响。
电子收费系统市场的解决方案可以通过辅助交通来减少事故发生的可能性。该系统可帮助车载设备自动支付通行费并提高运营效率,从而提升客户体验,并为过渡到新的互操作性标准提供灵活性。快速的城市化,加上智能交通系统的采用率上升,将在预测期内为电子收费系统市场带来可观的推动力。
定制此报告以满足您的需求
您可以免费定制任何报告,包括本报告的部分内容、国家级分析、Excel 数据包,以及为初创企业和大学提供优惠和折扣
电子收费系统市场:
- 获取此报告的关键市场趋势。这个免费样品将包括数据分析,从市场趋势到估计和预测。
电子收费系统市场驱动因素:
政府重点关注交通基础设施推动电子收费系统市场增长
根据 Worldometer 的数据,世界人口每年以大约 0.88% 的速度增长。全球人口的增长促使政府机构投资建设高效的基础设施,以应对不断增长的人口并维持经济增长。对重建老化基础设施的日益关注和智能解决方案的纳入是推动该地区电子收费系统市场采用解决方案的关键因素。例如,2023 年 6 月,欧盟委员会选择了 107 个交通基础设施项目,从连接欧洲基金 (CEF) 获得超过 63 亿美元的欧盟补贴。此外,德国政府打算增加道路容量,以适应预期的货运增长。据 Informare 称,截至 2023 年 2 月,德国的公路货运量预计到 2051 年将增长 34%,德国联邦政府计划修建新道路以适应这种交通量的增加,交通部长表示。
2021 年 11 月,国会通过了《两党基础设施协议》。根据该协议,政府将投资修复和重建美国的道路和桥梁,重点关注气候变化缓解、恢复力、公平性以及所有用户的安全。此外,政府还将在未来五年内投资 1100 亿美元改造该国的不良道路和高速公路。此外,根据美国总统和加拿大总理的联合声明,2023 年 3 月,在加拿大关键矿产基础设施基金下,将投资约 10.9 亿美元(15 亿加元)用于支持清洁能源和交通基础设施项目。根据 2022 年 9 月的白宫情况说明书,美国总统和墨西哥总统于 2021 年重启了美墨高层经济对话 (HLED),以推进共同的战略经济和商业优先事项。HLED 为美国和墨西哥提供了一个平台,利用两国牢固的经济联系来促进对墨西哥交通基础设施建设的投资。
因此,政府对交通基础设施的关注促进了道路建设、高效采用数字化解决方案以及重建老化的基础设施。这导致全球电子收费系统市场越来越多地采用该解决方案,因为它有助于降低收入流失的风险、降低运营成本并通过减少交通拥堵来增强收费系统。
电子收费系统市场细分分析:
根据产品,电子收费系统市场细分为系统和服务。系统部分占电子收费系统市场的最大份额。电子收费系统市场的解决方案包括安装在高速公路、桥梁、隧道、车载车辆和收费关口等不同基础设施上的硬件和软件。硬件设备包括车道硬件和收费站硬件。车道硬件主要包括路侧天线单元、高速电子屏障、收费车道控制器、ETC 车道信号灯、车道交通灯、收费多功能显示器、车道监控摄像头、车辆检测器、交换机、计算机网络等。收费站硬件主要包括交换机、工作站和 ETC 收费服务器。ETC 系统通常由转发器、天线单元、信号接收器、收费服务器、光学传感器、道路传感器、高架摄像机、路侧通信单元和标签阅读器等硬件设备组成。硬件设备的两个方面(一个安装在收费站,另一个安装在车辆上)需要协同工作,以使 ETC 系统有效运行。这些设备负责收集输入数据点,供软件和算法处理,以分离相关数据和不相关数据,然后进行与收费相关的识别和交易。
根据收集到的数据,系统可以根据系统设计采取必要的执法行动或向相关部门发出警报。此外,解决方案提供商还确保在当地便利店提供车载标签、注册新用户账户以及提供相关后台支持,以确保 ETC 系统无误运行。该软件有助于数据采集和数据通信。它还有助于提高收费系统的运营效率。
电子收费系统市场区域分析:
2022 年,北美电子收费系统市场规模价值 19.5636 亿美元,预计到 2030 年将达到 54.1754 亿美元;预计 2022 年至 2030 年的复合年增长率为 13.6%。北美电子收费系统市场分为美国、加拿大和墨西哥。据 Assemblyman 称,2019 年 2 月,美国领先的基于 ETC 的系统 E-ZPass 拥有超过 3500 万个信号转发器,管理着 17 个州的 2100 万个电子收费账户。此外,该系统的愿景是成为卓越的收费计划,是世界上最大的 ETC 系统互操作网络。它为合作机构创造了约 90 亿美元的收入。可扩展性、新车注册和现有 ETC 系统维护等因素预计将成为预测期内美国电子收费市场的主要驱动力。此外,使用分析报告和收集有关交通模式的可行见解以实现有效的拥堵管理和交通监控,预计将为创新服务提供空间,这些服务可以通过电子收费系统市场中的解决方案进行集成,从而为市场参与者提供有利可图的商机——此外,越来越多的智慧城市计划正在美国得到广泛采用。例如,2021 年,俄克拉荷马州收费公路管理局的 Pikepass 成为美国电子收费系统市场中的第一个解决方案。该系统可以以电子方式从已注册车主的账户中扣除费用,而无需停车,从而降低收费站附近的拥堵程度。
电子收费系统市场关键参与者分析:
Conduent Business Services, LLC.、EFKON GmbH、Kapsch TrafficCom AG、Thales、TOSHIBA CORPORATION、TransCore、FAAC SpA、MITSUBISHI HEAVY INDUSTRIES, LTD.、SICE 和 P Square Solutions 是电子收费系统市场的主要参与者。
电子收费
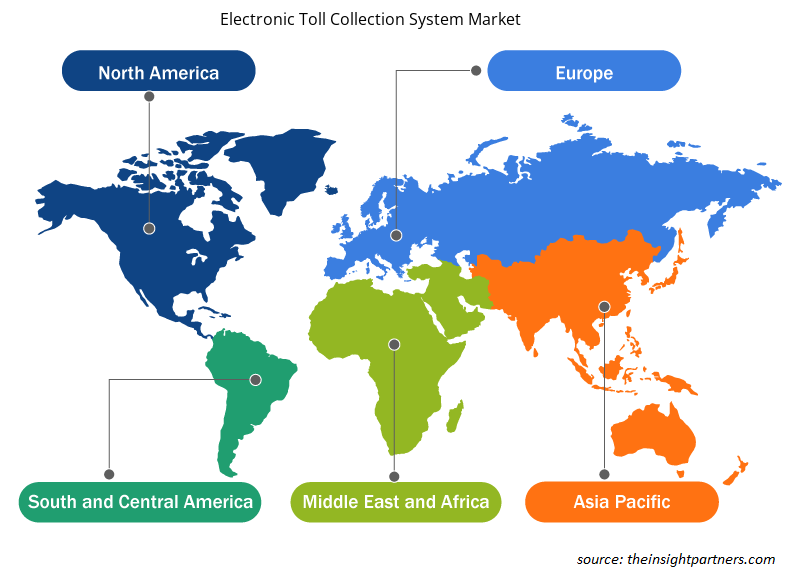
电子收费系统市场区域洞察
Insight Partners 的分析师已详尽解释了预测期内影响电子收费系统市场的区域趋势和因素。本节还讨论了北美、欧洲、亚太地区、中东和非洲以及南美和中美洲的电子收费系统市场细分和地理位置。
- 获取电子收费系统市场的区域具体数据
电子收费系统市场报告范围
| 报告属性 | 细节 |
|---|---|
| 2022 年市场规模 | 55.4 亿美元 |
| 2030 年市场规模 | 143.7亿美元 |
| 全球复合年增长率(2022 - 2030 年) | 12.6% |
| 史料 | 2020-2021 |
| 预测期 | 2023-2030 |
| 涵盖的领域 | 通过奉献
|
| 覆盖地区和国家 | 北美
|
| 市场领导者和主要公司简介 |
|
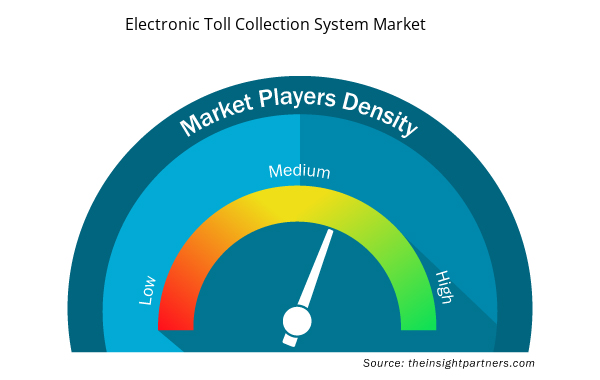
电子收费系统市场参与者密度:了解其对业务动态的影响
电子收费系统市场正在快速增长,这得益于终端用户需求的不断增长,这些需求源于消费者偏好的不断变化、技术进步以及对产品优势的认识不断提高等因素。随着需求的增加,企业正在扩大其产品范围,进行创新以满足消费者的需求,并利用新兴趋势,从而进一步推动市场增长。
市场参与者密度是指在特定市场或行业内运营的企业或公司的分布情况。它表明在给定市场空间中,相对于其规模或总市场价值,有多少竞争对手(市场参与者)存在。
在电子收费系统市场运营的主要公司有:
- Conduent公司
- 卡普施交通通讯公司
- 泰雷兹公司
- 东芝基础设施系统和解决方案公司
- TransCore LP,Magnetic Autocontrol GmbH
免责声明:上面列出的公司没有按照任何特定顺序排列。
- 了解电子收费系统市场主要参与者概况
最新动态:
电子收费系统市场中的公司大量采用并购等无机和有机策略。以下列出了电子收费系统市场的一些近期关键发展:
- 2023 年 4 月,Kapsch 推出了自动车牌识别 (ANPR) 软件更新。此更新可根据应用程序自动识别车牌是否为车牌。
- 2022 年 2 月,危地马拉高速公路运营商 SiVA 宣布在该国重要的 Palin-Escuintla 收费公路走廊沿线部署泰雷兹的 Peage Intelligent Transport Zero (PITZ) 电子收费系统。
- 历史分析(2 年)、基准年、预测(7 年)及复合年增长率
- PEST 和 SWOT 分析
- 市场规模价值/数量 - 全球、区域、国家
- 行业和竞争格局
- Excel 数据集

Report Coverage
Revenue forecast, Company Analysis, Industry landscape, Growth factors, and Trends

Segment Covered
This text is related
to segments covered.

Regional Scope
North America, Europe, Asia Pacific, Middle East & Africa, South & Central America

Country Scope
This text is related
to country scope.
常见问题
The electronic toll collection market is expected to reach US$ 14369.80 million by 2030.
North America is anticipated to grow with the highest CAGR over the forecast period.
The systems segment led the electronic toll collection market with a significant share in 2022 and it is also expected to grow with the highest CAGR.
Satellite-based GPS/GNSS systems is expected to drive the growth of the electronic toll collection market in the coming years.
The electronic toll collection market was estimated to be valued at US$ 5541.91 million in 2022 and is projected to reach US$ 14369.80 million by 2030; it is expected to grow at a CAGR of 12.6% during the forecast period.
Long-term economic and safety benefits, and increasing demand for interoperable electronic tolling systems, are driving factors of electronic toll collection market.
The key players holding majority shares in the electronic toll collection market include Kapsch TrafficCom AG, Mitsubishi Heavy Industries, LTD., Conduent Business Services, LLC., and TransCore.
Trends and growth analysis reports related to Electronics and Semiconductor : READ MORE..
The List of Companies - Electronic Toll Collection Market
- Conduent Inc
- Kapsch TrafficCom AG
- Thales SA
- Toshiba Infrastructure Systems and Solutions Corp
- TransCore LP, Magnetic Autocontrol GmbH
- The Revenue Markets Inc
- Sociedad Iberica de Construcciones Electricas SA
- P Square Solutions LLC
- Verra Mobility Corp
- Mitsubishi Heavy Industries Ltd.
- Cubic Transportation Systems, Inc.
- Q-Free ASA.
The Insight Partners performs research in 4 major stages: Data Collection & Secondary Research, Primary Research, Data Analysis and Data Triangulation & Final Review.
- Data Collection and Secondary Research:
As a market research and consulting firm operating from a decade, we have published and advised several client across the globe. First step for any study will start with an assessment of currently available data and insights from existing reports. Further, historical and current market information is collected from Investor Presentations, Annual Reports, SEC Filings, etc., and other information related to company’s performance and market positioning are gathered from Paid Databases (Factiva, Hoovers, and Reuters) and various other publications available in public domain.
Several associations trade associates, technical forums, institutes, societies and organization are accessed to gain technical as well as market related insights through their publications such as research papers, blogs and press releases related to the studies are referred to get cues about the market. Further, white papers, journals, magazines, and other news articles published in last 3 years are scrutinized and analyzed to understand the current market trends.
- Primary Research:
The primarily interview analysis comprise of data obtained from industry participants interview and answers to survey questions gathered by in-house primary team.
For primary research, interviews are conducted with industry experts/CEOs/Marketing Managers/VPs/Subject Matter Experts from both demand and supply side to get a 360-degree view of the market. The primary team conducts several interviews based on the complexity of the markets to understand the various market trends and dynamics which makes research more credible and precise.
A typical research interview fulfils the following functions:
- Provides first-hand information on the market size, market trends, growth trends, competitive landscape, and outlook
- Validates and strengthens in-house secondary research findings
- Develops the analysis team’s expertise and market understanding
Primary research involves email interactions and telephone interviews for each market, category, segment, and sub-segment across geographies. The participants who typically take part in such a process include, but are not limited to:
- Industry participants: VPs, business development managers, market intelligence managers and national sales managers
- Outside experts: Valuation experts, research analysts and key opinion leaders specializing in the electronics and semiconductor industry.
Below is the breakup of our primary respondents by company, designation, and region:

Once we receive the confirmation from primary research sources or primary respondents, we finalize the base year market estimation and forecast the data as per the macroeconomic and microeconomic factors assessed during data collection.
- Data Analysis:
Once data is validated through both secondary as well as primary respondents, we finalize the market estimations by hypothesis formulation and factor analysis at regional and country level.
- Macro-Economic Factor Analysis:
We analyse macroeconomic indicators such the gross domestic product (GDP), increase in the demand for goods and services across industries, technological advancement, regional economic growth, governmental policies, the influence of COVID-19, PEST analysis, and other aspects. This analysis aids in setting benchmarks for various nations/regions and approximating market splits. Additionally, the general trend of the aforementioned components aid in determining the market's development possibilities.
- Country Level Data:
Various factors that are especially aligned to the country are taken into account to determine the market size for a certain area and country, including the presence of vendors, such as headquarters and offices, the country's GDP, demand patterns, and industry growth. To comprehend the market dynamics for the nation, a number of growth variables, inhibitors, application areas, and current market trends are researched. The aforementioned elements aid in determining the country's overall market's growth potential.
- Company Profile:
The “Table of Contents” is formulated by listing and analyzing more than 25 - 30 companies operating in the market ecosystem across geographies. However, we profile only 10 companies as a standard practice in our syndicate reports. These 10 companies comprise leading, emerging, and regional players. Nonetheless, our analysis is not restricted to the 10 listed companies, we also analyze other companies present in the market to develop a holistic view and understand the prevailing trends. The “Company Profiles” section in the report covers key facts, business description, products & services, financial information, SWOT analysis, and key developments. The financial information presented is extracted from the annual reports and official documents of the publicly listed companies. Upon collecting the information for the sections of respective companies, we verify them via various primary sources and then compile the data in respective company profiles. The company level information helps us in deriving the base number as well as in forecasting the market size.
- Developing Base Number:
Aggregation of sales statistics (2020-2022) and macro-economic factor, and other secondary and primary research insights are utilized to arrive at base number and related market shares for 2022. The data gaps are identified in this step and relevant market data is analyzed, collected from paid primary interviews or databases. On finalizing the base year market size, forecasts are developed on the basis of macro-economic, industry and market growth factors and company level analysis.
- Data Triangulation and Final Review:
The market findings and base year market size calculations are validated from supply as well as demand side. Demand side validations are based on macro-economic factor analysis and benchmarks for respective regions and countries. In case of supply side validations, revenues of major companies are estimated (in case not available) based on industry benchmark, approximate number of employees, product portfolio, and primary interviews revenues are gathered. Further revenue from target product/service segment is assessed to avoid overshooting of market statistics. In case of heavy deviations between supply and demand side values, all thes steps are repeated to achieve synchronization.
We follow an iterative model, wherein we share our research findings with Subject Matter Experts (SME’s) and Key Opinion Leaders (KOLs) until consensus view of the market is not formulated – this model negates any drastic deviation in the opinions of experts. Only validated and universally acceptable research findings are quoted in our reports.
We have important check points that we use to validate our research findings – which we call – data triangulation, where we validate the information, we generate from secondary sources with primary interviews and then we re-validate with our internal data bases and Subject matter experts. This comprehensive model enables us to deliver high quality, reliable data in shortest possible time.
 获取此报告的免费样本