
灌溉自动化市场需求、趋势及2034年预测
灌溉自动化市场规模及预测(2021-2034)、全球及区域份额、趋势和增长机会分析报告涵盖范围:按自动化类型(基于时间的系统、基于量的系统、实时反馈系统和计算机控制灌溉系统);灌溉类型(滴灌、喷灌和地面灌溉);组件(控制器、传感器、阀门、喷头及其他);系统(全自动和半自动);最终用户(农业和非农业);以及地理位置。
- 状态 : 数据发布
- 报告代码 : TIPRE00011988
- 类别 : 电子和半导体
- 页数 : 150
- 可用报告格式 :


- 最后更新日期 : April 09, 2026

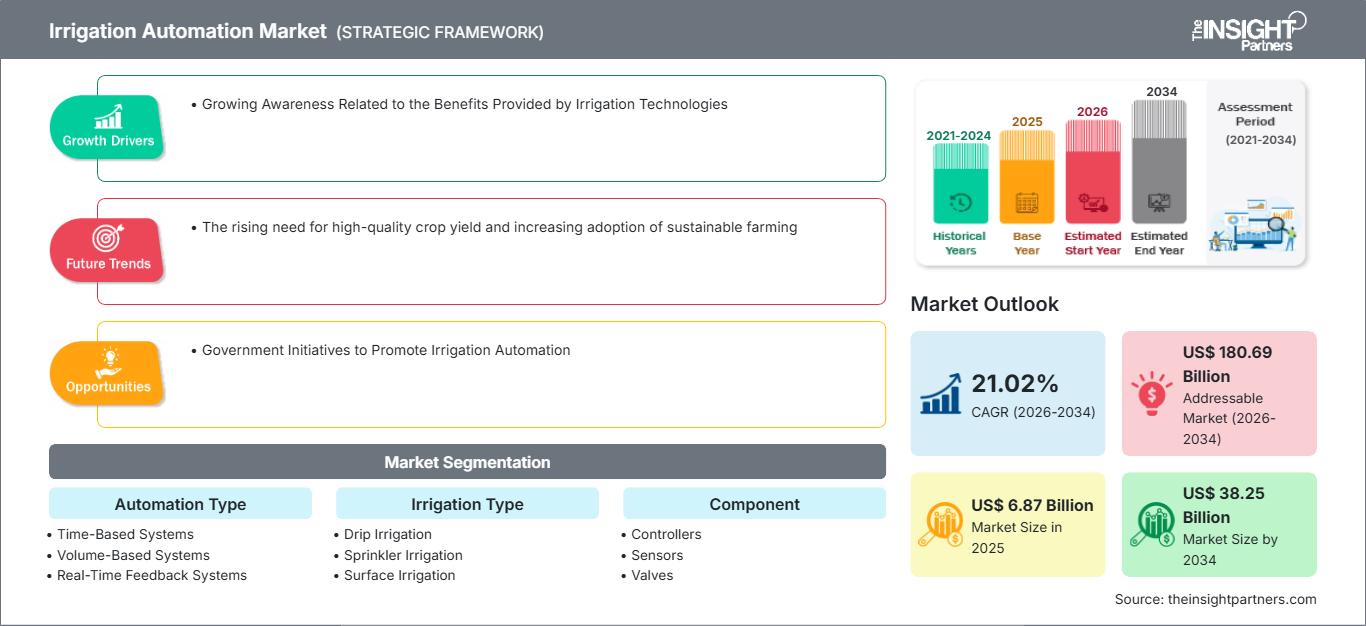
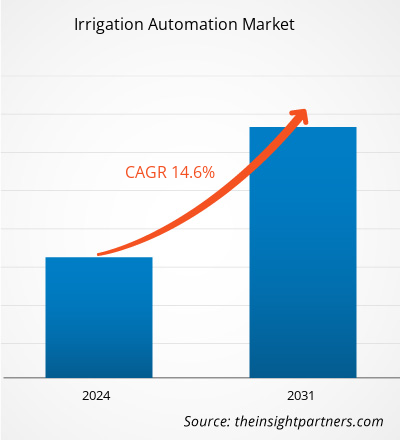
预计到2034年,灌溉自动化市场规模将从2025年的68.7亿美元增长至382.5亿美元。预计在2026年至2034年的预测期内,该市场将以21.02%的复合年增长率增长。
灌溉自动化市场分析
由于人们对灌溉技术益处的认识不断提高,以及对精准农业仪器和技术的接受度不断提高,灌溉自动化市场正以惊人的速度增长。在对智能农业技术日益增长的需求推动下,该市场正稳步扩张。此外,技术进步和政府推广灌溉自动化的举措也为市场增长提供了巨大的机遇。
灌溉自动化市场概览
灌溉自动化利用各种仪器或设备来操作不同的灌溉系统,并改变水流方向。灌溉自动化包含多种硬件的组合,例如传感器、阀门、控制器、喷头等,以构建用于农业和非农业应用的自动化系统。灌溉自动化带来的显著优势,例如节省时间、降低成本、优化资源利用等,正在推动市场发展。
市场调研亮点
- 2025年全球灌溉自动化市场价值将达到68.7亿美元
- 预计到2034年,年市场规模将达到382.5亿美元。
- 预计2026年至2034年期间,总潜在市场规模(TAM)将达到约1806.9亿美元。
- 预计市场在预测期内将实现 21.02% 的复合年增长率。
- 美国是一个关键市场,这得益于人们对灌溉技术益处的认识不断提高,以及不断变化的行业动态。
- 市场分析涵盖北美、欧洲、亚太地区、南美和中美洲、中东和非洲,并对预测期内的增长情况进行评估。
- 政府推动灌溉自动化等市场机遇预计将影响市场动态和目标市场。
- 报告对行业参与者进行了概况介绍,包括 Galcon Ltd.、Hunter Industries Inc.、Irritec SpA、Jain Irrigation Systems Ltd.、Lindsay Corporation、Nelson Irrigation Corporation、Rubicon Water、The Toro Company、Valmont Industries, Inc. 和 WaterBit, Inc.,同时分析了竞争策略和创新发展。
根据您的需求定制此报告
获取免费定制服务灌溉自动化市场:战略洞察
-
获取本报告的主要市场趋势。这份免费样品将包含数据分析,内容涵盖市场趋势、估算和预测等。
灌溉自动化市场驱动因素和机遇
人们对灌溉技术带来的益处的认识不断提高,正在推动市场发展。
由于劳动力和电力成本高昂,农民们越来越意识到自动化灌溉技术的重要性。灌溉技术为用户带来诸多益处,例如节水、流程自动化和成本节约等,这些优势正在推动市场发展。这些益处提高了农民的认知度,从而促进了灌溉技术的普及应用。这些技术帮助农民减少日常用电量,并降低灌溉所需的时间和精力。此外,自动化灌溉还减少了农民的往返农田次数,从而降低了劳动力成本。自动化灌溉系统的安装能够精确控制灌溉水量和灌溉时间,从而提高农业生产的精准度。这种精准性有助于减少作物损失,并提高整体生产力。
政府推动灌溉自动化举措——灌溉自动化市场机遇
大多数欠发达国家的农民仍然采用传统的灌溉系统(地面灌溉),这非常耗时。因此,各国政府纷纷采取有利措施,推广灌溉自动化,预计这将为市场创造机遇。许多发展中国家,例如印度、中国、巴西、美国、法国和其他非洲国家,都提供补贴,用于购买滴灌和喷灌系统,以提高灌溉效率。此外,鼓励使用喷灌和滴灌系统的严格政策,也促使农民在其农场采用先进的技术系统,例如购置和改造农用灌溉设备(喷灌和滴灌系统)。这些因素将在预测期内为市场带来显著的增长机遇。
灌溉自动化市场报告细分分析
促成灌溉自动化市场分析的关键细分市场包括自动化类型、灌溉类型、组件、系统和最终用户。
- 根据自动化类型,市场可分为基于时间的系统、基于量的系统、实时反馈系统和计算机控制灌溉系统。2023年,基于时间的系统占据了更大的市场份额。
- 根据灌溉方式,市场可分为滴灌、喷灌和地面灌溉。2023年,滴灌占据了更大的市场份额。
- 从组件角度来看,市场可细分为控制器、传感器、阀门、喷淋器和其他组件。2023年,控制器细分市场占据了更大的市场份额。
- 根据系统类型,灌溉自动化市场可分为全自动和半自动两大类。2023年,全自动灌溉系统占据了更大的市场份额。
- 从最终用途来看,市场可分为农业和非农业两大类。2023年,农业领域占据了更大的市场份额。
按地域划分的灌溉自动化市场份额分析
灌溉自动化市场报告的地理范围主要分为五个区域:北美、亚太、欧洲、中东和非洲以及南美/中南美洲。
就收入而言,亚太地区占据了灌溉自动化市场最大的份额,这主要得益于该地区广袤的农业用地和政府的大力支持。预计在不久的将来,该市场将继续扩张,这主要归因于气候条件的快速变化以及减少浪费需求的日益增长。此外,技术进步和先进灌溉系统的开发也将在预测期内推动市场发展。
灌溉自动化市场报告范围
| 报告属性 | 细节 |
|---|---|
| 2025年市场规模 | 68.7亿美元 |
| 到2034年市场规模 | 382.5亿美元 |
| 全球复合年增长率(2026-2034 年) | 21.02% |
| 史料 | 2021-2024 |
| 预测期 | 2026-2034 |
| 涵盖部分 |
按自动化类型
|
| 覆盖地区和国家 |
北美
|
| 市场领导者和主要公司简介 |
|
灌溉自动化市场参与者密度:了解其对业务动态的影响
灌溉自动化市场正快速增长,这主要得益于终端用户需求的不断增长,而终端用户需求的增长又源于消费者偏好的转变、技术的进步以及对产品优势认知的提高。随着需求的增长,企业不断拓展产品和服务,持续创新以满足消费者需求,并把握新兴趋势,这些都进一步推动了市场增长。
灌溉自动化市场新闻及最新发展
灌溉自动化市场评估是通过收集定性和定量数据,并结合一手和二手研究成果进行的,这些研究包括重要的企业出版物、协会数据和数据库。以下列出了灌溉自动化市场的发展动态和策略:
- 2024年3月,Rubicon Water公司分享了其在乌兹别克斯坦-塔吉克斯坦边境的最新项目。该项目由瑞士合作办公室和蓝色和平倡议组织支持,专注于跨境水资源分配和计量,旨在促进跨境水资源管理方面的合作。除了改善灌溉用水管理外,Rubicon的技术在地下水管理、补给计划和生态流量项目中也发挥着日益重要的作用,有助于保护重要的水资源和生态系统。(来源:Rubicon Water公司,新闻稿,2024年)
灌溉自动化市场报告涵盖范围和成果
《灌溉自动化市场规模及预测(2021-2031)》报告对以下领域进行了详细的市场分析:
- 本报告涵盖了全球、区域和国家层面的所有关键市场细分领域的市场规模和预测。
- 市场动态,例如驱动因素、制约因素和关键机遇
- 未来主要趋势
- 详细的PEST/波特五力模型和SWOT分析
- 全球及区域市场分析,涵盖关键市场趋势、主要参与者、法规及近期市场发展动态。
- 行业格局和竞争分析,包括市场集中度、热力图分析、主要参与者和最新发展动态
- 公司详细概况

Naveen 是一位经验丰富的市场研究和咨询专业人士,在定制项目、联合项目和咨询项目方面拥有超过 9 年的专业经验。他目前担任副总裁,成功管理了项目价值链中的利益相关者,撰写了 100 多份研究报告和 30 多项咨询项目。他的工作涵盖工业和政府项目,为客户的成功和数据驱动的决策做出了重要贡献。
Naveen 拥有卡纳塔克邦 VTU 的电子与通信工程学位,以及马尼帕尔大学的市场营销与运营 MBA 学位。他已担任 IEEE 会员 9 年,积极参与各种会议、技术研讨会,并在分部和地区层面担任志愿者。在此之前,他曾担任 IndustryARC 的助理战略顾问和惠普(惠普全球)的工业服务器顾问。
- 全面的市场规模与预测分析
- 详细的细分市场分析
- 深入的市场动态评估
- 区域及国家级洞察
- 竞争格局与企业对标分析
- 战略性商业情报
客户评价
Insight Partners 的 SCADA 系统市场报告内容全面,对当前趋势和未来预测提供了宝贵的见解。该团队始终高度专业、响应迅速且乐于助人。我们非常满意,强烈推荐他们的服务。
兰·凯德姆 伙伴, Reali Technologies LTD我请求一份关于特定软件市场的报告,团队在几天内就完成了。报告信息非常相关,而且呈现得非常出色。之后,我请求对报告进行一些修改和补充。团队再次迅速响应,不到一周我就收到了最终报告。
让-埃尔韦·詹恩 主席, 未来分析公司我们与 Insight Partners 合作进行了一项重要的市场研究和预测。他们清晰地洞察了机遇和风险,帮助我们制定了计划。他们的研究简单易用,数据可靠,帮助我们做出了明智而自信的决策。我们强烈推荐他们。
皮尤什·纳格帕尔 高级副总裁, 远光全球Insight Partners 凭借其深厚的行业专业知识,提供了富有洞察力、结构合理的市场研究。他们的团队始终专业且响应迅速。用户友好的网站让访问行业报告变得顺畅无阻。我们强烈推荐他们可靠、高质量的研究服务。
安达幸彦 首席执行官, 深蓝有限责任公司这是我第一次从The Insight Partners购买市场报告。起初我有些犹豫,但访问了他们的网站后,我更放心地冒险购买市场报告。我对报告的质量和客户服务非常满意。我对最初的报告有一些疑问和意见,但在与他们的分析师通过电子邮件沟通了几次后,我相信这份报告可以作为我们战略规划流程的参考。非常感谢您抽出宝贵的时间,让这次体验如此愉快。我一定会向其他人推荐你们的服务,当我们需要更多市场数据时,你们将是我的首选。
约翰·铃木 总裁兼首席执行官、董事会董事, BK科技感谢您在处理我关于尼日利亚传染病体外诊断市场信息请求的过程中所展现的支持和专业精神。感谢您的耐心、指导,以及您愿意提供的折扣,最终促成了这笔交易。我期待未来与 Insight Partners 继续合作,这一切都要归功于您与我初次接触后留下的良好印象。
奇吉奥克博士 ONYIA 董事总经理, PineCrest 医疗保健有限公司购买理由
- 明智的决策
- 了解市场动态
- 竞争分析
- 客户洞察
- 市场预测
- 风险规避
- 战略规划
- 投资论证
- 识别新兴市场
- 优化营销策略
- 提升运营效率
- 顺应监管趋势


