数字病理学市场概况、增长、趋势、分析、研究报告(2022-2028 年)
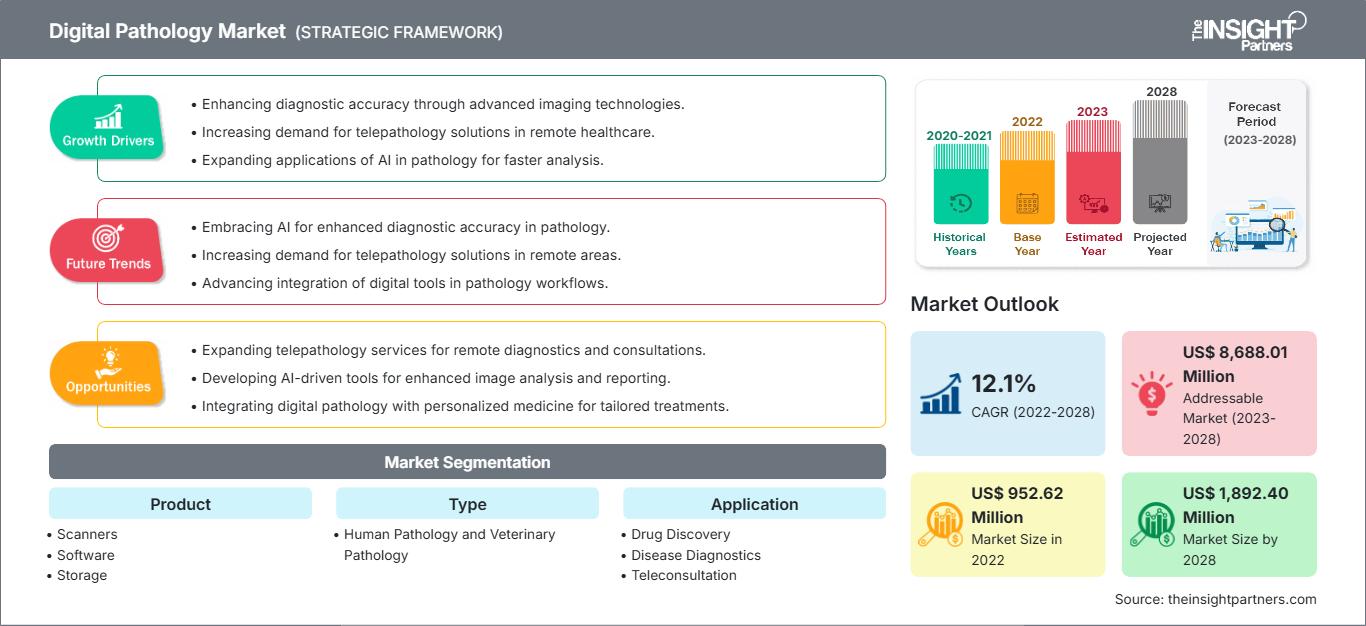
历史数据 : 2020-2021 | 基准年 : 2022 | 预测期 : 2023-20282028 年数字病理学市场预测——COVID-19 影响和全球分析,按产品(扫描仪、软件、存储和通信系统)、类型(人体病理学和兽医病理学)、应用(药物发现、疾病诊断、远程会诊和培训与教育)和最终用户(制药和生物技术公司、医院和学术机构)
- 状态 : 已发布
- 报告代码 : TIPHE100000855
- 类别 : 科技、媒体和电信
- 页数 : 226
- 可用报告格式 :


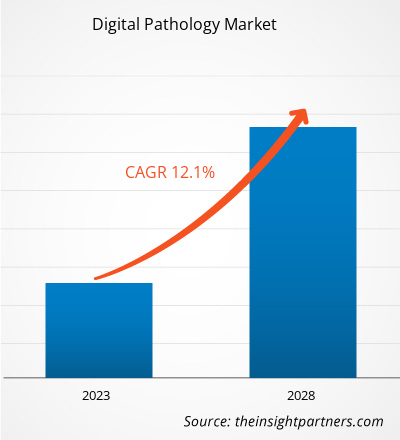
[研究报告]数字病理学市场规模预计将从2022年的9.5262亿美元增长到2028年的18.924亿美元;预计2022年至2028年的复合年增长率为12.1%。
市场洞察与分析师观点:
数字病理学涵盖病理信息的获取、管理、共享和解读,其中包括数字环境中的切片和数据。它会生成数字切片图像文件,以便对数字病理切片进行高分辨率查看、解读和图像分析。数字病理学使病理学家能够以透明和一致的状态快速远程参与、评估和协作,从而提高效率和生产力。数字病理学的未来最终可能涵盖增强型转化研究、计算机辅助诊断 (CAD) 和个性化医疗。数字病理学具有单靠玻片难以实现的优势,例如改进分析并减少错误。数字病理学的显著优势之一是它能够以多种方式提高短期和长期的生产力。
增长动力与挑战:
定期诊断是所有癌症治疗的第一步。传统病理学服务只能了解肿瘤细胞的位置,这使得病例难以共享以供二次审查。数字病理学的应用可以对肿瘤进行深入诊断。用于癌症诊断的数字病理学流程通常包括扫描传统的玻片,然后将连续的图像以数字方式合并成一张完整的图像,该图像可复制玻片上的信息。这些图片与相关的临床/医院或实验室信息相结合,为病理学家提供每种癌症状况的综合图像。2017年4月,飞利浦获得美国食品药品监督管理局 (FDA) 批准,在美国销售飞利浦IntelliSite病理学解决方案,用于主要诊断用途。随着癌症病例数量的不断增长,检测的复杂性和数量也随之增加。飞利浦IntelliSite病理解决方案通过图像创建、查看和管理系统等,实现了自动化数字病理学,其中包括超快速病理切片扫描仪等功能。同样,罗氏于2021年1月推出了CE-IVD自动化数字病理学算法,该算法能够进行uPath HER2 Dual ISH图像分析和uPath HER2 (4B5)图像分析,用于乳腺癌诊断,并帮助医疗保健提供者为每位患者确定最佳治疗策略。人工智能被用于图像分析算法,以帮助病理学家快速准确地诊断乳腺癌患者。因此,癌症诊断技术的进步正在推动数字病理学市场的增长。
自定义此报告以满足您的要求
您将免费获得任何报告的定制,包括本报告的部分内容,或国家级分析、Excel 数据包,以及为初创企业和大学提供超值优惠和折扣
数字病理学市场: 战略洞察
-
获取本报告的主要市场趋势。这个免费样本将包括数据分析,从市场趋势到估计和预测。
报告细分和范围:
“全球数字病理学市场”根据产品、类型、应用、最终用户和地域进行细分。根据产品,数字病理学市场细分为扫描仪、软件、通信系统和存储。根据类型,数字病理学市场分为人类病理学和兽医病理学。根据应用,数字病理学市场细分为远程会诊、疾病诊断、药物发现和培训与教育。根据最终用户,数字病理学市场细分为制药和生物技术公司、医院和学术机构。基于地域的数字病理学市场细分为北美(美国、加拿大和墨西哥)、欧洲(德国、法国、意大利、英国、俄罗斯和欧洲其他地区)、亚太地区(澳大利亚、中国、日本、印度、韩国和亚太其他地区)、中东和
非洲(南非、沙特阿拉伯、阿联酋、中东和非洲其他地区)以及南美和中美(巴西、阿根廷、南美和中美其他地区)
细分分析:
基于产品,数字病理学市场细分为扫描仪、软件、存储和通信。扫描仪细分市场在 2021 年占据了最大的市场份额,预计在预测期内,该细分市场的复合年增长率最高,为 12.3%。扫描仪有助于快速、可靠地生成高分辨率的细胞图像。它可以帮助病理学家、组织学家和其他医疗专业人员扫描幻灯片并将图像上传到网络进行远程访问和与同行协作。扫描仪提供自动细胞成像,用于固定细胞分析和荧光、相衬和透射光。技术进步为扫描仪添加了集成软件,用于进一步分析、编辑、管理和共享虚拟幻灯片。例如,2021年4月,领先的端到端数字病理解决方案提供商Optra Scan推出了OS-ultra 320,这是全球首款经济实惠的高速数字病理扫描仪。
该病理成像系统采用新的扫描仪技术和软件进行病理检查,将切片数字化。它取代了标准的切片和显微镜病理工作流程。病理学家可以借助精密仪器,通过数字化切片来检查病理工作流程的高质量数字照片。该系统可以将图像存储在计算机中,从而改进病理工作流程。因此,病理成像系统市场预计将增长。
根据类型,数字病理市场分为人类病理学和兽医病理学。预计人类病理学领域将在2022年占据最大的市场份额,达到65.94%,并预计在预测期内将实现12.5%的最高复合年增长率。人类病理学领域增长的主要驱动因素是癌症研究活动的增多以及研究机构、大学和病理实验室之间日益密切的合作。人类病理学旨在为实验室和临床医生提供对人类疾病具有临床病理学意义的信息。它代表了从形态学和临床实验室研究中提取的信息,可直接用于理解人类疾病。它涵盖了患者护理的各个方面,从诊断测试和治疗建议到使用尖端基因技术和预防疾病。
根据应用,数字病理学市场细分为远程会诊、疾病诊断、药物研发以及培训和教育。2021年,药物研发领域可能占据最大的市场份额,预计未来几年该领域将以最快的速度增长。数字病理学的优势不仅限于提高速度和结果的准确性,它还使病理学家能够跨越地理距离,向制药和生物技术公司展示他们的专业知识。生物技术和制药公司在临床前研究中始终面临着审查和分析数千张切片的难题。数字病理学可以自动化图像分析,提供对海量组织病理学数据的即时智能访问,最终加快发现过程。公司研究人员可以通过互联网查看数字切片,这比目前单一视野的图像查看方法有了显著改进。
根据最终用户,数字病理学市场细分为制药和生物技术公司、医院和学术机构。制药和生物技术公司部门很可能在2021年占据最大的市场份额,然而,重组疫苗部门预计在预测期内将实现12.5%的最高复合年增长率。制药和生物技术公司正在积极主动地以数字化方式管理其工作;这些公司不断致力于发现药物或疗法的分子和生物标志物。数字病理学通过实现制药公司和研发实验室之间的数据共享,有助于推动全球药物研究的转型。这些公司通过收集和分析患者病情数据来评估药物。数字病理学解决方案可帮助这些公司维护记录并有效管理工作流程。例如,安捷伦科技、基因泰克等公司正在与人工智能公司合作,以升级其流程,例如数字化其病理实验室和生产先进的疗法。
区域分析:
根据地域划分,数字病理学市场分为五个主要区域:北美、欧洲、亚太地区、南美和中美以及中东和非洲。由于慢性病负担加重、慢性病管理技术的应用日益普及、投资增加、产品发布增多以及市场领导者采取的举措,北美很可能在2021年占据全球市场的显著份额。预计美国在预测期内将大幅增长。癌症、阿尔茨海默病等慢性病病例的增加预计将推动数字病理学市场的发展。例如,美国癌症协会 2022 年报告估计,2022 年美国将诊断出约 2,36,740 例新的肺癌病例。同一消息来源还指出,2022 年将报告 79,000 例新的肾癌病例。此外,国际糖尿病联合会 (IDF) 2021 年 12 月的报告估计,2021 年墨西哥有 1400 万成年人患有糖尿病。此外,根据加拿大政府 2021 年 8 月发布的新闻稿,糖尿病是影响加拿大人的主要慢性病,截至 2021 年 8 月,超过 300 万加拿大人和 6.1% 的加拿大成年人患糖尿病的风险很高。癌症的高负担预计将刺激对数字病理学的需求,从而推动市场增长。欧洲是全球细胞开发市场的第二大地区。预测期内,德国在欧洲数字病理学市场中占有最大份额,原因是法国对数字病理学项目、教育和培训计划的支持增加、英国癌症患病率上升和采用数字病理学解决方案以及德国会议数量的增加等因素可能会推动欧洲数字病理学市场的增长,这些因素推动了欧洲数字病理学市场的增长。
数字病理学市场区域洞察
The Insight Partners 的分析师已详尽阐述了预测期内影响数字病理学市场的区域趋势和因素。本节还讨论了北美、欧洲、亚太地区、中东和非洲以及南美和中美洲的数字病理学市场细分和地域分布。
数字病理学市场报告范围
| 报告属性 | 细节 |
|---|---|
| 市场规模 2022 | US$ 952.62 Million |
| 市场规模 2028 | US$ 1,892.40 Million |
| 全球复合年增长率 (2022 - 2028) | 12.1% |
| 历史数据 | 2020-2021 |
| 预测期 | 2023-2028 |
| 涵盖的领域 |
By 产品
|
| 覆盖地区和国家 |
北美
|
| 市场领导者和主要公司简介 |
|
数字病理学市场参与者密度:了解其对业务动态的影响
数字病理学市场正在快速增长,这得益于终端用户需求的不断增长,而这些需求的驱动因素包括消费者偏好的不断变化、技术进步以及对产品优势的认知度不断提高。随着需求的增长,企业正在扩展其产品线,不断创新以满足消费者需求,并利用新兴趋势,从而进一步推动市场增长。
- 获取 数字病理学市场 主要参与者概述
行业发展和未来机遇:
全球数字病理学市场主要参与者采取的各种举措如下:
- 2022 年 6 月,SpIntellx, Inc. 和 Inspirata 合作将 SpIntellx HistoMapr-Breast 平台与 Inspirata 的 Dynamyx 软件集成为无缝解决方案。 HistoMapr-Breast 是唯一一款利用可解释人工智能 (xAI) 的力量帮助医疗保健提供者更准确、更有效地诊断、预测和治疗乳腺癌的计算病理学软件。
- 2022 年 6 月,罗氏获得 CE-IVD 批准,标志着下一代用于数字病理学的 Ventana DP 600 幻灯片扫描仪。
- 2020 年 5 月,丹纳哈尔 (Leica Biosystems) 在亚太地区推出了其下一代数字病理扫描仪 Aperio GT 450 DX。 Aperio GT 450 DX 已获得 CE IVD 和 TGA 注册,具有连续加载、无接触操作和 40 倍放大倍数下 32 秒扫描时间等特点,可帮助医疗保健组织扩大数字病理学规模,从而在不牺牲质量的情况下满足不断增长的需求。
- 2020 年 7 月,3DHISTECH PANNORAMIC 扫描仪系列的三个主要成员 PANNORAMIC 250 Flash III、PANNORAMIC Scan II 和 PANNORAMIC Midi II 及其控制软件均已升级,以更好地满足癌症和药物研究、分子和发育组织学、神经科学等领域的不同需求。
- 2020 年 8 月,病理学工作流程解决方案的全球领导者 Danahar(徕卡生物系统)宣布在欧洲推出其 Aperio GT 450 DX 数字病理扫描仪。这款新一代成像系统在极为成功的 Leica Biosystems 数字病理虚拟峰会上亮相,目前已安装在英国利兹教学医院 NHS 信托基金的卓越中心。
- 2020 年 10 月,Indica Labs 宣布在美国国家癌症研究所 (NCI) 内部正式启动企业范围的基于云的 Indica Labs 软件部署,包括 HALO、HALO AI、HALO Link 和 HALO AP。NCI 内部数百名用户均可访问该软件,管理数百万张数字图像,并促进每天对数千张图像的分析,这是 Indica Labs 软件在全球范围内最大规模的单一部署。
- 2020 年 5 月,病理学工作流程解决方案的全球领导者 Danahar(Leica Biosystems)和国际医学成像 IT 和网络安全公司 Sectra 宣布合作,共同寻求获得美国食品和药物管理局的 510(k) 许可。美国食品药品监督管理局 (FDA) 即将推出该解决方案。其目标是通过集成临床数字病理学解决方案满足企业级客户(例如学术医疗中心、临床研究机构和大型医院网络)的临床需求。
竞争格局和主要公司:
一些知名的数字病理学公司包括荷兰皇家飞利浦公司 (Koninklijke Philips NV)、尼康公司 (Nikon Corporation)、珀金埃尔默公司 (Perkin Elmer, Inc.)、Indica Labs、3DHISTECH Ltd.、丹纳赫公司 (Danaher)、滨松光子学株式会社 (Hamamatsu Photonics KK)、F. HOFFMANN-LA ROCHE LTD.、Visiopharm A/S 和 Glencoe Software, Inc 等。这些公司专注于新产品的发布和地域扩张,以满足全球日益增长的消费者需求,并扩大其专业产品组合的范围。它们拥有广泛的全球影响力,这使得它们能够服务于大量客户,从而提高其数字病理学市场份额。

Ankita 是一位充满活力的市场研究和咨询专家,在科技、媒体、信息通信技术 (ICT) 以及电子和半导体领域拥有超过 8 年的经验。她成功领导并完成了 100 多项咨询和研究项目,服务对象包括微软、甲骨文、NEC Corporation、SAP、毕马威和 Expeditors International 等全球客户。她的核心能力包括市场评估、数据分析、预测、战略制定、竞争情报和报告撰写。
Ankita 擅长处理完整的项目周期——从售前的方案设计和客户洽谈,到售后提供切实可行的洞察。她擅长管理跨职能团队、构建复杂的研究模块,并根据客户特定的业务目标调整解决方案。她卓越的沟通能力、领导能力和演讲能力使她能够在快速变化的市场环境中持续提供价值驱动的成果。
- 历史分析(2 年)、基准年、预测(7 年)及复合年增长率
- PEST和SWOT分析
- 市场规模、价值/数量 - 全球、区域、国家
- 行业和竞争格局
- Excel 数据集
客户评价
Insight Partners 的 SCADA 系统市场报告内容全面,对当前趋势和未来预测提供了宝贵的见解。该团队始终高度专业、响应迅速且乐于助人。我们非常满意,强烈推荐他们的服务。
兰·凯德姆 伙伴, Reali Technologies LTD我请求一份关于特定软件市场的报告,团队在几天内就完成了。报告信息非常相关,而且呈现得非常出色。之后,我请求对报告进行一些修改和补充。团队再次迅速响应,不到一周我就收到了最终报告。
让-埃尔韦·詹恩 主席, 未来分析公司我们与 Insight Partners 合作进行了一项重要的市场研究和预测。他们清晰地洞察了机遇和风险,帮助我们制定了计划。他们的研究简单易用,数据可靠,帮助我们做出了明智而自信的决策。我们强烈推荐他们。
皮尤什·纳格帕尔 高级副总裁, 远光全球Insight Partners 凭借其深厚的行业专业知识,提供了富有洞察力、结构合理的市场研究。他们的团队始终专业且响应迅速。用户友好的网站让访问行业报告变得顺畅无阻。我们强烈推荐他们可靠、高质量的研究服务。
安达幸彦 首席执行官, 深蓝有限责任公司这是我第一次从The Insight Partners购买市场报告。起初我有些犹豫,但访问了他们的网站后,我更放心地冒险购买市场报告。我对报告的质量和客户服务非常满意。我对最初的报告有一些疑问和意见,但在与他们的分析师通过电子邮件沟通了几次后,我相信这份报告可以作为我们战略规划流程的参考。非常感谢您抽出宝贵的时间,让这次体验如此愉快。我一定会向其他人推荐你们的服务,当我们需要更多市场数据时,你们将是我的首选。
约翰·铃木 总裁兼首席执行官、董事会董事, BK科技感谢您在处理我关于尼日利亚传染病体外诊断市场信息请求的过程中所展现的支持和专业精神。感谢您的耐心、指导,以及您愿意提供的折扣,最终促成了这笔交易。我期待未来与 Insight Partners 继续合作,这一切都要归功于您与我初次接触后留下的良好印象。
奇吉奥克博士 ONYIA 董事总经理, PineCrest 医疗保健有限公司购买理由
- 明智的决策
- 了解市场动态
- 竞争分析
- 客户洞察
- 市场预测
- 风险规避
- 战略规划
- 投资论证
- 识别新兴市场
- 优化营销策略
- 提升运营效率
- 顺应监管趋势


 获取免费样品 - 数字病理学市场