


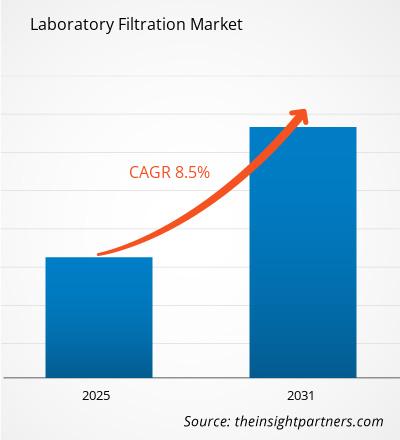
预计到2034年,实验室过滤市场规模将从2025年的47.9亿美元增长至84.6亿美元。预计在2026年至2034年的预测期内,该市场将以6.52%的复合年增长率增长。
本报告按产品(过滤组件、滤材配件)进行细分。报告还基于技术(超滤、微滤、纳滤、反渗透)进行分析。报告按最终用户(制药、生物制药公司、食品饮料)进行细分。全球分析进一步细化到区域和主要国家层面。报告以美元为单位提供上述分析和细分市场的价值。
报告目的
The Insight Partners发布的《实验室过滤市场报告》旨在描述当前市场格局和未来增长趋势,以及主要驱动因素、挑战和机遇。该报告将为各类商业利益相关者提供参考,例如:
- 技术提供商/制造商:了解不断变化的市场动态和潜在的增长机会,从而能够做出明智的战略决策。
- 投资者:对市场增长率、市场财务预测以及整个价值链中存在的机会进行全面的趋势分析。
- 监管机构:监管市场政策和执法活动,旨在最大限度地减少滥用行为,维护投资者信任和信心,维护市场的完整性和稳定性。
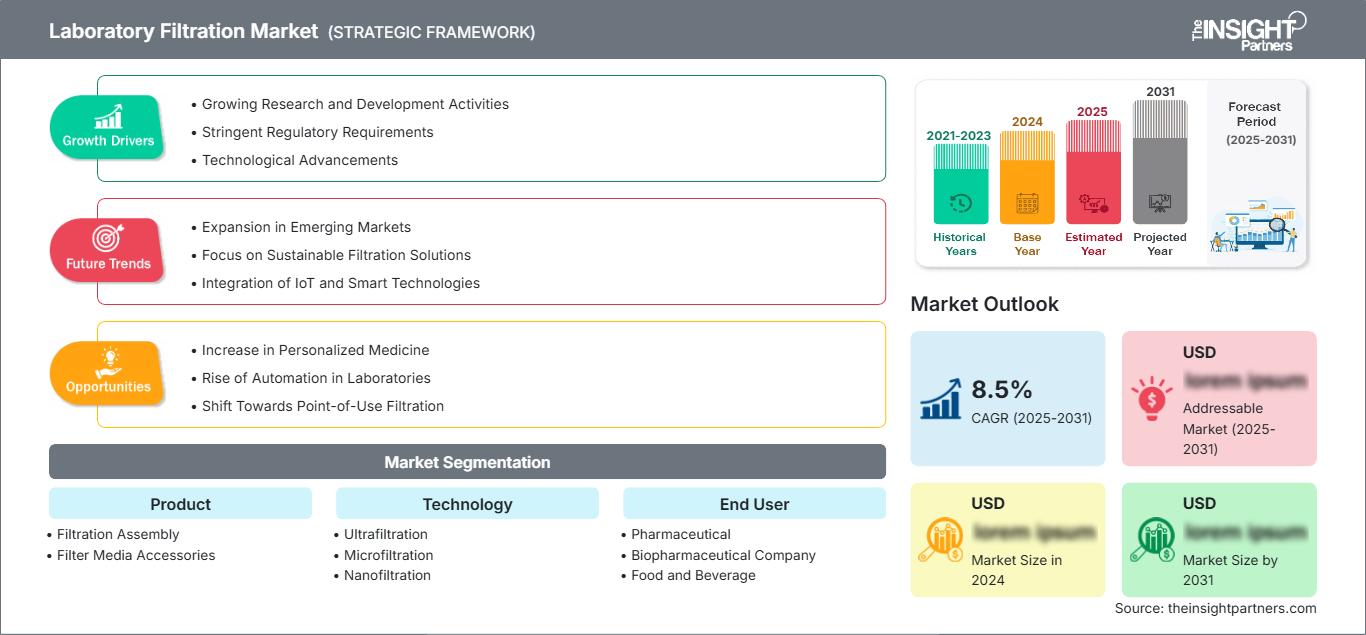
实验室过滤市场细分
产品
- 过滤组件
- 过滤介质配件
技术
- 超滤
- 微滤
- 纳米过滤
- 罗
最终用户
- 制药
- 生物制药公司
- 食品和饮料
地理
- 北美
- 欧洲
- 亚太
- 南美洲和中美洲
- 中东和非洲
市场调研亮点
- 2025年全球实验室过滤市场价值将达到47.9亿美元。
- 预计到2034年,年市场规模将达到84.6亿美元。
- 预计2026年至2034年期间,总潜在市场规模(TAM)将达到约599.1亿美元。
- 预计市场在预测期内将实现 6.52% 的复合年增长率。
- 美国是一个关键市场,这得益于不断增长的研发活动、严格的监管要求、技术进步以及不断变化的行业动态。
- 市场分析涵盖北美、欧洲、亚太地区、南美和中美洲、中东和非洲,并对预测期内的增长情况进行评估。
- 个性化医疗的兴起、实验室自动化程度的提高以及即时过滤技术的普及等市场机遇预计将影响市场动态和目标市场规模。
- 报告概述了包括3M、安捷伦科技公司、AMD制造公司、AQUAPORIN A/S、Avantor公司、Cole-Parmer、丹纳赫公司、GVS SpA、MACHEREY-NAGEL GmbH & Co. KG、默克密理博在内的行业参与者,同时分析了竞争策略和创新发展。
根据您的需求定制此报告
获取免费定制服务实验室过滤市场:战略洞察
-
获取本报告的主要市场趋势。这份免费样品将包含数据分析,内容涵盖市场趋势、估算和预测等。
实验室过滤市场增长驱动因素
- 研发活动日益增长:实验室过滤市场最大的驱动力是各领域研发活动的不断增长,尤其是在制药、生物技术和环境科学领域。对于寻求创新和质量改进的机构而言,高效的过滤工艺至关重要。在研究环境中,该工艺对于去除杂质、纯化样品以及满足合规性和监管标准都至关重要。有时,为了确保药物的安全性和有效性,对高质量过滤的需求日益增长,并需要满足更严格的条件。
- 严格的监管要求:美国食品药品监督管理局 (FDA) 和欧洲药品管理局 (EMA) 等机构对制药、食品饮料等行业的质量和安全控制有着严格的监管要求。这些法规要求开发符合相关标准的精密过滤技术。因此,实验室正在投资研发先进的过滤技术,以确保其流程符合这些法规。市场增长主要归功于实验室过滤设备(包括膜、过滤器及相关配件)使用量的增加。
- 技术进步:在实验室过滤市场,技术正飞速发展,旨在提高过滤过程的效率和效果。纳滤、超滤和微滤领域持续进步,不断提升对更小颗粒和污染物的过滤能力。此外,自动化过滤系统提高了实验室工作流程的效率,减少了人工投入,同时提高了处理量。这些技术进步将使过滤过程更加便捷高效,从而进一步推动市场发展。
实验室过滤市场未来趋势
- 新兴市场扩张:一些关键的增长机遇来自新兴经济体,尤其是在亚太地区、拉丁美洲和中东地区。医疗保健领域在药品和研发基础设施建设方面的投资不断增加,将为企业带来扩大对实验室过滤解决方案需求的机会。
- 聚焦可持续过滤解决方案:可持续发展和环境保护的压力日益增大,这为环保型过滤产品进入市场打开了大门。可生物降解材料和低能耗过滤系统正逐渐受到青睐。致力于提供“绿色”产品的公司不仅吸引了消费者,也吸引了那些关注环境问题的机构。随着实验室对水净化和废物管理解决方案的需求不断增长,这一趋势在市场潜力方面展现出更广阔的空间。
- 物联网与智能技术的融合:将物联网技术融入实验室过滤系统是一项全新的挑战,因为它为创新提供了无限可能。此类智能过滤设备可以实时记录参数,用于优化和故障排除。这种互联互通显著提升了实验室的工作效率,并有助于其更好地遵守监管标准。随着实验室越来越多地采用这些智能技术,提供互联过滤解决方案的公司必将获得竞争优势。
实验室过滤市场机遇
- 个性化医疗的兴起:实验室过滤技术受到个性化医疗趋势的影响,尤其是在制药和生物技术领域。先进的定制化治疗对过滤精度提出了极高的要求,以确保产品的纯净度和稳定性。实验室越来越多地采用过滤技术,以根据患者的独特情况制定治疗方案;因此,实验室需要高度先进的过滤系统。
- 实验室自动化的兴起:自动化正在改变实验室的运作方式,从过滤开始。随着自动化系统的不断发展,人工操作造成的错误和污染风险降至最低,可重复性显著提高,处理量也随之提升。因此,自动化过滤系统非常适合高通量实验室,能够以最小的人工干预处理大量样本。随着实验室力求通过降低人工成本来提高效率,自动化过滤解决方案的普及率将会不断提高。
- 转向即时过滤:实验室水净化和样品制备已转向即时过滤系统。此类系统可快速提供纯净水和其他溶液,从而避免依赖中央过滤装置。当实验室空间有限或研究活动需要快速获取过滤溶液时,这一点尤为重要。即时过滤系统的重要性日益凸显,因此,随着此类设备需求的不断增长,制造商可能会致力于开发更紧凑、更高效的过滤解决方案。
实验室过滤市场报告范围
| 报告属性 | 细节 |
|---|---|
| 2025年市场规模 | 47.9亿美元 |
| 到2034年市场规模 | 84.6亿美元 |
| 全球复合年增长率(2026-2034 年) | 6.52% |
| 史料 | 2021-2024 |
| 预测期 | 2026-2034 |
| 涵盖部分 |
副产品
|
| 覆盖地区和国家 |
北美
|
| 市场领导者和主要公司简介 |
|
实验室过滤市场参与者密度:了解其对业务动态的影响
实验室过滤市场正快速增长,这主要得益于终端用户需求的不断增长,而终端用户需求的增长又源于消费者偏好的转变、技术的进步以及消费者对产品优势认知的提高。随着需求的增长,企业不断拓展产品和服务,持续创新以满足消费者需求,并把握新兴趋势,这些都进一步推动了市场增长。
主要卖点
- 全面覆盖:该报告全面分析了实验室过滤市场的产品、服务、类型和最终用户,提供了一个全面的市场概况。
- 专家分析:该报告是根据行业专家和分析师的深入理解编制的。
- 最新信息:该报告涵盖了最新的信息和数据趋势,确保了其与业务的相关性。
- 定制选项:本报告可根据客户的具体需求进行定制,并能恰当地适应业务战略。
因此,这份关于实验室过滤市场的研究报告有助于深入了解和解读行业现状及增长前景。尽管其中可能存在一些合理的担忧,但总体而言,这份报告的优势远大于劣势。

Mrinal 是一位经验丰富的研究分析师,在生命科学市场情报和咨询领域拥有超过 8 年的经验。凭借战略思维和对卓越的不懈追求,她在医药预测、市场机遇评估和行业基准制定方面积累了深厚的专业知识。她的工作致力于提供切实可行的洞察,帮助客户做出明智的战略决策。
Mrinal 的核心优势在于将复杂的定量数据集转化为有意义的商业智能。她敏锐的分析能力有助于制定市场进入 (GTM) 战略,并发掘制药和医疗器械行业的增长机会。作为一名值得信赖的顾问,她始终致力于简化工作流程并建立最佳实践,从而为客户推动创新并提高运营效率。
- 历史分析(2 年)、基准年、预测(7 年)及复合年增长率
- PEST和SWOT分析
- 市场规模、价值/数量 - 全球、区域、国家
- 行业和竞争格局
- Excel 数据集
客户评价
Insight Partners 的 SCADA 系统市场报告内容全面,对当前趋势和未来预测提供了宝贵的见解。该团队始终高度专业、响应迅速且乐于助人。我们非常满意,强烈推荐他们的服务。
兰·凯德姆 伙伴, Reali Technologies LTD我请求一份关于特定软件市场的报告,团队在几天内就完成了。报告信息非常相关,而且呈现得非常出色。之后,我请求对报告进行一些修改和补充。团队再次迅速响应,不到一周我就收到了最终报告。
让-埃尔韦·詹恩 主席, 未来分析公司我们与 Insight Partners 合作进行了一项重要的市场研究和预测。他们清晰地洞察了机遇和风险,帮助我们制定了计划。他们的研究简单易用,数据可靠,帮助我们做出了明智而自信的决策。我们强烈推荐他们。
皮尤什·纳格帕尔 高级副总裁, 远光全球Insight Partners 凭借其深厚的行业专业知识,提供了富有洞察力、结构合理的市场研究。他们的团队始终专业且响应迅速。用户友好的网站让访问行业报告变得顺畅无阻。我们强烈推荐他们可靠、高质量的研究服务。
安达幸彦 首席执行官, 深蓝有限责任公司这是我第一次从The Insight Partners购买市场报告。起初我有些犹豫,但访问了他们的网站后,我更放心地冒险购买市场报告。我对报告的质量和客户服务非常满意。我对最初的报告有一些疑问和意见,但在与他们的分析师通过电子邮件沟通了几次后,我相信这份报告可以作为我们战略规划流程的参考。非常感谢您抽出宝贵的时间,让这次体验如此愉快。我一定会向其他人推荐你们的服务,当我们需要更多市场数据时,你们将是我的首选。
约翰·铃木 总裁兼首席执行官、董事会董事, BK科技感谢您在处理我关于尼日利亚传染病体外诊断市场信息请求的过程中所展现的支持和专业精神。感谢您的耐心、指导,以及您愿意提供的折扣,最终促成了这笔交易。我期待未来与 Insight Partners 继续合作,这一切都要归功于您与我初次接触后留下的良好印象。
奇吉奥克博士 ONYIA 董事总经理, PineCrest 医疗保健有限公司购买理由
- 明智的决策
- 了解市场动态
- 竞争分析
- 客户洞察
- 市场预测
- 风险规避
- 战略规划
- 投资论证
- 识别新兴市场
- 优化营销策略
- 提升运营效率
- 顺应监管趋势


 获取免费样品 - 实验室过滤市场