光纤市场战略、顶级参与者、增长机会、2030 年分析和预测
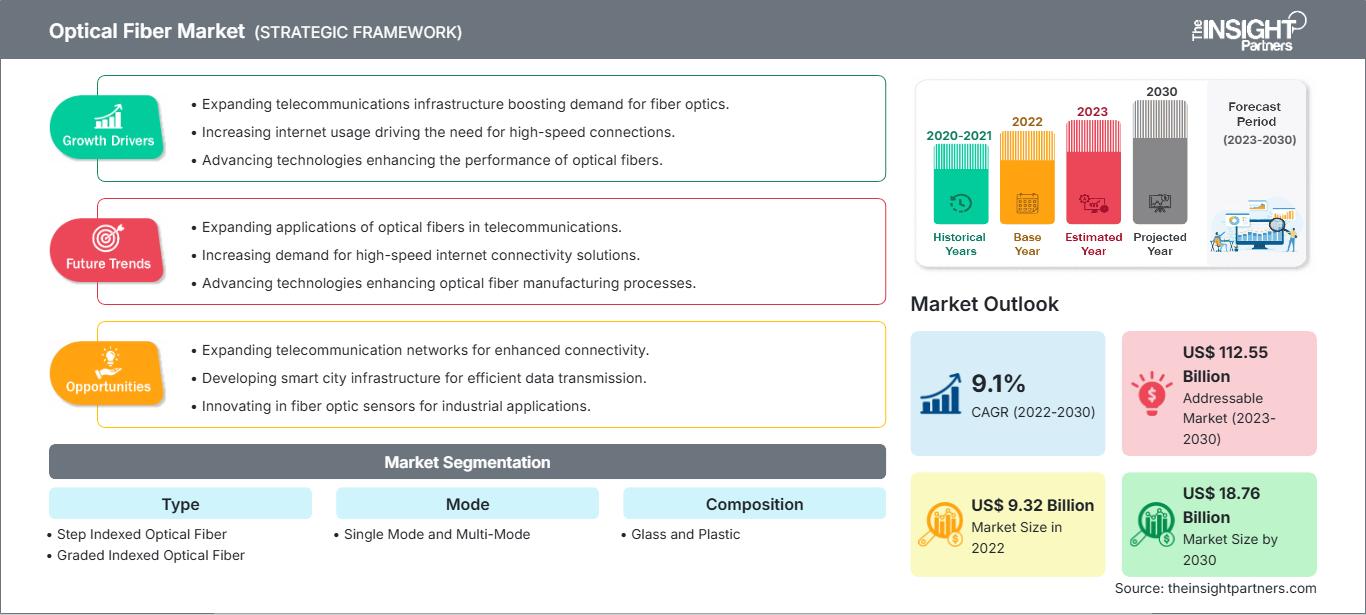
光纤市场规模和预测(2020-2030 年)、全球和区域份额、趋势和增长机会分析报告范围:按类型(阶跃折射率光纤和渐变折射率光纤)、模式(单模和多模)、成分(玻璃和塑料)、最终用户(电信和网络、工业自动化、医疗、国防等)和地理区域(北美、欧洲、亚太地区、南美和中美)
- 状态 : 已发布
- 报告代码 : TIPTE100000234
- 类别 : 电子和半导体
- 页数 : 194
- 可用报告格式 :


- 最后更新日期 : August 06, 2024


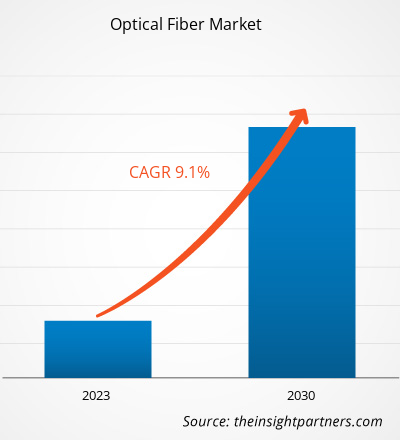
光纤市场规模预计将从 2022 年的 93.2 亿美元增长到 2030 年的 187.6 亿美元;预计 2022 年至 2030 年的复合年增长率将达到 9.1%。高速互联网需求的不断增长以及电信基础设施的不断发展预计将成为市场的主要趋势。
光纤市场分析
预计光纤网络的发展将受到消费者数据需求激增和物联网 (IoT) 设备快速普及的推动。此外,全球许多国家的政府都对光纤部署进行了大量投资,为市场增长创造了丰厚的机遇。例如,美国需要在未来五到七年内大幅扩建光纤基础设施,以支持即将到来的 5G 无线网络、促进宽带竞争并提供农村宽带覆盖。这需要在光纤电缆部署方面投资约 1300 亿至 1500 亿美元。这些发展凸显了电信行业企业在利用日益增长的光纤基础设施需求和5G革命带来的机遇方面拥有巨大的潜力,从而进一步推动光纤市场的增长。
光纤市场行业概览
光纤,也称为光导纤维,是一种高度柔韧的玻璃或塑料纤维,能够将光信号从一端传输到另一端。这些光纤在光纤通信中发挥着至关重要的作用,与传统电缆相比,它具有更长的传输距离和更高的带宽。光纤比金属线更受欢迎,因为光纤信号损耗更低,并且不易受电磁干扰,而电磁干扰是金属线的常见问题。除了电信领域,光纤还广泛用于照明、成像以及将光或图像传输到密闭空间等应用,类似于光纤内窥镜的应用。此外,特种光纤还用于各种用途,包括光纤传感器和光纤激光器。
自定义此报告以满足您的要求
您将免费获得任何报告的定制,包括本报告的部分内容,或国家级分析、Excel 数据包,以及为初创企业和大学提供超值优惠和折扣
光纤市场: 战略洞察
-
获取本报告的主要市场趋势。这个免费样本将包括数据分析,从市场趋势到估计和预测。
光纤市场驱动力与机遇
光纤到户 (FTTH) 连接采用率提高有利于市场增长
传统互联网技术无法与 FTTH 更快的速度和更可靠的连接竞争。根据光纤宽带协会 (FBA) 进行的研究,2021 年美国使用光纤互联网的住宅数量超过 6000 万,比 2020 年的约 5400 万增长 12%。此外,该研究还显示,43% 的美国家庭和 60% 的加拿大家庭可以使用光纤互联网。根据调查,Verizon、AT&T 和 Lumen 等大型市场参与者位列前五大有线电视管理服务组织 (MSO) 之列,约占所有光纤互联网连接的 72%。相比之下,Frontier、Windstream、TDS 和 Consolidated 等二级区域运营商的新增用户数量占比为 10%。
不断增长的 5G 基础设施
预计在预测期内,向 5G 的过渡和相关的基础设施升级将推动光纤需求的增长。疫情引发了通信领域的范式转变,越来越多的人选择远程办公、在线学习并通过数字平台传输信息。因此,预计全球光纤铺设服务将迎来迅猛发展。这将加速 5G 技术的落地,使人们能够获得更快的连接速度,从而促进发展和进步,从而造福大众。因此,预计不断增长的 5G 基础设施将在预测期内推动对光纤的需求。
光纤市场报告细分分析
促成光纤市场分析的关键细分是按类型、模式、成分和最终用户划分的覆盖范围。
- 根据类型,光纤市场细分为阶跃折射率光纤和渐变折射率光纤。渐变折射率光纤在 2022 年占据了更大的光纤市场份额,预计在预测期内将在市场上录得更高的复合年增长率。渐变折射率光纤在纤芯中具有不同的折射率,从纤芯中心向外移动时折射率会减小。光在穿过介质时,在弯曲路径中在边缘的传播速度比在中心的传播速度快。渐变折射率光纤可以是多模的,也可以是单模的。多模渐变折射率光纤比阶跃折射率光纤具有更大的纤芯直径,因此带宽也更大。由于带宽较大,多模渐变折射率光纤用于高速数据传输。
按地区划分的光纤市场份额分析
按地区划分,市场分为北美、欧洲、亚太地区、中东和非洲以及南美和中美洲。
2022 年,亚太地区占据了最大的光纤市场份额。亚太地区各国正在经历向技术先进格局的动态转变,重点是智慧城市项目,例如物联网 (IoT) 的整合和医疗保健系统的进步。光纤通过提供高速和最小延迟的实时数据传输和通信来支持这些项目。此外,该地区光纤连接器使用量的增加对于实现可靠和高速的通信接口至关重要,而这反过来又推动了市场的发展。
推动亚洲市场扩张的主要因素之一是水下光缆使用量的增加。除了提高网络容量和频谱效率外,它还增强了国家之间的互联互通。随着对可靠连接和快速数据传输的需求日益增长,水下光缆的使用频率可能会更高,这将有助于区域市场的扩张。例如,亚非欧1号海底光缆系统(AAE-1)连接了亚洲、中东、非洲和欧洲的多个国家,全长超过25,000公里。AAE-1海底光缆系统的部署极大地提高了该地区光纤的利用率。此外,亚太地区的光纤宽带总量占住宅固网宽带用户群的85.1%以上。
光纤市场区域洞察
The Insight Partners 的分析师已详尽阐述了预测期内影响光纤市场的区域趋势和因素。本节还讨论了北美、欧洲、亚太地区、中东和非洲以及南美和中美洲的光纤市场细分和地域分布。
光纤市场报告范围
| 报告属性 | 细节 |
|---|---|
| 市场规模 2022 | US$ 9.32 Billion |
| 市场规模 2030 | US$ 18.76 Billion |
| 全球复合年增长率 (2022 - 2030) | 9.1% |
| 历史数据 | 2020-2021 |
| 预测期 | 2023-2030 |
| 涵盖的领域 |
By 类型
|
| 覆盖地区和国家 |
北美
|
| 市场领导者和主要公司简介 |
|
光纤市场参与者密度:了解其对业务动态的影响
光纤市场正在快速增长,这得益于终端用户需求的不断增长,而这些需求又源于消费者偏好的不断变化、技术进步以及对产品优势的认知度不断提升等因素。随着需求的增长,企业正在扩展产品线,不断创新以满足消费者需求,并抓住新兴趋势,从而进一步推动市场增长。
- 获取 光纤市场 主要参与者概述
光纤市场新闻和最新发展
光纤市场通过收集一手和二手研究后的定性和定量数据进行评估,这些数据包括重要的公司出版物、协会数据和数据库。光纤市场的一些发展如下:
- 康宁公司在波兰姆什克松沃开设了一家新的光纤制造工厂,以满足欧盟及周边地区日益增长的高速连接需求。该工厂是欧盟最大的光纤工厂之一,是康宁自 2020 年以来在光纤和光缆制造领域进行的一系列全球投资中的最新一项,这些投资总额超过 5 亿美元,这得益于不断增长的需求和强大的客户承诺。(来源:康宁公司,新闻稿,2023 年 9 月)
光纤市场报告覆盖范围和可交付成果
光纤市场预测基于各种二手和一手研究成果,例如主要公司出版物、协会数据和数据库。市场报告《光纤市场规模及预测(2020-2030)》对以下领域进行了详细的市场分析:
- 涵盖范围内所有关键细分市场的全球、区域和国家/地区光纤市场规模及预测
- 光纤市场趋势,以及市场动态,例如驱动因素、限制因素和关键机遇
- 详细的PEST/波特五力模型和SWOT分析
- 光纤市场分析,涵盖主要市场趋势、全球和区域框架、主要参与者、法规和最新市场发展
- 行业格局和竞争分析,涵盖市场集中度、热点图分析、知名参与者和光纤市场的最新发展
- 详细的公司简介。

Naveen 是一位经验丰富的市场研究和咨询专业人士,在定制项目、联合项目和咨询项目方面拥有超过 9 年的专业经验。他目前担任副总裁,成功管理了项目价值链中的利益相关者,撰写了 100 多份研究报告和 30 多项咨询项目。他的工作涵盖工业和政府项目,为客户的成功和数据驱动的决策做出了重要贡献。
Naveen 拥有卡纳塔克邦 VTU 的电子与通信工程学位,以及马尼帕尔大学的市场营销与运营 MBA 学位。他已担任 IEEE 会员 9 年,积极参与各种会议、技术研讨会,并在分部和地区层面担任志愿者。在此之前,他曾担任 IndustryARC 的助理战略顾问和惠普(惠普全球)的工业服务器顾问。
- 全面的市场规模与预测分析
- 详细的细分市场分析
- 深入的市场动态评估
- 区域及国家级洞察
- 竞争格局与企业对标分析
- 战略性商业情报
客户评价
Insight Partners 的 SCADA 系统市场报告内容全面,对当前趋势和未来预测提供了宝贵的见解。该团队始终高度专业、响应迅速且乐于助人。我们非常满意,强烈推荐他们的服务。
兰·凯德姆 伙伴, Reali Technologies LTD我请求一份关于特定软件市场的报告,团队在几天内就完成了。报告信息非常相关,而且呈现得非常出色。之后,我请求对报告进行一些修改和补充。团队再次迅速响应,不到一周我就收到了最终报告。
让-埃尔韦·詹恩 主席, 未来分析公司我们与 Insight Partners 合作进行了一项重要的市场研究和预测。他们清晰地洞察了机遇和风险,帮助我们制定了计划。他们的研究简单易用,数据可靠,帮助我们做出了明智而自信的决策。我们强烈推荐他们。
皮尤什·纳格帕尔 高级副总裁, 远光全球Insight Partners 凭借其深厚的行业专业知识,提供了富有洞察力、结构合理的市场研究。他们的团队始终专业且响应迅速。用户友好的网站让访问行业报告变得顺畅无阻。我们强烈推荐他们可靠、高质量的研究服务。
安达幸彦 首席执行官, 深蓝有限责任公司这是我第一次从The Insight Partners购买市场报告。起初我有些犹豫,但访问了他们的网站后,我更放心地冒险购买市场报告。我对报告的质量和客户服务非常满意。我对最初的报告有一些疑问和意见,但在与他们的分析师通过电子邮件沟通了几次后,我相信这份报告可以作为我们战略规划流程的参考。非常感谢您抽出宝贵的时间,让这次体验如此愉快。我一定会向其他人推荐你们的服务,当我们需要更多市场数据时,你们将是我的首选。
约翰·铃木 总裁兼首席执行官、董事会董事, BK科技感谢您在处理我关于尼日利亚传染病体外诊断市场信息请求的过程中所展现的支持和专业精神。感谢您的耐心、指导,以及您愿意提供的折扣,最终促成了这笔交易。我期待未来与 Insight Partners 继续合作,这一切都要归功于您与我初次接触后留下的良好印象。
奇吉奥克博士 ONYIA 董事总经理, PineCrest 医疗保健有限公司购买理由
- 明智的决策
- 了解市场动态
- 竞争分析
- 客户洞察
- 市场预测
- 风险规避
- 战略规划
- 投资论证
- 识别新兴市场
- 优化营销策略
- 提升运营效率
- 顺应监管趋势


