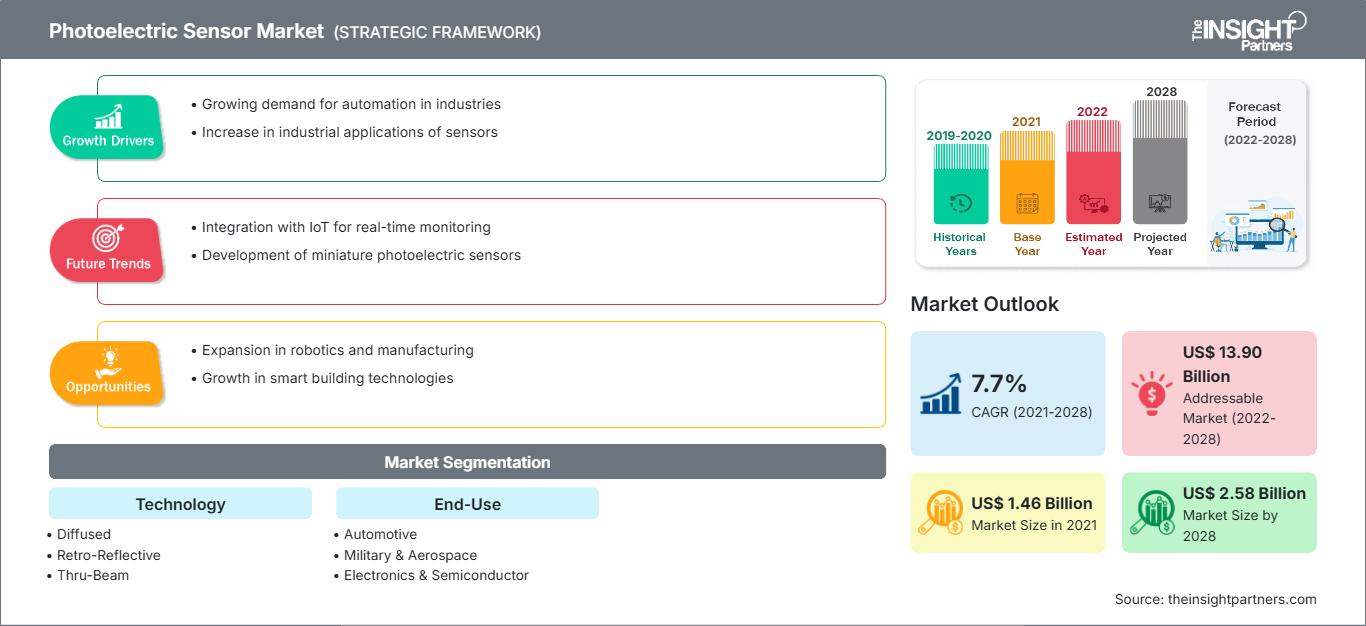
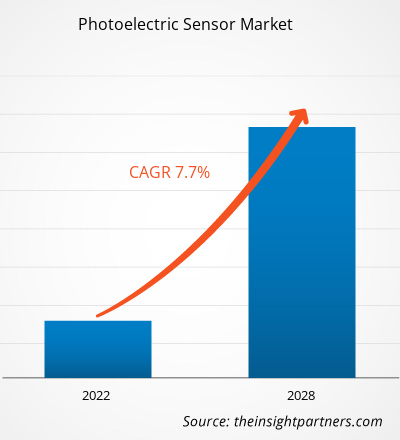
基于(关键地区、市场参与者、规模和份额)的光电传感器市场 - 到 2031 年的预测

  • Report Code : TIPRE00003240
  • Category : Electronics and Semiconductor
  • Status : Published
  • No. of Pages : 155
Buy Now

【研究报告】2021年光电传感器市场规模为14.5823亿美元,预计到2028年将达到25.7756亿美元;预计2021年至2028年复合年增长率为7.7%。

光电传感器因其高可靠性和远距离物体检测能力而越来越受欢迎,无论物体的大小、形状、颜色、材料和表面特性如何。这些传感器设计用于在恶劣条件下运行;此外,它们采用先进技术,确保可靠地抑制不良反射。这些功能使它们比许多其他传感器类型更通用,并且适合工业用途。例如,带有偏振滤光片的回归反射传感器可以检测任何形状和材料的车厢位置,这些车厢将保持在过山车的轨道上和轨道外。此外,光电传感器由于其高精度和可靠的性能而广泛应用于军事和航空航天工业。它们用于货机的烟雾和火灾探测。此外,光电传感器可帮助机身和发动机制造商监测压力、温度、加速度、光学位置和速度等航空航天系统参数。此外,国防工业广泛使用生物检测设备来检测环境中化学物质的存在,并通过检测有害生物材料来评估潜在生物威胁的风险,以保护军事和平民。因此,光电传感器操作的准确性和可靠性使其成为恶劣工业条件下的首选传感器类型。

COVID-19 大流行对光电传感器市场的影响

>

根据世界卫生组织(WHO)的最新报告,美国、西班牙、意大利、法国、德国、英国、俄罗斯、土耳其、巴西、伊朗和中国是受影响最严重的国家。 COVID-19 爆发。 2020年,世界经济遭受了重大影响,预计这种影响在未来几年将在一定程度上持续下去。疫情爆发扰乱了电子、半导体和制造业等主要行业。这些行业增长的急剧下滑正在限制光电传感器市场的增长。为抗击和遏制感染而实施的工厂关闭、旅行和贸易禁令以及边境封锁对各种传感器产品的制造、供应和销售产生了负面影响。

光电传感器制造商正在集中精力降低运营成本以保持竞争力。然而,预计他们将在封锁后阶段恢复生产活动。政府促进经济的举措和放松封锁预计将在预测期内刺激对光电传感器的需求。随着新技术在汽车和航空航天工业中得到更广泛的采用,对光电传感器的需求可能会扩大。

光电传感器提供商的利润丰厚的领域


光电传感器市场洞察

制药行业对光电传感器的需求不断增长推动光电传感器市场的增长

制药公司专注于提高整体制造水平避免由于生产线上没有药片而导致的空包装等差异。该行业越来越多地部署光电传感器用于片剂计数、瓶子灌装和计数验证(在临床试验中)。这些传感器还用于零售药店和医院的自动处方履行机。此外,光电传感器在传感范围方面的进步(提高了计数精度),以及通过在药品包装时排除人体接触来保持卫生的生产环境,都是光电传感器的优势。此外,光电传感器提供了一种经济有效的解决方案,这是通过制药行业的自动化生产线实现的。因此,制药公司采用光电传感器的激增主要归因于其提高效率、降低行业运营成本和促进实时生产监控的能力。这些传感器自动测量罐子或罐中液体的上液位和下液位。强腐蚀性化学品(酸性或碱性)的使用在制药公司中很常见,因此,储罐液位的检测是这些工厂的一项重要任务。因此,光电传感器在制药行业中的使用增加将推动未来几年光电传感器市场的增长。

基于技术的市场洞察

根据技术,光电传感器市场分为漫射型、回归反射型和对射型。 2020年,回归反射细分市场占据最大份额。

基于最终用户的市场洞察

基于最终用户用户方面,光电传感器市场细分为汽车、军事和航空航天、电子和半导体、包装等。 2020年,汽车领域占据最大市场份额。

战略洞察

光电传感器市场参与者采取的策略包括合并、收购和市场举措以维持其市场地位。下面列出了主要参与者的一些进展:

  • 2020 年 4 月,巴鲁夫光电传感器提供了状态监测数据。智能自动化和监控系统 (SAMS) 产品组合包括固体光电传感、状态监控和先进的 IO-link 技术,所有这些技术都旨在通过简化故障排除、转换和机器设置来节省停机时间。
  • 2020年2月,伊顿公司被《财富》杂志评为2020年全球最受尊敬的公司。

全球光电传感器市场已按上述细分如下:

按技术

  • 漫射
  • 回归反射
  • 透过光束

最终用户

  • 汽车
  • 军事和航空航天
  • 电子和半导体
  • 包装
  • 其他

按地理位置

  • 北美
    • 美国
    • 加拿大
    • 墨西哥
  • 欧洲
    • 法国
    • 德国
    • 意大利
    • 英国
    • 俄罗斯
    • 欧洲其他地区
  • 亚太地区 (APAC)
    • 中国
    • 印度
    • 韩国
    • 日本
    • 澳大利亚
    • < li>亚太地区其他地区
  • 中东和中东地区非洲 (MEA)
    • 南非
    • 沙特阿拉伯
    • 阿联酋
    • 中东和非洲其他地区
  • 南美洲 (SAM)
    • 巴西
    • 阿根廷
    • SAM 的其他地区

公司简介

  • 奥托尼克斯公司
  •   巴鲁夫有限公司
  •   伊顿公司
  •   Ifm Electronic GmbH
  •   基恩士公司
  •   欧姆龙公司
  •   罗克韦尔自动化公司
  •   松下公司
  •   SICK AG
  •   施耐德电气公司
Report Coverage
Report Coverage

Revenue forecast, Company Analysis, Industry landscape, Growth factors, and Trends

Segment Covered
Segment Covered

This text is related
to segments covered.

Regional Scope
Regional Scope

North America, Europe, Asia Pacific, Middle East & Africa, South & Central America

Country Scope
Country Scope

This text is related
to country scope.

Frequently Asked Questions


What are reasons behind Photoelectric Sensor market growth?

The growth of the Photoelectric Sensor market is primarily attributed to the accuracy and reliability of photoelectric sensors. Photoelectric sensors are gaining popularity due to their high reliability and long-range object detection capabilities, irrespective of the size, shape, color, material, and surface properties of objects. These sensors are designed to operate under harsh conditions; moreover, they are enabled with advanced technologies to ensure reliable suppression of undesirable reflections. These abilities makes them more versatile than many other sensor types and appropriate for industrial usage.

What are market opportunities for Photoelectric Sensor market?

Rising demand for photoelectric sensors in pharmaceuticals industry is providing noteworthy opportunities to the Photoelectric Sensor market players. Pharmaceutical companies focus on improving their overall manufacturing operations by avoiding discrepancies such as empty packaging, which can be caused due to the unavailability of medicine tablets on the production line. The industry is increasingly deploying photoelectric sensors for tablet counting, bottle filling, and count verification (in clinical trials). These sensors are also being used in automated prescription fulfillment machines at retail pharmacies and hospitals.

Which product is expected to dominate the market in the forecast period?

The rising need for of sensors and technological developments to solve complex challenges is encouraging innovations in photoelectric sensors. The pulse ranging technology (PRT), which can calculate object’s distance by using the principal of direct light propagation time measurement method, can be valuable in commercial industrial applications. PRT sensors provide accurate and continuous distance data with digital or analog outputs. In addition, positioning PRT sensors on each side of the carton and measuring these distances would also provide dimensions of pallets or cartons, which can be used to calculate the volume of the pallet or carton. The technology is expected to further improve the efficiency and accuracy of line assembly by providing comprehensive details of materials in production or operational process.

The List of Companies - Photoelectric Sensor Market

  1. Autonics Corporation
  2. Balluff GmbH
  3. Eaton Corporation plc
  4. Ifm Electronic GmbH
  5. Keyence Corporation
  6. OMRON Corporation
  7. Rockwell Automation, Inc.
  8. Panasonic Corporation
  9. SICK AG
  10. Schneider Electric SE

The Insight Partners performs research in 4 major stages: Data Collection & Secondary Research, Primary Research, Data Analysis and Data Triangulation & Final Review.

  1. Data Collection and Secondary Research:

As a market research and consulting firm operating from a decade, we have published and advised several client across the globe. First step for any study will start with an assessment of currently available data and insights from existing reports. Further, historical and current market information is collected from Investor Presentations, Annual Reports, SEC Filings, etc., and other information related to company’s performance and market positioning are gathered from Paid Databases (Factiva, Hoovers, and Reuters) and various other publications available in public domain.

Several associations trade associates, technical forums, institutes, societies and organization are accessed to gain technical as well as market related insights through their publications such as research papers, blogs and press releases related to the studies are referred to get cues about the market. Further, white papers, journals, magazines, and other news articles published in last 3 years are scrutinized and analyzed to understand the current market trends.

  1. Primary Research:

The primarily interview analysis comprise of data obtained from industry participants interview and answers to survey questions gathered by in-house primary team.

For primary research, interviews are conducted with industry experts/CEOs/Marketing Managers/VPs/Subject Matter Experts from both demand and supply side to get a 360-degree view of the market. The primary team conducts several interviews based on the complexity of the markets to understand the various market trends and dynamics which makes research more credible and precise.

A typical research interview fulfils the following functions:

  • Provides first-hand information on the market size, market trends, growth trends, competitive landscape, and outlook
  • Validates and strengthens in-house secondary research findings
  • Develops the analysis team’s expertise and market understanding

Primary research involves email interactions and telephone interviews for each market, category, segment, and sub-segment across geographies. The participants who typically take part in such a process include, but are not limited to:

  • Industry participants: VPs, business development managers, market intelligence managers and national sales managers
  • Outside experts: Valuation experts, research analysts and key opinion leaders specializing in the electronics and semiconductor industry.

Below is the breakup of our primary respondents by company, designation, and region:

Research Methodology

Once we receive the confirmation from primary research sources or primary respondents, we finalize the base year market estimation and forecast the data as per the macroeconomic and microeconomic factors assessed during data collection.

  1. Data Analysis:

Once data is validated through both secondary as well as primary respondents, we finalize the market estimations by hypothesis formulation and factor analysis at regional and country level.

  • Macro-Economic Factor Analysis:

We analyse macroeconomic indicators such the gross domestic product (GDP), increase in the demand for goods and services across industries, technological advancement, regional economic growth, governmental policies, the influence of COVID-19, PEST analysis, and other aspects. This analysis aids in setting benchmarks for various nations/regions and approximating market splits. Additionally, the general trend of the aforementioned components aid in determining the market's development possibilities.

  • Country Level Data:

Various factors that are especially aligned to the country are taken into account to determine the market size for a certain area and country, including the presence of vendors, such as headquarters and offices, the country's GDP, demand patterns, and industry growth. To comprehend the market dynamics for the nation, a number of growth variables, inhibitors, application areas, and current market trends are researched. The aforementioned elements aid in determining the country's overall market's growth potential.

  • Company Profile:

The “Table of Contents” is formulated by listing and analyzing more than 25 - 30 companies operating in the market ecosystem across geographies. However, we profile only 10 companies as a standard practice in our syndicate reports. These 10 companies comprise leading, emerging, and regional players. Nonetheless, our analysis is not restricted to the 10 listed companies, we also analyze other companies present in the market to develop a holistic view and understand the prevailing trends. The “Company Profiles” section in the report covers key facts, business description, products & services, financial information, SWOT analysis, and key developments. The financial information presented is extracted from the annual reports and official documents of the publicly listed companies. Upon collecting the information for the sections of respective companies, we verify them via various primary sources and then compile the data in respective company profiles. The company level information helps us in deriving the base number as well as in forecasting the market size.

  • Developing Base Number:

Aggregation of sales statistics (2020-2022) and macro-economic factor, and other secondary and primary research insights are utilized to arrive at base number and related market shares for 2022. The data gaps are identified in this step and relevant market data is analyzed, collected from paid primary interviews or databases. On finalizing the base year market size, forecasts are developed on the basis of macro-economic, industry and market growth factors and company level analysis.

  1. Data Triangulation and Final Review:

The market findings and base year market size calculations are validated from supply as well as demand side. Demand side validations are based on macro-economic factor analysis and benchmarks for respective regions and countries. In case of supply side validations, revenues of major companies are estimated (in case not available) based on industry benchmark, approximate number of employees, product portfolio, and primary interviews revenues are gathered. Further revenue from target product/service segment is assessed to avoid overshooting of market statistics. In case of heavy deviations between supply and demand side values, all thes steps are repeated to achieve synchronization.

We follow an iterative model, wherein we share our research findings with Subject Matter Experts (SME’s) and Key Opinion Leaders (KOLs) until consensus view of the market is not formulated – this model negates any drastic deviation in the opinions of experts. Only validated and universally acceptable research findings are quoted in our reports.

We have important check points that we use to validate our research findings – which we call – data triangulation, where we validate the information, we generate from secondary sources with primary interviews and then we re-validate with our internal data bases and Subject matter experts. This comprehensive model enables us to deliver high quality, reliable data in shortest possible time.

Your data will never be shared with third parties, however, we may send you information from time to time about our products that may be of interest to you. By submitting your details, you agree to be contacted by us. You may contact us at any time to opt-out.

Related Reports