Marktstrategien für fotoelektrische Sensoren, Top-Player, Wachstumschancen, Analyse und Prognose bis 2028
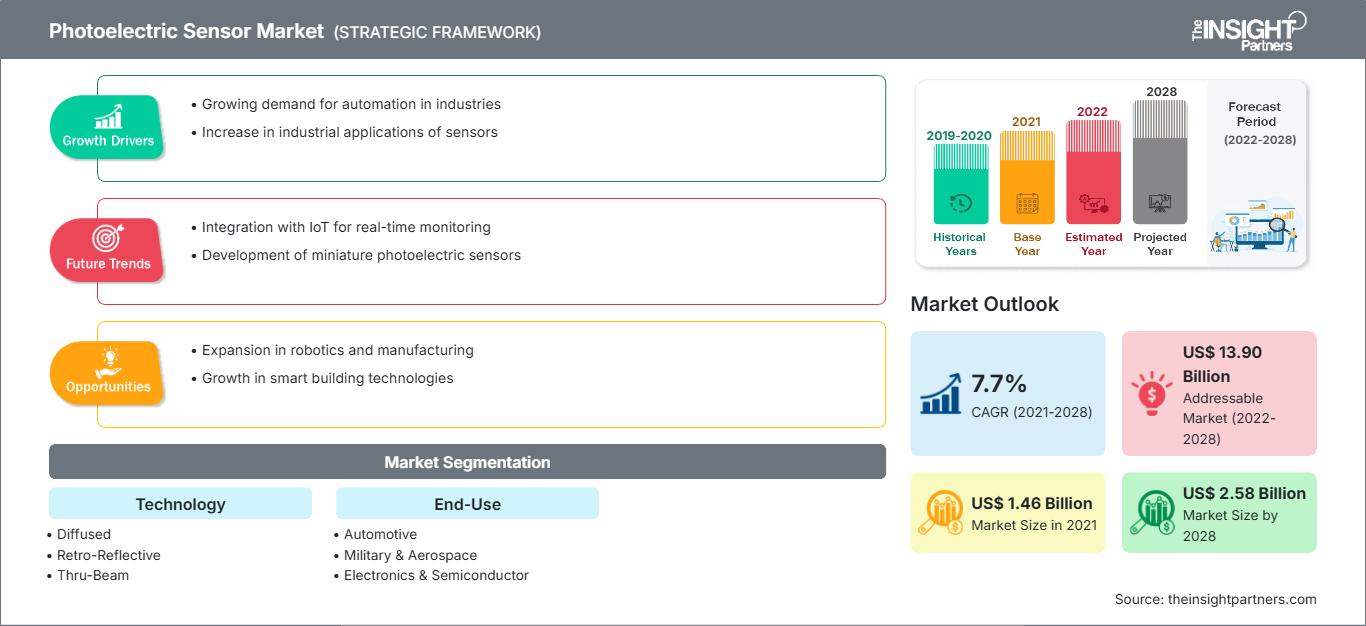
Historische Daten : 2019-2020 | Basisjahr : 2021 | Prognosezeitraum : 2022-2028Marktprognose für fotoelektrische Sensoren bis 2028 – Auswirkungen von Covid-19 und globale Analyse – nach Technologie (diffus, retroreflektierend, Einweglichtschranke); Endanwendung (Automobilindustrie, Militär und Luft- und Raumfahrt, Elektronik und Halbleiter, Verpackung und andere)
- Status : Veröffentlicht
- Berichtscode : TIPRE00003240
- Kategorie : Elektronik und Halbleiter
- Anzahl der Seiten : 155
- Verfügbare Berichtsformate :


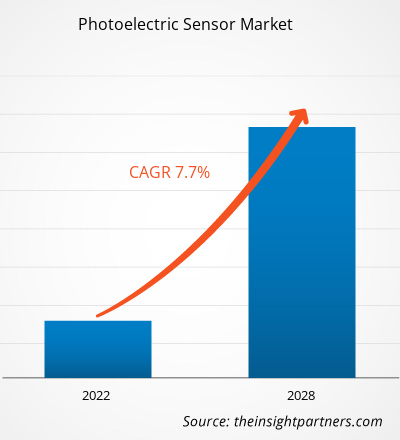
[Forschungsbericht] Der Markt für fotoelektrische Sensoren wurde im Jahr 2021 auf 1.458,23 Millionen US-Dollar geschätzt und soll bis 2028 2.577,56 Millionen US-Dollar erreichen; von 2021 bis 2028 wird ein durchschnittliches jährliches Wachstum von 7,7 % erwartet.
Fotoelektrische Sensoren erfreuen sich aufgrund ihrer hohen Zuverlässigkeit und ihrer Fähigkeit zur Objekterkennung über große Entfernungen hinweg zunehmender Beliebtheit, unabhängig von Größe, Form, Farbe, Material und Oberflächenbeschaffenheit der Objekte. Diese Sensoren sind für den Betrieb unter rauen Bedingungen ausgelegt und verfügen zudem über fortschrittliche Technologien, die eine zuverlässige Unterdrückung unerwünschter Reflexionen gewährleisten. Diese Fähigkeiten machen sie vielseitiger als viele andere Sensortypen und für den industriellen Einsatz geeignet. Beispielsweise erkennen retroreflektierende Sensoren mit Polarisationsfiltern die Position von Wagen beliebiger Form und aus beliebigem Material, die auf den Schienen einer Achterbahn gehalten werden sollen. Darüber hinaus werden fotoelektrische Sensoren aufgrund ihrer hohen Genauigkeit und zuverlässigen Leistung häufig in der Militär- und Luftfahrtindustrie eingesetzt. Sie werden in Frachtflugzeugen zur Rauch- und Branderkennung eingesetzt. Darüber hinaus helfen fotoelektrische Sensoren Flugzeug- und Triebwerksherstellern, Parameter von Luft- und Raumfahrtsystemen wie Druck, Temperatur, Beschleunigung, optische Position und Geschwindigkeit zu überwachen. Auch die Rüstungsindustrie nutzt in großem Umfang biologische Detektionsgeräte, um das Vorhandensein chemischer Substanzen in der Umwelt festzustellen und das Risiko potenzieller biologischer Bedrohungen durch die Erkennung schädlicher biologischer Materialien einzuschätzen, um sowohl Militärangehörige als auch Zivilisten zu schützen. Die Genauigkeit und Zuverlässigkeit des Betriebs von fotoelektrischen Sensoren machen sie daher zu einem bevorzugten Sensortyp unter rauen Industriebedingungen.
Auswirkungen der COVID-19-Pandemie auf den Markt für fotoelektrische Sensoren
Laut dem jüngsten Bericht der Weltgesundheitsorganisation (WHO) gehören die USA, Spanien, Italien, Frankreich, Deutschland, Großbritannien, Russland, die Türkei, Brasilien, der Iran und China zu den am stärksten vom COVID-19-Ausbruch betroffenen Ländern. Das Jahr 2020 hatte erhebliche Folgen für die Weltwirtschaft, und die Auswirkungen dürften auch in den kommenden Jahren anhalten. Der Ausbruch beeinträchtigte wichtige Industriezweige wie die Elektronik-, Halbleiter- und Fertigungsindustrie. Ein starker Wachstumsrückgang in diesen Branchen begrenzt das Wachstum des Marktes für fotoelektrische Sensoren. Fabrikschließungen, Reise- und Handelsverbote sowie Grenzschließungen zur Bekämpfung und Eindämmung der Infektion haben sich negativ auf die Herstellung, die Versorgung und den Vertrieb verschiedener Sensorprodukte ausgewirkt.
Passen Sie diesen Bericht Ihren Anforderungen an
Sie erhalten kostenlos Anpassungen an jedem Bericht, einschließlich Teilen dieses Berichts oder einer Analyse auf Länderebene, eines Excel-Datenpakets sowie tolle Angebote und Rabatte für Start-ups und Universitäten.
Markt für fotoelektrische Sensoren: Strategische Einblicke
-
Holen Sie sich die wichtigsten Markttrends aus diesem Bericht.Dieses KOSTENLOSE Beispiel umfasst Datenanalysen, die von Markttrends bis hin zu Schätzungen und Prognosen reichen.
Hersteller von optischen Sensoren konzentrieren sich auf die Senkung der Betriebskosten, um wettbewerbsfähig zu bleiben. Es wird jedoch erwartet, dass sie ihre Produktion nach dem Lockdown wieder aufnehmen. Regierungsinitiativen zur Ankurbelung der Wirtschaft und Lockerungen der Lockdowns dürften die Nachfrage nach optischen Sensoren im Prognosezeitraum ankurbeln. Die Nachfrage nach optischen Sensoren wird voraussichtlich steigen, da neue Technologien in der Automobil- und Luftfahrtindustrie immer weiter verbreitet sind.
Markteinblicke für optische Sensoren: Steigende Nachfrage nach optischen Sensoren in der Pharmaindustrie treibt Wachstum des Marktes für optische Sensoren an
Pharmaunternehmen konzentrieren sich auf die Verbesserung ihrer gesamten Produktionsabläufe, indem sie Unstimmigkeiten wie leere Verpackungen vermeiden, die durch die Nichtverfügbarkeit von Medikamententabletten in der Produktionslinie entstehen können. Die Branche setzt zunehmend optische Sensoren zum Zählen von Tabletten, zum Befüllen von Flaschen und zur Zählprüfung (in klinischen Studien) ein. Diese Sensoren werden auch in automatisierten Rezeptautomaten in Apotheken und Krankenhäusern verwendet. Weitere Vorteile von photoelektrischen Sensoren sind die Weiterentwicklung ihres Erfassungsbereichs, der ihre Zählgenauigkeit verbessert, sowie die Aufrechterhaltung einer hygienischen Produktionsumgebung durch Ausschluss menschlichen Kontakts beim Verpacken von Medikamenten. Darüber hinaus bieten photoelektrische Sensoren eine kostengünstige Lösung, die durch automatisierte Produktionslinien in der Pharmaindustrie erreicht wird. Der starke Anstieg der Verwendung von photoelektrischen Sensoren in Pharmaunternehmen ist daher hauptsächlich auf ihre Fähigkeit zurückzuführen, die Effizienz zu steigern, die Betriebskosten der Branche zu senken und eine Echtzeit-Produktionsüberwachung zu ermöglichen. Diese Sensoren automatisieren die Messung der oberen und unteren Füllstände von Flüssigkeiten in Gefäßen oder Tanks. Die Verwendung stark ätzender Chemikalien (sauer oder basisch) ist in Pharmaunternehmen üblich und daher ist die Erkennung von Flüssigkeitsständen in Lagertanks eine wichtige Aufgabe in diesen Anlagen. Der zunehmende Einsatz von optischen Sensoren in der Pharmaindustrie wird daher das Marktwachstum für optische Sensoren in den kommenden Jahren vorantreiben.
Technologiebasierte Markteinblicke
Der Markt für optische Sensoren ist technologisch in diffuse, retroreflektierende und Einweglichtschranken unterteilt. Im Jahr 2020 hatte das retroreflektierende Segment den größten Marktanteil.
Endnutzerbasierte Markteinblicke
Der Markt für optische Sensoren ist nach Endnutzern in die Bereiche Automobil, Militär und Luft- und Raumfahrt, Elektronik und Halbleiter, Verpackung und Sonstige unterteilt. Im Jahr 2020 hatte das Automobilsegment den größten Marktanteil.
Die Akteure auf dem Markt für optische Sensoren verfolgen Strategien wie Fusionen, Übernahmen und Marktinitiativen, um ihre Position auf dem Markt zu behaupten. Im Folgenden sind einige Entwicklungen der wichtigsten Akteure aufgeführt:
- Im April 2020 stellte Balluff Photoelectric Sensors Zustandsüberwachungsdaten bereit. Das Portfolio intelligenter Automatisierungs- und Überwachungssysteme (SAMS) umfasst solide fotoelektrische Sensorik, Zustandsüberwachung und fortschrittliche IO-Link-Technologien, die alle Ausfallzeiten verkürzen sollen, indem sie die Fehlerbehebung, Umrüstung und Maschineneinrichtung vereinfachen.
- Im Februar 2020 wurde Eaton Corp plc vom Fortune-Magazin zu den weltweit am meisten bewunderten Unternehmen des Jahres 2020 gezählt.
Fotoelektrischer Sensor
Regionale Einblicke in den Markt für photoelektrische SensorenDie Analysten von The Insight Partners haben die regionalen Trends und Faktoren, die den Markt für fotoelektrische Sensoren im Prognosezeitraum beeinflussen, ausführlich erläutert. In diesem Abschnitt werden auch die Marktsegmente und die geografische Lage in Nordamerika, Europa, dem asiatisch-pazifischen Raum, dem Nahen Osten und Afrika sowie Süd- und Mittelamerika erörtert.
Umfang des Marktberichts zum photoelektrischen Sensor
| Berichtsattribut | Einzelheiten |
|---|---|
| Marktgröße in 2021 | US$ 1.46 Billion |
| Marktgröße nach 2028 | US$ 2.58 Billion |
| Globale CAGR (2021 - 2028) | 7.7% |
| Historische Daten | 2019-2020 |
| Prognosezeitraum | 2022-2028 |
| Abgedeckte Segmente |
By Technologie
|
| Abgedeckte Regionen und Länder |
Nordamerika
|
| Marktführer und wichtige Unternehmensprofile |
|
Dichte der Marktteilnehmer für fotoelektrische Sensoren: Verständnis ihrer Auswirkungen auf die Geschäftsdynamik
Der Markt für fotoelektrische Sensoren wächst rasant. Die steigende Nachfrage der Endverbraucher ist auf Faktoren wie veränderte Verbraucherpräferenzen, technologische Fortschritte und ein stärkeres Bewusstsein für die Produktvorteile zurückzuführen. Mit der steigenden Nachfrage erweitern Unternehmen ihr Angebot, entwickeln Innovationen, um den Bedürfnissen der Verbraucher gerecht zu werden, und nutzen neue Trends, was das Marktwachstum weiter ankurbelt.
- Holen Sie sich die Markt für fotoelektrische Sensoren Übersicht der wichtigsten Akteure
- Diffus
- Reflexions-
- Einweg-
Nach Endbenutzer
- Automobil
- Militär und Luft- und Raumfahrt
- Elektronik und Halbleiter
- Verpackung
- Sonstige
Nach Geografie
- Nordamerika
- USA
- Kanada
- Mexiko
- Europa
- Frankreich
- Deutschland
- Italien
- Großbritannien
- Russland
- Restliches Europa
- Asien-Pazifik (APAC)
- China
- Indien
- Südkorea
- Japan
- Australien
- Rest von APAC
- Naher Osten und Asien Afrika (MEA)
- Südafrika
- Saudi-Arabien
- VAE
- Rest von MEA
- Südamerika (SAM)
- Brasilien
- Argentinien
- Rest von SAM
Firmenprofile
- Autonics Corporation
- Balluff GmbH
- Eaton Corporation plc
- Ifm Electronic GmbH
- Keyence Corporation
- OMRON Corporation
- Rockwell Automation, Inc.
- Panasonic Corporation
- SICK AG
- Schneider Electric SE

Naveen ist ein erfahrener Marktforschungs- und Beratungsexperte mit über 9 Jahren Erfahrung in kundenspezifischen, syndizierten und Beratungsprojekten. In seiner aktuellen Funktion als Associate Vice President hat er erfolgreich Stakeholder entlang der gesamten Projektwertschöpfungskette gemanagt und ist Autor von über 100 Forschungsberichten und über 30 Beratungsaufträgen. Seine Arbeit erstreckt sich auf Industrie- und Regierungsprojekte und trägt maßgeblich zum Kundenerfolg und zur datengesteuerten Entscheidungsfindung bei.
Naveen hat einen Ingenieursabschluss in Elektronik und Kommunikation von der VTU, Karnataka, und einen MBA in Marketing und Operations von der Manipal University. Er ist seit 9 Jahren aktives IEEE-Mitglied und nimmt an Konferenzen und technischen Symposien teil und engagiert sich ehrenamtlich auf Sektions- und regionaler Ebene. Vor seiner aktuellen Position arbeitete er als Associate Strategic Consultant bei IndustryARC und als Industrial Server Consultant bei Hewlett Packard (HP Global).
- Historische Analyse (2 Jahre), Basisjahr, Prognose (7 Jahre) mit CAGR
- PEST- und SWOT-Analyse
- Marktgröße Wert/Volumen – Global, Regional, Land
- Branchen- und Wettbewerbslandschaft
- Excel-Datensatz
Erfahrungsberichte
Der SCADA-Systemmarktbericht von Insight Partners ist umfassend und bietet wertvolle Einblicke in aktuelle Trends und Zukunftsprognosen. Das Team war durchweg hochprofessionell, reaktionsschnell und hilfsbereit. Wir sind sehr zufrieden und können die Dienstleistungen wärmstens empfehlen.
RAN KEDEM Partner, Reali Technologies LTDsIch habe einen Bericht über einen sehr spezifischen Softwaremarkt angefordert, und das Team hat ihn innerhalb weniger Tage erstellt. Die Informationen waren sehr relevant und gut präsentiert. Anschließend habe ich einige Änderungen und Ergänzungen zum Bericht angefordert. Das Team reagierte erneut sehr schnell, und ich erhielt den Abschlussbericht in weniger als einer Woche.
JEAN-HERVE JENN Vorsitzende, Future AnalyticaWir haben mit The Insight Partners für eine wichtige Marktstudie und Prognose zusammengearbeitet. Sie gaben uns klare Einblicke in Chancen und Risiken, die uns bei der Gestaltung unserer Pläne halfen. Ihre Recherchen waren benutzerfreundlich und basierten auf soliden Daten. Sie halfen uns, kluge und sichere Entscheidungen zu treffen. Wir können sie wärmstens empfehlen.
PIYUSH NAGPAL Sr. Vizepräsident, Fernlicht GlobalDie Insight Partners lieferten aufschlussreiche, gut strukturierte Marktforschung mit fundierter Fachkompetenz. Ihr Team war durchweg professionell und reaktionsschnell. Die benutzerfreundliche Website ermöglichte den Zugriff auf Branchenberichte. Wir empfehlen sie wärmstens für zuverlässige und hochwertige Forschungsdienstleistungen.
YUKIHIKO ADACHI Geschäftsführer, Deep Blue, LLC.Dies ist das erste Mal, dass ich einen Marktbericht von The Insight Partners erworben habe. Obwohl ich zunächst unsicher war, besuchte ich die Website und fühlte mich dann sicherer, das Risiko einzugehen und einen Marktbericht zu kaufen. Ich bin mit der Qualität des Berichts und dem Kundenservice rundum zufrieden. Ich hatte einige Fragen und Anmerkungen zum ersten Bericht, aber nach einigen E-Mail-Gesprächen mit dem Analysten bin ich überzeugt, dass ich einen Bericht habe, den ich als Input für unseren strategischen Planungsprozess verwenden kann. Vielen Dank, dass Sie sich die Zeit genommen und dies zu einer positiven Erfahrung gemacht haben. Ich werde Ihren Service auf jeden Fall weiterempfehlen und Sie werden meine erste Anlaufstelle sein, wenn wir weitere Marktdaten benötigen.
JOHN SUZUKI Präsident und Chief Executive Officer, Vorstandsmitglied, BK TechnologiesIch möchte mich für Ihre Unterstützung und die Professionalität bedanken, die Sie bei der Bearbeitung meiner Informationsanfrage zum IVD-Markt für Infektionskrankheiten in Nigeria gezeigt haben. Ich schätze Ihre Geduld, Ihre Beratung und die Tatsache, dass Sie bereit waren, einen Rabatt anzubieten, der uns schließlich den Abschluss eines Geschäfts ermöglichte. Ich freue mich darauf, The Insight Partners in Zukunft wieder zu beauftragen, dank des Eindrucks, den Sie bei dieser ersten Begegnung bei mir hinterlassen haben.
DR. CHIJIOKE ONYIA GESCHÄFTSFÜHRERIN, PineCrest Healthcare Ltd.Grund zum Kauf
- Fundierte Entscheidungsfindung
- Marktdynamik verstehen
- Wettbewerbsanalyse
- Kundeneinblicke
- Marktprognosen
- Risikominimierung
- Strategische Planung
- Investitionsbegründung
- Identifizierung neuer Märkte
- Verbesserung von Marketingstrategien
- Steigerung der Betriebseffizienz
- Anpassung an regulatorische Trends


Exklusive Berichtsrabatte freischalten
Jetzt anfragen


 Kostenlose Probe anfordern für - Markt für fotoelektrische Sensoren