
Photoelectric Sensor Market Growth and Forecast by 2028
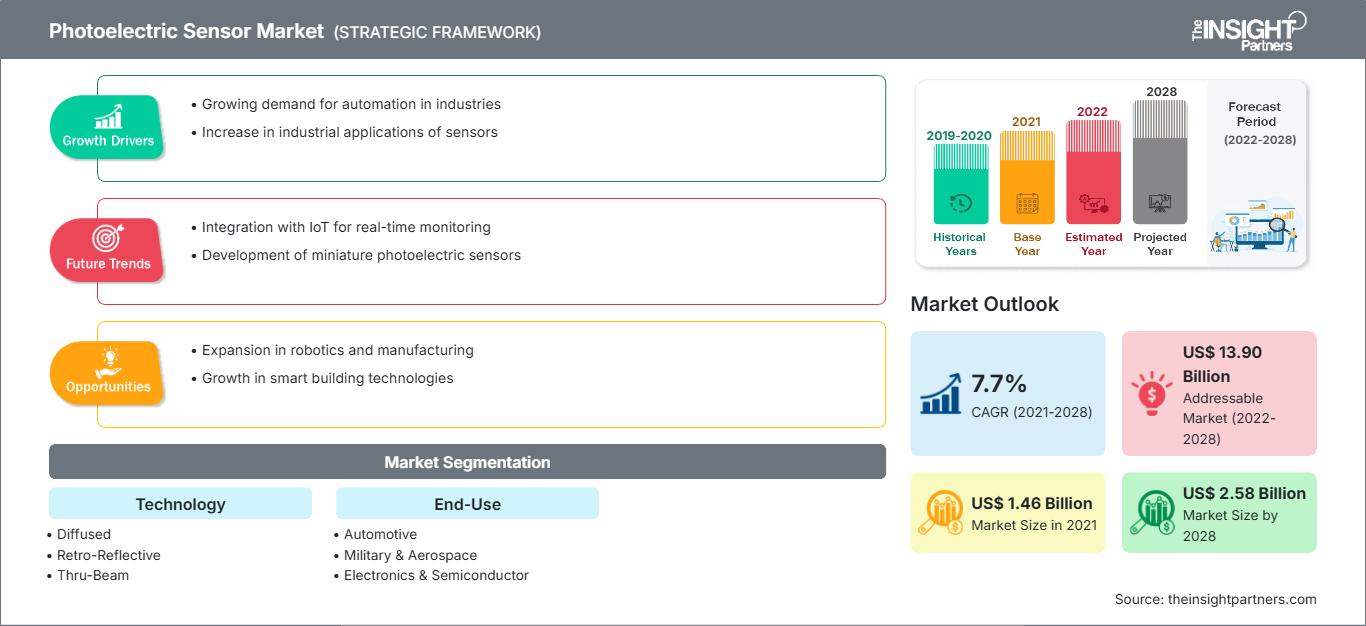
Photoelectric Sensor Market Forecast to 2028 - Analysis - By Technology ( Diffused, Retro-Reflective, Thru-Beam ); End-Use (Automotive, Military & Aerospace, Electronics & Semiconductor, Packaging, and Others)
Historic Data: 2019-2020 | Base Year: 2021 | Forecast Period: 2022-2028- Status : Published
- Report Code : TIPRE00003240
- Category : Electronics and Semiconductor
- No. of Pages : 155
- Available Report Formats :


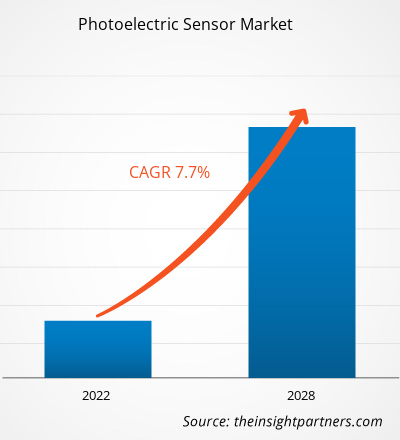
[Research Report] The photoelectric sensor market was valued at US$ 1,458.23 million in 2021 and is projected to reach US$ 2,577.56 million by 2028; it is expected to grow at a CAGR of 7.7% from 2021 to 2028.
Photoelectric sensors are gaining popularity due to their high reliability and long-range object detection capabilities, irrespective of the size, shape, color, material, and surface properties of objects. These sensors are designed to operate under harsh conditions; moreover, they are enabled with advanced technologies to ensure reliable suppression of undesirable reflections. These abilities makes them more versatile than many other sensor types and appropriate for industrial usage. For instance, retro reflective sensors with polarization filters detect the position of carriage of any shape and material, which is to be kept on and off the track of a rollercoaster. Further, photoelectric sensors are widely used in the military and aerospace industries owing to their high accuracy and reliable performance. They are used in cargo aircraft for smoke and fire detection. In addition, photoelectric sensors help airframe and engine manufacturers to monitor aerospace system parameters such as pressure, temperature, acceleration, optical position, and speed. Moreover, the defense industry is extensively using biological detection equipment for detecting the presence of chemical substances in environment and for assessing the risk of potential biological threats by detecting harmful biological materials, to safeguard both military and civilian populations. Thus, the accuracy and reliability of photoelectric sensor operations make them a preferred sensor type in harsh industrial conditions.
Impact of COVID-19 Pandemic on Photoelectric Sensor Market
According to the latest report from the World Health Organization (WHO), the US, Spain, Italy, France, Germany, the UK, Russia, Turkey, Brazil, Iran, and China are among the worst-affected countries due to the COVID-19 outbreak. In 2020, the world economy suffered significant consequences, and the effects are expected to endure to some extent in coming years. The outbreak disrupted primary industries such as electronics, semiconductor, and manufacturing. A sharp decline in the growth of these industries is limiting the growth of the photoelectric sensor market. Factory shutdowns, travel and trade bans, and border lockdowns to combat and contain the infection have negatively impacted manufacturing, supply, and sales of various sensor products.
Market Assessment and Insights
- APAC dominated the market with 37.8% share in 2020.
- APAC is poised to grow at a CAGR of 8.5% over the forecast period.
- United States market is projected to grow at a CAGR of 8.1% over the forecast period.
- By Technology, the Retro-Reflective segment accounted for the largest market share of 52.6% in 2020.
- By End-Use, the Packaging segment is anticipated to witness the fastest growth, registering a CAGR of 8.6% over the forecast period
- The report profiles key industry players such as Schneider Electric SE, Rockwell Automation Inc, Panasonic Holdings Corp, OMRON Corp, Eaton Corporation plc, Keyence Corp, Sick AG, ifm Electronic GmbH, Autonics Corporation, Balluff GmbH, while also analyzing key developments in novel ideas, disruptive products, and innovative services that could reshape the future market and reveal emerging themes across the industry.
Customize This Report To Suit Your Requirement
Get FREE CUSTOMIZATIONPhotoelectric Sensor Market: Strategic Insights
-
Get Top Key Market Trends of this report.This FREE sample will include data analysis, ranging from market trends to estimates and forecasts.
Manufacturers of photoelectric sensors are focusing on lowering operating costs to stay competitive. However, they are expected to resume production activities during the post-lockdown phase. Government initiatives to boost economies and relaxations in the lockdowns are expected to fuel demand for photoelectric sensors during the forecast period. Demand for photoelectric sensors is likely to expand as new technologies become more widely adopted in the automotive and aerospace industries.
Photoelectric Sensor Market Insights
Rising Demand for Photoelectric Sensors in Pharmaceuticals Industry Drives Growth of Photoelectric Sensor Market
Pharmaceutical companies focus on improving their overall manufacturing operations by avoiding discrepancies such as empty packaging, which can be caused due to the unavailability of medicine tablets on the production line. The industry is increasingly deploying photoelectric sensors for tablet counting, bottle filling, and count verification (in clinical trials). These sensors are also being used in automated prescription fulfillment machines at retail pharmacies and hospitals. Further, advancements in photoelectric sensors in terms of their sensing range, which is improving their counting accuracy, along with maintaining a hygienic production environments by excluding human contacts while packaging of medicine are the benefits associated with photoelectric sensors. Also, photoelectric sensor provides a cost-effective solution, which is attained through automatic production line in the pharmaceutical industry. Hence,
the surge in the adoption of photoelectric sensors in pharmaceutical companies is mainly attributed to their abilities to enhance efficiencies, reduce industry’s operational costs, and facilitate real-time production monitoring. These sensors automate the upper and lower levels of liquid measurement in jar or tank. The use of strong corrosive chemicals (acidic or basic) is commonplace in pharmaceutical companies, and thus, the detection of liquid levels in storage tanks is an important task in these plants. Thus, increasing use of photoelectric sensors in the pharmaceuticals industry would drive the photoelectric sensor market growth in the coming years.
Technology-Based Market Insights
Based on technology, the photoelectric sensor market is segmented into diffused, retro-reflective, and thru-beam. In 2020, the retro-reflective segment accounted for the largest share in the market.
End-User Based Market Insights
Based on end-user, the photoelectric sensor market is segmented into automotive, military and aerospace, electronics and semiconductor, packaging, and others. In 2020, the automotive segment accounted for the largest market share.
The players operating in the photoelectric sensor market adopt strategies such as mergers, acquisitions, and market initiatives to maintain their positions in the market. A few developments by key players are listed below:
- In April 2020, Balluff Photoelectric Sensors provided condition monitoring data. The smart automation and monitoring systems (SAMS) portfolio includes solid photoelectric sensing, condition monitoring, and advanced IO-link technologies, all of which are meant to save downtime by making troubleshooting, changeover, and machine setup easier.
- In February 2020, Eaton Corp plc listed among world's most admired company in 2020 by Fortune magazine.
Photoelectric Sensor Market Report Scope
| Report Attribute | Details |
|---|---|
| Market size in 2021 | US$ 1.46 Billion |
| Market Size by 2028 | US$ 2.58 Billion |
| Global CAGR (2021 - 2028) | 7.7% |
| Historical Data | 2019-2020 |
| Forecast period | 2022-2028 |
| Segments Covered |
By Technology
|
| Regions and Countries Covered |
North America
|
| Market leaders and key company profiles |
|
Photoelectric Sensor Market Players Density: Understanding Its Impact on Business Dynamics
The Photoelectric Sensor Market is growing rapidly, driven by increasing end-user demand due to factors such as evolving consumer preferences, technological advancements, and greater awareness of the product's benefits. As demand rises, businesses are expanding their offerings, innovating to meet consumer needs, and capitalizing on emerging trends, which further fuels market growth.
The global photoelectric sensor market has been segmented as mentioned below:
By Technology
- Diffused
- Retro-Reflective
- Thru-Beam
By End-User
- Automotive
- Military and Aerospace
- Electronics and Semiconductor
- Packaging
- Others
By Geography
- North America
- US
- Canada
- Mexico
- Europe
- France
- Germany
- Italy
- UK
- Russia
- Rest of Europe
- Asia Pacific (APAC)
- China
- India
- South Korea
- Japan
- Australia
- Rest of APAC
- Middle East & Africa (MEA)
- South Africa
- Saudi Arabia
- UAE
- Rest of MEA
- South America (SAM)
- Brazil
- Argentina
- Rest of SAM
Company Profiles
- Autonics Corporation
- Balluff GmbH
- Eaton Corporation plc
- Ifm Electronic GmbH
- Keyence Corporation
- OMRON Corporation
- Rockwell Automation, Inc.
- Panasonic Corporation
- SICK AG
- Schneider Electric SE
Frequently Asked Questions

- Historical Analysis (2 Years), Base Year, Forecast (7 Years) with CAGR
- PEST and SWOT Analysis
- Market Size Value / Volume - Global, Regional, Country
- Industry and Competitive Landscape
- Excel Dataset
Recent Reports
Testimonials
The Insight Partners' SCADA System Market report is comprehensive, with valuable insights on current trends and future forecasts. The team was highly professional, responsive, and supportive throughout. We are very satisfied and highly recommend their services.
RAN KEDEM Partner, Reali Technologies LTDsI requested a report on a very specific software market and the team produced the report in a few days. The information was very relevant and well presented. I then requested some changes and additions to the report. The team was again very responsive and I got the final report in less than a week.
JEAN-HERVE JENN Chairman, Future AnalyticaWe worked with The Insight Partners for an important market study and forecast. They gave us clear insights into opportunities and risks, which helped shape our plans. Their research was easy to use and based on solid data. It helped us make smart, confident decisions. We highly recommend them.
PIYUSH NAGPAL Sr. Vice President, High Beam GlobalThe Insight Partners delivered insightful, well-structured market research with strong domain expertise. Their team was professional and responsive throughout. The user-friendly website made accessing industry reports seamless. We highly recommend them for reliable, high-quality research services
YUKIHIKO ADACHI CEO, Deep Blue, LLC.This is the first time I have purchased a market report from The Insight Partners.While I was unsure at first, I visited their web site and felt more comfortable to take the risk and purchase a market report.I am completely satisfied with the quality of the report and customer service. I had several questions and comments with the initial report, but after a couple of dialogs over email with their analyst I believe I have a report that I can use as input to our strategic planning process.Thank you so much for taking the extra time and making this a positive experience.I will definitely recommend your service to others and you will be my first call when we need further market data.
JOHN SUZUKI President and Chief Executive Officer, Board Director, BK TechnologiesI wish to appreciate your support and the professionalism you displayed in the course of attending to my request for information regarding to infectious disease IVD market in Nigeria. I appreciate your patience, your guidance, and the fact that you were willing to offer a discount, which eventually made it possible for us to close a deal. I look forward to engaging The Insight Partners in the future, all thanks to the impression you have created in me as a result of this first encounter.
DR CHIJIOKE ONYIA MANAGING DIRECTOR, PineCrest Healthcare Ltd.Reason to Buy
- Informed Decision-Making
- Understanding Market Dynamics
- Competitive Analysis
- Identifying Emerging Markets
- Customer Insights
- Market Forecasts
- Risk Mitigation
- Boosting Operational Efficiency
- Strategic Planning
- Investment Justification
- Tracking Industry Innovations
- Aligning with Regulatory Trends
Unlock Exclusive Report Discounts
Enquire Now


 Get Free Sample For