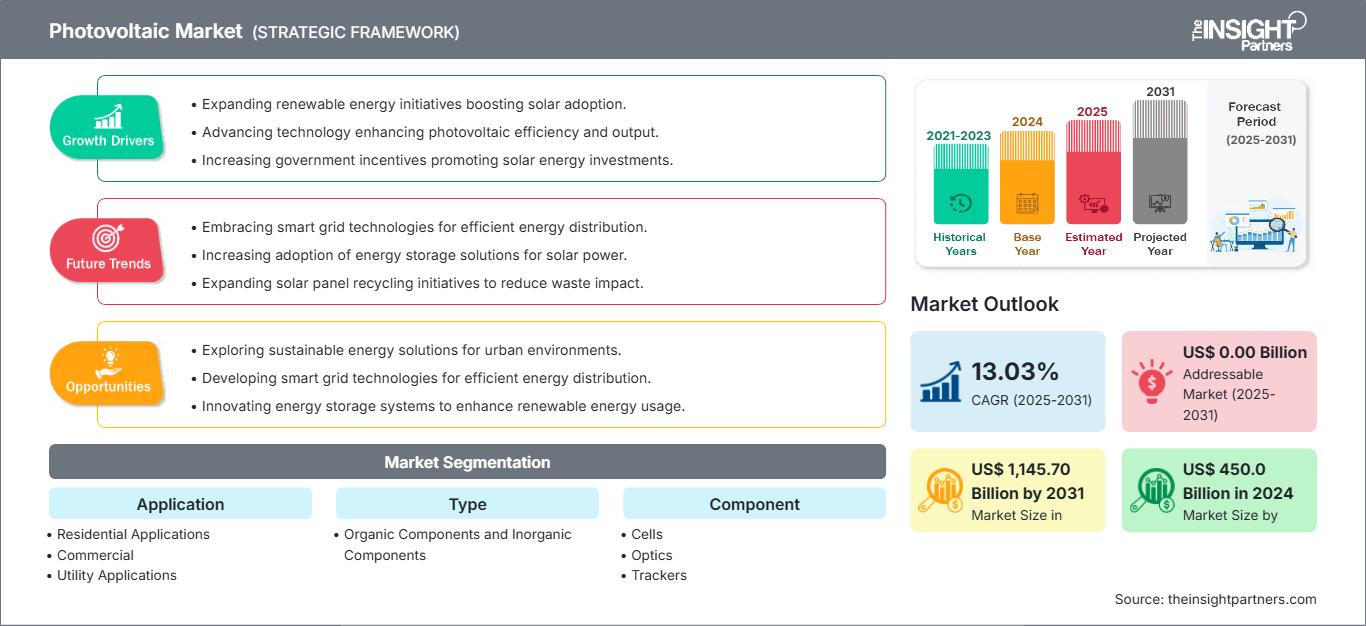
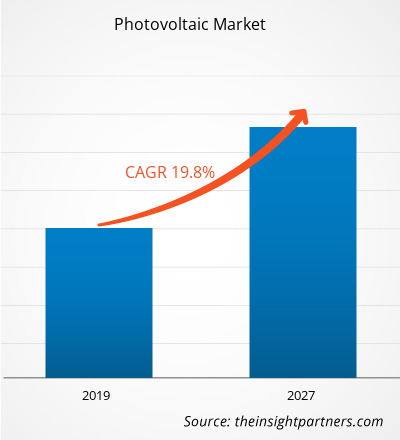
基于(关键地区、市场参与者、规模和份额)的光伏市场 - 到 2031 年的预测

  • Report Code : TIPTE100000386
  • Category : Electronics and Semiconductor
  • Status : Published
  • No. of Pages : 154
Buy Now

光伏市场预计将从 2018 年的 1539 亿美元增长到 2027 年的 7681 亿美元,2019 年至 2027 年的复合年增长率为 19.8%。

随着技术的发展和对太阳能光伏技术日益增长的趋势的关注,德国和西班牙政府建立了强有力的政策框架,例如明确的国家目标、吸引消费的激励措施以及促进技术发展和光伏技术的综合计划太阳能的采用并推动光伏市场的增长。在亚太地区,各国政府已采取多项举措,最大限度地降低整体建设成本,最大限度地发挥农村电气离网方案的深远效益,同时提高对可持续发展的关注环境条件。此外,中国等多个国家也制定了提高光伏太阳能发电水平的政策。因此,上述因素促进了光伏市场的增长。

光伏 (PV) 能源正在快速增长,在全球能源消费中发挥着重要作用。经济电力系统的能量平衡。这些系统已成为主流发电的成熟技术,并推动光伏市场的增长。然而,太阳能光伏系统发电过剩。世界各地的电力提供商提供净计量,其定义是一种将并网可再生能源系统产生的多余电力返回电表的安排。这可以避免浪费并在需要时改善能量分配。与需要电池的独立系统相比,采用电网技术的光伏系统约占装机容量的 99%。无电池并网光伏被认为是一种经济高效的解决方案,并且需要较少的维护,这增加了基于光伏的产品的采用,从而提高了光伏市场份额。

此外,对于转向使用太阳能电池板的人们来说,电网光伏系统被认为是满足其全部电力需求的经济高效的选择。此外,独立系统的安装是一项相当繁琐的任务,并且比光伏并网系统需要更多的资金和空间。因此,光伏并网系统采用的增加将进一步推动光伏市场的增长。此外,随着人们越来越关注可再生能源的使用以及节能的趋势,并网光伏系统被证明是一种经济上可行的选择。然而,其目前的适用性相当有限,未来几年可能会增加。


战略见解

光伏市场利润丰厚的区域供应商

光伏市场洞察

越来越多地使用光伏涂料来开发太阳能

原油价格波动、环境问题与水力发电相关的风险以及与核辐射相关的风险已经将满足能源需求的负担转移到了太阳能上。技术进步、注重降低安装成本以及光伏技术在住宅应用中的快速利用等因素正在重新定义光伏技术的使用。在太阳能使用量增加的时代,太阳能涂料的推出已成为一项了不起的成就。太阳能涂料,或者俗称光伏涂料,可以应用于任何表面,以捕获来自太阳的能量并将其转化为电能。该涂料的成分与悬浮在其中的数十亿颗光敏材料结合在一起,这有助于将典型的涂料转变为超强的能量捕获涂料。使用光伏涂料可以有效降低对金属的依赖,并结合pn结二极管原理/热电效应从太阳照射下产生电能。因此,这将导致太阳能的采用增加,并最终推动光伏市场的增长。 Onyx Solar Group LLC等公司致力于技术开发,专注于研发活动,并与研究机构合作开发光伏涂料,从而推动光伏市场的增长。尽管太阳能涂料或光伏涂料技术目前还处于起步阶段,但它可能会在不久的将来获得关注。随着太阳能行业的进步和进步,太阳能涂料有很好的机会成为一种合理的选择。因此,上述因素正在为光伏市场创造机会。

基于组件的市场洞察

光伏电池由两个或多个组成半导体材料的薄层。光伏电池中最常用的材料是硅。半导体电池暴露在光下产生电荷,这可以通过金属接触作为直流电(DC)进行传导,因此越来越多的光伏电池采用将在预测期内扩大全球光伏市场规模。

< p> 

光伏市场(按组件) 2017年和2025年(%)

光伏市场参与者采取合并、收购和市场举措等策略来维持其在光伏市场的地位。下面列出了主要参与者的一些进展:

  • 2021 年,荷兰皇家壳牌公司 (Royal Dutch Shell PLC) 推出了 25 兆瓦的 Qabas 太阳能设施。该项目由超过 88,000 个太阳能组件组成,位于阿曼北部苏哈尔自由区,占地 50 公顷。它每年有助于减少约 25,000 吨二氧化碳排放。
  • 2021 年,ACWA Power 在 2021 年启动了该国第一个公用事业规模可再生能源项目 300 兆瓦 Sakaka 光伏独立发电厂。成本12亿沙特里亚尔。 ACWA Power 以创世界纪录的每千瓦时 2.3417 美元(8.781 哈拉拉每千瓦时)的电价赢得了该项目。
Report Coverage
Report Coverage

Revenue forecast, Company Analysis, Industry landscape, Growth factors, and Trends

Segment Covered
Segment Covered

This text is related
to segments covered.

Regional Scope
Regional Scope

North America, Europe, Asia Pacific, Middle East & Africa, South & Central America

Country Scope
Country Scope

This text is related
to country scope.

Frequently Asked Questions


By Type, which was the leading segment to hold the largest share in the market and by what CAGR?

The leading type of photovoltaic type is inorganic components that has noted to account a CAGR of 22.3%. Organic components or solar cells are made of thin films of organic semiconducting materials so as to convert solar energy into electrical energy. A typical organic components device consists of one or more photoactive materials between two electrodes. A primary advantage of organic components technology over inorganic components is its ability to be applied in a large area and flexible solar modules.

Which was the region to account the largest share for the Photovoltaic market?

The Asia Pacific region led the photovoltaic market with a market share of 52.13%in 2018. Solar energy has brought significant changes to energy usage pattern, from being an alternative source of energy to becoming a primary source of energy for power generation. It is quite evitable with the growing research and development activities focused on the increased production of solar energy, coupled with positive government initiatives and decreasing costs of photovoltaic equipment, in the Asian countries. Further, the diversification in the use of solar energy generation techniques by harnessing various technologies such as PV cell, thermal heating, and concentrated solar power technology is also leading to the growth of this industry.

What is the major driving factor to favor the 3D sensor market all over the globe?

Renewable energy is regarded as a clean form of energy obtained from natural sources, which can be continuously replenished. Energy derived from renewable sources such as sunlight, wind, tides, and geothermal heat are sustainable and cost-effective. With the increase in population coupled with a rise in industrialization and economic development, the energy requirements have grown consistently, which is posing a burden upon natural resources. For instance, in the US, about 29% of global warming emissions are contributed to the electricity sector. Such emissions are resulted from the utilization of fossil fuels such as coal and natural gas. Over-exploitation and depletion of natural resources along with environmental degradation have led to a shift over renewable forms of energy. The demand for electricity is associated with social and economic development that generates a requirement to shift to renewables in order to tackle climate change and promote sustainability of the environment while meeting energy demands of future generations. Renewable forms of energy generate little or no global warming emissions.

The List of Companies

  1. Mitsubishi Electric Corporation
  2. Panasonic Corporation
  3. Kaneka Corporation
  4. KYOCERA Corporation
  5. Sharp Corporation
  6. JA Solar Co.,Ltd.
  7. Renesola Co. Ltd
  8. Trina Solar
  9. Jinko Solar
  10. Shunfeng International Clean Energy Co., Ltd.

The Insight Partners performs research in 4 major stages: Data Collection & Secondary Research, Primary Research, Data Analysis and Data Triangulation & Final Review.

  1. Data Collection and Secondary Research:

As a market research and consulting firm operating from a decade, we have published and advised several client across the globe. First step for any study will start with an assessment of currently available data and insights from existing reports. Further, historical and current market information is collected from Investor Presentations, Annual Reports, SEC Filings, etc., and other information related to company’s performance and market positioning are gathered from Paid Databases (Factiva, Hoovers, and Reuters) and various other publications available in public domain.

Several associations trade associates, technical forums, institutes, societies and organization are accessed to gain technical as well as market related insights through their publications such as research papers, blogs and press releases related to the studies are referred to get cues about the market. Further, white papers, journals, magazines, and other news articles published in last 3 years are scrutinized and analyzed to understand the current market trends.

  1. Primary Research:

The primarily interview analysis comprise of data obtained from industry participants interview and answers to survey questions gathered by in-house primary team.

For primary research, interviews are conducted with industry experts/CEOs/Marketing Managers/VPs/Subject Matter Experts from both demand and supply side to get a 360-degree view of the market. The primary team conducts several interviews based on the complexity of the markets to understand the various market trends and dynamics which makes research more credible and precise.

A typical research interview fulfils the following functions:

  • Provides first-hand information on the market size, market trends, growth trends, competitive landscape, and outlook
  • Validates and strengthens in-house secondary research findings
  • Develops the analysis team’s expertise and market understanding

Primary research involves email interactions and telephone interviews for each market, category, segment, and sub-segment across geographies. The participants who typically take part in such a process include, but are not limited to:

  • Industry participants: VPs, business development managers, market intelligence managers and national sales managers
  • Outside experts: Valuation experts, research analysts and key opinion leaders specializing in the electronics and semiconductor industry.

Below is the breakup of our primary respondents by company, designation, and region:

Research Methodology

Once we receive the confirmation from primary research sources or primary respondents, we finalize the base year market estimation and forecast the data as per the macroeconomic and microeconomic factors assessed during data collection.

  1. Data Analysis:

Once data is validated through both secondary as well as primary respondents, we finalize the market estimations by hypothesis formulation and factor analysis at regional and country level.

  • Macro-Economic Factor Analysis:

We analyse macroeconomic indicators such the gross domestic product (GDP), increase in the demand for goods and services across industries, technological advancement, regional economic growth, governmental policies, the influence of COVID-19, PEST analysis, and other aspects. This analysis aids in setting benchmarks for various nations/regions and approximating market splits. Additionally, the general trend of the aforementioned components aid in determining the market's development possibilities.

  • Country Level Data:

Various factors that are especially aligned to the country are taken into account to determine the market size for a certain area and country, including the presence of vendors, such as headquarters and offices, the country's GDP, demand patterns, and industry growth. To comprehend the market dynamics for the nation, a number of growth variables, inhibitors, application areas, and current market trends are researched. The aforementioned elements aid in determining the country's overall market's growth potential.

  • Company Profile:

The “Table of Contents” is formulated by listing and analyzing more than 25 - 30 companies operating in the market ecosystem across geographies. However, we profile only 10 companies as a standard practice in our syndicate reports. These 10 companies comprise leading, emerging, and regional players. Nonetheless, our analysis is not restricted to the 10 listed companies, we also analyze other companies present in the market to develop a holistic view and understand the prevailing trends. The “Company Profiles” section in the report covers key facts, business description, products & services, financial information, SWOT analysis, and key developments. The financial information presented is extracted from the annual reports and official documents of the publicly listed companies. Upon collecting the information for the sections of respective companies, we verify them via various primary sources and then compile the data in respective company profiles. The company level information helps us in deriving the base number as well as in forecasting the market size.

  • Developing Base Number:

Aggregation of sales statistics (2020-2022) and macro-economic factor, and other secondary and primary research insights are utilized to arrive at base number and related market shares for 2022. The data gaps are identified in this step and relevant market data is analyzed, collected from paid primary interviews or databases. On finalizing the base year market size, forecasts are developed on the basis of macro-economic, industry and market growth factors and company level analysis.

  1. Data Triangulation and Final Review:

The market findings and base year market size calculations are validated from supply as well as demand side. Demand side validations are based on macro-economic factor analysis and benchmarks for respective regions and countries. In case of supply side validations, revenues of major companies are estimated (in case not available) based on industry benchmark, approximate number of employees, product portfolio, and primary interviews revenues are gathered. Further revenue from target product/service segment is assessed to avoid overshooting of market statistics. In case of heavy deviations between supply and demand side values, all thes steps are repeated to achieve synchronization.

We follow an iterative model, wherein we share our research findings with Subject Matter Experts (SME’s) and Key Opinion Leaders (KOLs) until consensus view of the market is not formulated – this model negates any drastic deviation in the opinions of experts. Only validated and universally acceptable research findings are quoted in our reports.

We have important check points that we use to validate our research findings – which we call – data triangulation, where we validate the information, we generate from secondary sources with primary interviews and then we re-validate with our internal data bases and Subject matter experts. This comprehensive model enables us to deliver high quality, reliable data in shortest possible time.

Your data will never be shared with third parties, however, we may send you information from time to time about our products that may be of interest to you. By submitting your details, you agree to be contacted by us. You may contact us at any time to opt-out.

Related Reports