Análisis y pronóstico del mercado fotovoltaico por tamaño, participación, crecimiento y tendencias para 2027
Datos históricos : | Año base : | Período de pronóstico :Análisis y pronósticos del mercado fotovoltaico por tamaño, participación, crecimiento y tendencias para 2027
- Estado : Publicada
- Código de informe : TIPTE100000386
- Categoría : Electrónica y semiconductores
- Número de páginas : 154
- Formatos de informe disponibles :


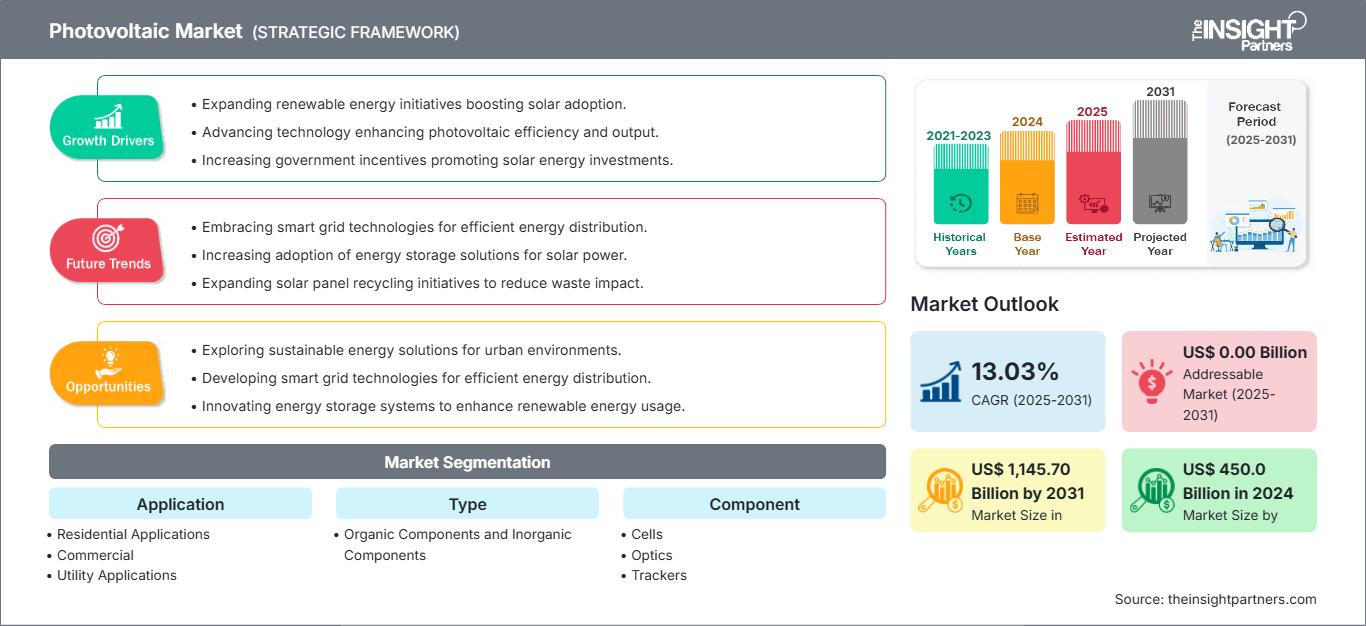
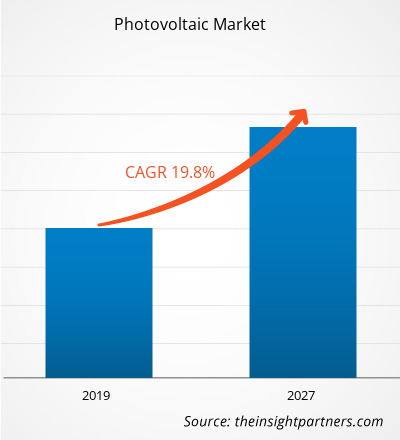
Se proyecta que el tamaño del mercado fotovoltaico alcance los 1.145.70 mil millones de dólares estadounidenses para 2031, desde los 450.000 millones de dólares estadounidenses en 2024. Se espera que el mercado registre una CAGR del 13,03 % durante el período 2025-2031.
A raíz del desarrollo tecnológico y el enfoque hacia una tendencia creciente de la tecnología solar fotovoltaica, los gobiernos alemán y español han establecido marcos de políticas sólidos, como objetivos nacionales claros, incentivos atractivos para promover el consumo y planes integrados para impulsar el desarrollo tecnológico y la adopción de la tecnología fotovoltaica en energía solar e impulsar el crecimiento del mercado fotovoltaico. En APAC, los gobiernos han tomado varias iniciativas para minimizar el costo de la instalación general y maximizar los beneficios de largo alcance de una opción fuera de la red en la electrificación rural, junto con un mayor enfoque hacia condiciones ambientales sostenibles. Además, varios países, como China, han establecido políticas para mejorar el nivel de producción de energía solar fotovoltaica. Por lo tanto, los factores mencionados anteriormente están contribuyendo al crecimiento del mercado fotovoltaico.
La energía fotovoltaica (FV) crece a un ritmo acelerado, contribuyendo significativamente al balance energético de los sistemas eléctricos de la economía. Estos sistemas se han consolidado como una tecnología consolidada utilizada para la generación de electricidad general e impulsan el crecimiento del mercado fotovoltaico. Sin embargo, los sistemas fotovoltaicos de energía solar generan un exceso de electricidad. Los proveedores de energía de todo el mundo ofrecen medición neta, un sistema mediante el cual el exceso de electricidad producida por los sistemas de energía renovable conectados a la red eléctrica se devuelve al contador. Esto evita el desperdicio y mejora la distribución de energía cuando es necesario. Los sistemas fotovoltaicos que utilizan tecnología de red eléctrica representan aproximadamente el 99 % de la capacidad instalada, en comparación con los sistemas autónomos, que requieren baterías. La energía fotovoltaica conectada a la red eléctrica sin baterías se considera una solución rentable y requiere menos mantenimiento, lo que aumenta la adopción de productos fotovoltaicos y, por lo tanto, impulsa la cuota de mercado de la energía fotovoltaica.
Además, para quienes optan por paneles solares, los sistemas fotovoltaicos conectados a la red se consideran una opción rentable para satisfacer todas sus necesidades eléctricas. Además, la instalación de sistemas autónomos es una tarea bastante tediosa y requiere más capital y espacio que la de los sistemas fotovoltaicos conectados a la red. Por lo tanto, el aumento en la adopción de sistemas fotovoltaicos conectados a la red impulsará aún más el crecimiento del mercado fotovoltaico. Asimismo, con el creciente enfoque en el uso de energías renovables y la tendencia hacia la conservación energética, los sistemas fotovoltaicos conectados a la red resultan ser una opción económicamente viable. Sin embargo, su aplicabilidad es bastante limitada por el momento y podría aumentar en los próximos años.
Obtendrá personalización en cualquier informe, sin cargo, incluidas partes de este informe o análisis a nivel de país, paquete de datos de Excel, así como también grandes ofertas y descuentos para empresas emergentes y universidades.
Mercado fotovoltaico: Perspectivas estratégicas
-
Obtenga las principales tendencias clave del mercado de este informe.Esta muestra GRATUITA incluirá análisis de datos, desde tendencias del mercado hasta estimaciones y pronósticos.
Perspectivas del mercado fotovoltaico:
Aumento del uso de pinturas fotovoltaicas para aprovechar la energía solar
La volatilidad de los precios del petróleo crudo, las preocupaciones ambientales relacionadas con la energía hidroeléctrica y el riesgo asociado a la radiación nuclear han desplazado la carga de satisfacer la demanda energética hacia la energía solar. Los avances tecnológicos, la prioridad en la reducción de costos de instalación y la rápida utilización de la tecnología fotovoltaica en aplicaciones residenciales se encuentran entre los factores que están redefiniendo su uso. En la era del creciente uso de la energía solar, la introducción de pinturas solares se ha convertido en un logro notable. Las pinturas solares, o popularmente conocidas como pinturas fotovoltaicas, pueden aplicarse a cualquier superficie para captar la energía del sol y convertirla en electricidad. Los componentes de la pintura se combinan con miles de millones de partículas de material fotosensible suspendidas en ella, lo que podría ayudar a transformar una pintura típica en una pintura con una capacidad de captura de energía superior. El uso de pintura fotovoltaica puede reducir eficazmente la dependencia del metal y una combinación del principio del diodo de unión pn y el efecto termoeléctrico para producir energía eléctrica a partir de la exposición solar. Por lo tanto, esto conducirá a un aumento en la adopción de la energía solar y, con el tiempo, impulsará el crecimiento del mercado fotovoltaico. Empresas como Onyx Solar Group LLC apuntan al desarrollo tecnológico, centrándose en actividades de I+D y colaborando con institutos para desarrollar pinturas fotovoltaicas e impulsar así el crecimiento del mercado. Si bien las pinturas solares o la tecnología de pinturas fotovoltaicas se encuentran actualmente en una etapa incipiente, es probable que cobren impulso en un futuro próximo. Con el progreso de la industria solar, la pintura solar tiene una excelente oportunidad de convertirse en una opción viable. Por lo tanto, los factores mencionados anteriormente están creando una oportunidad para el mercado fotovoltaico.
Perspectivas regionales del mercado fotovoltaico
Los analistas de The Insight Partners han explicado detalladamente las tendencias regionales y los factores que influyen en el mercado fotovoltaico durante el período de pronóstico. Esta sección también analiza los segmentos y la geografía del mercado fotovoltaico en Norteamérica, Europa, Asia Pacífico, Oriente Medio y África, y Sudamérica y Centroamérica.
Alcance del informe del mercado fotovoltaico
| Atributo del informe | Detalles |
|---|---|
| Tamaño del mercado en | US$ 1.145,70 mil millones para 2031 |
| Tamaño del mercado por | US$ 450.000 millones en 2024 |
| CAGR global (2025-2031) | 13,03% |
| Datos históricos | 2021-2023 |
| Período de pronóstico | 2025-2031 |
| Segmentos cubiertos |
Por aplicación
|
| Regiones y países cubiertos |
América del norte
|
| Líderes del mercado y perfiles de empresas clave |
|
Densidad de actores del mercado fotovoltaico: comprensión de su impacto en la dinámica empresarial
El mercado fotovoltaico está creciendo rápidamente, impulsado por la creciente demanda del usuario final debido a factores como la evolución de las preferencias del consumidor, los avances tecnológicos y una mayor conciencia de los beneficios del producto. A medida que aumenta la demanda, las empresas amplían su oferta, innovan para satisfacer las necesidades del consumidor y aprovechan las tendencias emergentes, lo que impulsa aún más el crecimiento del mercado.
- Obtenga una descripción general de los principales actores clave del mercado fotovoltaico
Perspectivas del mercado basadas en componentes
Las células fotovoltaicas constan de dos o más capas delgadas de material semiconductor. El material más utilizado en las células fotovoltaicas es el silicio. Las células semiconductoras se exponen a la luz para generar cargas eléctricas, que pueden ser conducidas por contactos metálicos como corriente continua (CC). Por lo tanto, la creciente adopción de células fotovoltaicas incrementará el tamaño del mercado fotovoltaico mundial durante el período de pronóstico.
Los actores del mercado fotovoltaico adoptan estrategias como fusiones, adquisiciones e iniciativas de mercado para mantener su posición en el mercado. A continuación, se enumeran algunos avances de los actores clave:
- En 2021, Royal Dutch Shell PLC inauguró su planta solar Qabas de 25 megavatios. El proyecto, compuesto por más de 88.000 módulos solares, se ubica en un terreno de 50 hectáreas en la Zona Franca de Sohar, al norte de Omán. Contribuye a la reducción de aproximadamente 25.000 toneladas métricas de emisiones de CO2 al año.
- En 2021, ACWA Power inauguró el proyecto fotovoltaico independiente Sakaka de 300 MW, el primer proyecto de energía renovable a escala comercial del país, con un coste de 1200 millones de SAR. ACWA Power se adjudicó el proyecto con una tarifa récord mundial de 2,3417 centavos de dólar estadounidense por kWh (8,781 halalas por kWh).

Naveen es un experimentado profesional en investigación de mercados y consultoría con más de 9 años de experiencia en proyectos personalizados, sindicados y de consultoría. Actualmente se desempeña como Vicepresidente Asociado, donde ha gestionado con éxito a las partes interesadas en toda la cadena de valor del proyecto y ha redactado más de 100 informes de investigación y más de 30 proyectos de consultoría. Su trabajo abarca proyectos industriales y gubernamentales, contribuyendo significativamente al éxito de los clientes y a la toma de decisiones basada en datos.
Naveen es licenciado en Ingeniería Electrónica y Comunicaciones por la VTU (Karnataka) y tiene un MBA en Marketing y Operaciones por la Universidad de Manipal. Ha sido miembro activo del IEEE durante 9 años, participando en conferencias, simposios técnicos y realizando voluntariado tanto a nivel de sección como regional. Antes de su puesto actual, trabajó como Consultor Estratégico Asociado en IndustryARC y como Consultor de Servidores Industriales en Hewlett Packard (HP Global).
- Análisis histórico (2 años), año base, pronóstico (7 años) con CAGR
- Análisis PEST y FODA
- Tamaño del mercado, valor/volumen: global, regional y nacional
- Industria y panorama competitivo
- Conjunto de datos de Excel
Testimonios
El informe de mercado de sistemas SCADA de Insight Partners es completo y ofrece información valiosa sobre las tendencias actuales y las previsiones futuras. El equipo fue altamente profesional, receptivo y me brindó un gran apoyo en todo momento. Estamos muy satisfechos y recomendamos ampliamente sus servicios.
RAN KEDEM Socio, Reali Technologies LTDsSolicité un informe sobre un mercado de software muy específico y el equipo lo elaboró en pocos días. La información era muy relevante y estaba bien presentada. Posteriormente, solicité algunos cambios y adiciones al informe. El equipo fue muy receptivo y recibí el informe final en menos de una semana.
JEAN-HERVE JENN Presidente, Future AnalyticaTrabajamos con The Insight Partners para un importante estudio y pronóstico de mercado. Nos brindaron una visión clara de las oportunidades y los riesgos, lo que nos ayudó a definir nuestros planes. Su investigación fue fácil de usar y se basó en datos sólidos. Nos ayudó a tomar decisiones inteligentes y seguras. Los recomendamos ampliamente.
PIYUSH NAGPAL Vicepresidente Sénior, , High Beam GlobalThe Insight Partners realizó una investigación de mercado profunda y bien estructurada con una sólida experiencia en el sector. Su equipo fue profesional y receptivo en todo momento. El sitio web, fácil de usar, facilitó el acceso a los informes del sector. Los recomendamos ampliamente por sus servicios de investigación confiables y de alta calidad.
YUKIHIKO ADACHI Director Ejecutivo, , Deep Blue, LLCEsta es la primera vez que compro un informe de mercado de The Insight Partners. Aunque al principio tenía dudas, visité su sitio web y me sentí más cómodo al arriesgarme y comprarlo. Estoy completamente satisfecho con la calidad del informe y el servicio al cliente. Tenía varias preguntas y comentarios sobre el informe inicial, pero después de un par de conversaciones por correo electrónico con su analista, creo que tengo un informe que puedo usar como base para nuestro proceso de planificación estratégica. Muchas gracias por tomarse el tiempo y hacer de esta una experiencia positiva. Sin duda, recomendaré sus servicios y serán mi primera opción cuando necesitemos más datos de mercado.
JOHN SUZUKI Presidente y Director Ejecutivo, Director de la Junta Directiva, BK TechnologiesAgradezco su apoyo y la profesionalidad que demostraron al atender mi solicitud de información sobre el mercado de diagnóstico in vitro (IVD) para enfermedades infecciosas en Nigeria. Agradezco su paciencia, su orientación y su disposición a ofrecerme un descuento, lo que finalmente nos permitió cerrar un trato. Espero poder colaborar con The Insight Partners en el futuro, gracias a la impresión que me causó este primer encuentro.
DRA. CHIJIOKE ONYIA, DIRECTORA GENERAL, PineCrest Healthcare Ltd.Razón para comprar
- Toma de decisiones informada
- Comprensión de la dinámica del mercado
- Análisis competitivo
- Información sobre clientes
- Pronósticos del mercado
- Mitigación de riesgos
- Planificación estratégica
- Justificación de la inversión
- Identificación de mercados emergentes
- Mejora de las estrategias de marketing
- Impulso de la eficiencia operativa
- Alineación con las tendencias regulatorias


Desbloquea descuentos exclusivos en informes
Consultar ahora


 Obtenga una muestra gratuita para - Mercado fotovoltaico