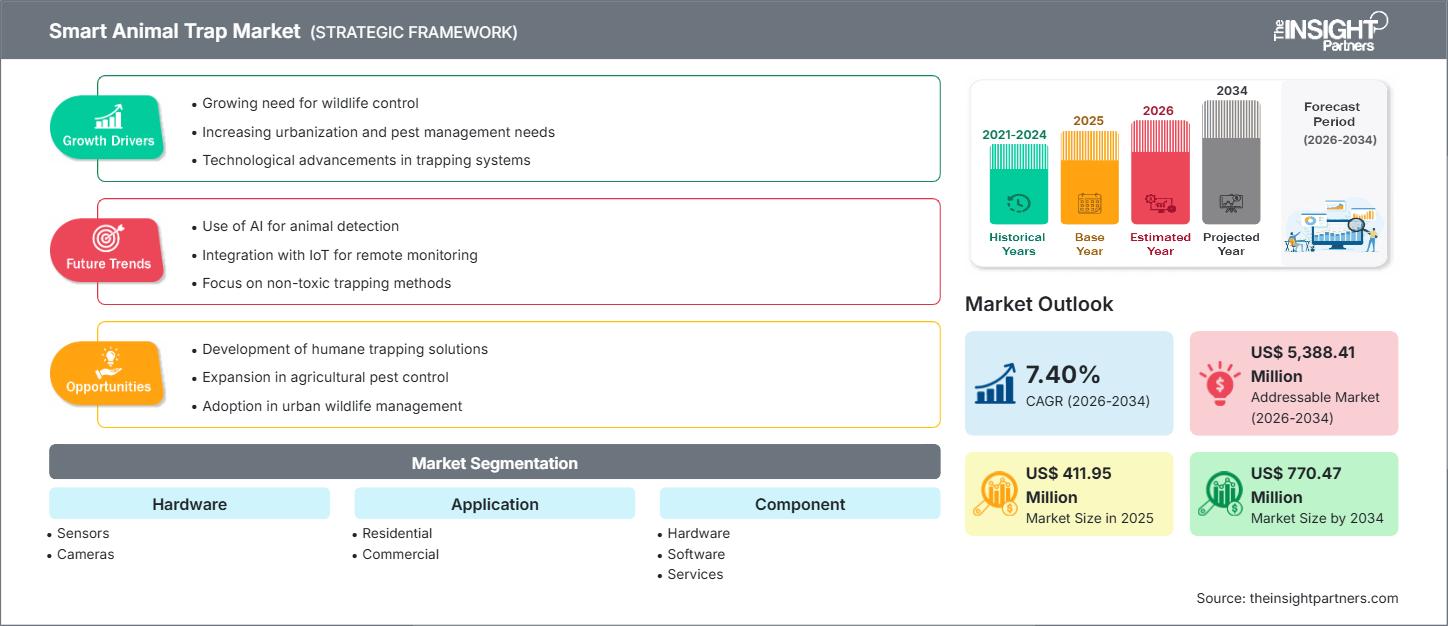
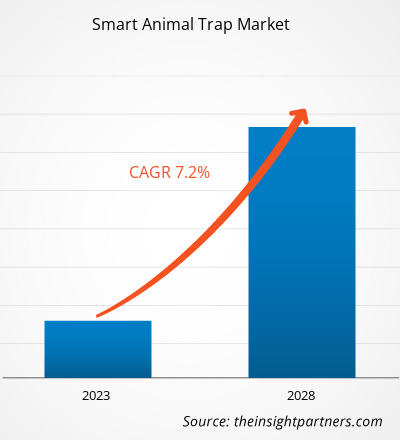
智能动物陷阱市场基于(主要地区、市场参与者、规模和份额)- 预测至 2028 年

  • Report Code : TIPRE00029508
  • Category : Electronics and Semiconductor
  • Status : Published
  • No. of Pages : 164
Buy Now

Smart Animal Trap Market Size, Share And Growth analysis

Buy Now


智能动物陷阱市场预计将从 2022 年的 3.3436 亿美元增长到 2028 年的 5.0756 亿美元。预计从 2022 年到 2028 年的复合年增长率为 7.2%。

野猪、鹿、浣熊和其他动物会毁坏庄稼,野生动物造成的破坏会打击农民的积极性。智能动物陷阱旨在使最终用户能够远程捕捉动物,用于各种目的,如食物、皮毛贸易、狩猎、病虫害防治和野生动物管理。这些系统内置的传感器使它们能够检测到危险动物的捕获。然后,系统通过 GPS 和无线连接向远程管理员发出警报。安装在某个区域的所有陷阱的状态都可以绘制并显示在地图上,并且可以将该状态通知给已注册的电子邮件地址。该技术使猎人能够直接前往捕获危险动物的地点。

此外,根据欧盟栖息地和鸟类指令,欧盟国家对 Natura 2000 网络内许多物种(特别是稀有和濒危物种)的主要繁殖和栖息地点的保护制定了严格的规则。他们还在 27 个欧盟成员国中设立了用于物理保护个体标本的区域。欧盟还制定了动物护理指南,并与其他国家合作,以防止全球范围内的非法野生动物贸易。因此,野生动物饲养员有必要对这些动物进行适当的监控,这增加了欧洲对智能动物陷阱的需求。

欧洲有 504 个国家公园。俄罗斯拥有 48 个国家公园,总面积为 141,200 平方公里,是该地区国家公园数量最多的国家。紧随俄罗斯之后的是芬兰、瑞典、挪威、土耳其和法国,分别拥有 40、30、47、43 和 30 个国家公园。此外,法国的国家公园总面积位居第二。法国的 10 个国家公园占地 60,728 平方公里。国家公园保护了法国总土地面积的 9.5%,仅次于冰岛(12.1%)。由于面积如此广阔,这些公园管理员需要密切关注动物的健康状况,以跟上不断增长的游客数量,这有利于智能动物陷阱市场的增长。

定制研究以满足您的需求

我们可以优化和定制标准产品无法满足的分析和范围。这种灵活性将帮助您获得业务规划和决策所需的准确信息。

智能动物陷阱市场:

Smart Animal Trap Market: Strategic Insights

Smart Animal Trap Market

  • CAGR (2022 - 2028)
    7.2%
  • Market Size 2022
    US$ 334.36 Million
  • Market Size 2028
    US$ 507.56 Million

Market Dynamics

GROWTH DRIVERS
  • XXXXXXX
  • XXXXXXX
  • XXXXXXX
FUTURE TRENDS
  • XXXXXXX
  • XXXXXXX
  • XXXXXXX
OPPORTUNITIES
  • XXXXXXX
  • XXXXXXX
  • XXXXXXX

Key Players

  • Trapmaster
  • AlertHouse ApS (Minkpolice)
  • Revier Manager
  • Wildmelder
  • Skyhawk
  • CatchAlive ApS
  • Encounter Solutions Ltd.
  • Econode Ltd.
  • Wildlife Dominion Management LLC. (HogEye)

Regional Overview

  • 北美(美国、加拿大、墨西哥)
  • 欧洲(英国、德国、法国、俄罗斯、意大利、欧洲其他地区)
  • 亚太地区(中国、印度、日本、澳大利亚、亚太地区其他地区)
  • 南美洲和中美洲(巴西、阿根廷、南美洲和中美洲其他地区)
  • 中东和非洲(南非、沙特阿拉伯、阿联酋、中东和非洲其他地区)

Market Segmentation

硬件(传感器、摄像头等)
    应用(住宅及商业)
      组件(硬件、软件和服务)

        智能动物陷阱市场

        • 复合年增长率(2022 - 2028)
          7.2%
        • 2022 年市场规模
          3.3436 亿美元
        • 市场规模 2028 年
          5.0756 亿美元

        市场动态

        增长动力
        • 財政部
        • 財政部
        • 財政部
        未来的趋势
        • 財政部
        • 財政部
        • 財政部
        机会
        • 財政部
        • 財政部
        • 財政部

        关键人物;主力;重要一员

        •  
        • 陷阱大师
        • AlertHouse ApS(Minkpolice)
        • 审阅经理
        • 野蛮熔炼者
        • 天鹰
        • CatchAlive ApS
        • 遭遇解决方案有限公司
        • Econode 有限公司
        • 野生动物统治管理有限责任公司 (HogEye)

        区域概况

        • 北美
        • 欧洲
        • 亚太
        • 南美洲和中美洲
        • 中东和非洲

        市场细分

        硬件
        • 传感器
        • 相机
        • 其他的
        应用
        • 住宅和商业
        成分
        • 硬件
        • 软件
        • 服务
        • 示例 PDF 通过定性和定量分析展示了内容结构和信息的性质。

        - 智能动物陷阱市场


        COVID-19 疫情对智能动物陷阱市场的影响

        印度、中国和日本拥有许多电子设施和智能动物陷阱市场的最终用户。2021 年底,尽管 COVID-19 病例不断增加,但这些国家已经放松了遏制标准。随着中国 COVID-19 病例的增加,一些工厂仍在运营,但无法满足需求。根据经济合作与发展组织 (OECD) 的数据,疫情严重影响了印度、澳大利亚、中国和日本等国家。印度是该地区受疫情影响最严重的国家。在危机初期,各国政府为控制 COVID-19 蔓延而实施的限制,由于劳动力有限,影响了这些国家的生产过程,从而阻碍了 2020 年智能动物陷阱市场的增长。


        市场洞察 - 智能动物陷阱市场

        北美占据智能动物陷阱市场的最大份额。对家畜的需求不断增长、随着可支配收入的增加,宠物的快速增长、宠物护理产品的增加以及动物疾病的日益流行,都是支持该地区智能动物陷阱市场扩张的因素。近年来,尤其是在加拿大爆发 COVID-19 疫情之后,宠物收养数量显著增加。北美野生动物保护模式基于七项基本原则,这些原则支持以下观点:野生动物是公众的信任和人类与生俱来的权利,需要对野生动物物种进行管理,以便它们的种群永远持续下去。这种强大的野生动物群落是整个地区对智能动物陷阱的主要需求来源。

        《恢复美国野生动物法案》(又称 RAWA)是全球各国政府在野生动物保护方面最重要的投资之一。这项耗资 13.97 亿美元的法案将资助地区和国家举措,以帮助有需要的野生动物并防止野生动物灭绝。它还将有助于恢复已经濒临灭绝的物种。为此,全国各地的企业都在提供各种智能动物陷阱。例如,TrapSmar 使用尖端的 GPS 通信技术,提供一种简单、富有同情心且实用的解决方案,用于远程监控野生动物陷阱。它的三个通信渠道几乎可以覆盖全球任何地方。


        智能动物陷阱市场报告范围

        报告属性细节
        2022 年市场规模3.3436亿美元
        2028 年市场规模5.0756亿美元
        全球复合年增长率(2022 - 2028)7.2%
        历史数据2020-2021
        预测期2023-2028
        涵盖的领域通过硬件
        • 传感器
        • 相机
        • 其他的
        按应用
        • 住宅和商业
        按组件
        • 硬件
        • 软件
        • 服务
        覆盖地区和国家北美
        • 我们
        • 加拿大
        • 墨西哥
        欧洲
        • 英国
        • 德国
        • 法国
        • 俄罗斯
        • 意大利
        • 欧洲其他地区
        亚太
        • 中国
        • 印度
        • 日本
        • 澳大利亚
        • 亚太其他地区
        南美洲和中美洲
        • 巴西
        • 阿根廷
        • 南美洲和中美洲其他地区
        中东和非洲
        • 南非
        • 沙特阿拉伯
        • 阿联酋
        • 中东和非洲其他地区
        市场领导者和主要公司简介
        •  
        • 陷阱大师
        • AlertHouse ApS(Minkpolice)
        • 审阅经理
        • 野蛮熔炼者
        • 天鹰
        • CatchAlive ApS
        • 遭遇解决方案有限公司
        • Econode 有限公司
        • 野生动物统治管理有限责任公司 (HogEye)
        • 示例 PDF 通过定性和定量分析展示了内容结构和信息的性质。


        基于组件的洞察

        根据组件,智能动物陷阱市场报告分为硬件、软件和服务。智能动物陷阱由各种传感器和跟踪器组成的硬件组件组成。软件充当硬件和最终用户之间的纽带,提供与硬件交互的用户界面。服务完全基于用户需求和服务提供商的硬件和软件配置。

        智能动物陷阱市场研究中介绍的公司包括 Alert House ApS、CatchAlive ApS、Encounter Solutions Ltd.、Econode Ltd. 和 Wildlife Dominion Management LLC. (HogEye)、PestSense Pty Ltd Animal Trap Solutions、Skyhawk、TrapSmart tm LLP.、uWatch Ltd.、Fallenmelder TRAPMASTER、TFK Handels GmbH、WildMelder、Triotos 和 BOARMASTER。除了这 14 家公司之外,智能动物陷阱市场研究还分析了多家知名的全球和地区公司、新兴公司、市场颠覆者和利基市场公司。

        智能动物陷阱市场参与者主要采用市场计划战略,包括扩大全球业务范围并满足客户需求的激增。智能动物陷阱市场参与者主要专注于通过将先进功能和技术集成到其产品中来增强产品和服务。

        • Skyhawk 将于 2022 年 7 月 11 日至 2022 年 7 月 14 日参加在佐治亚州海岛修道院举行的 GPCA 夏季会议。该公司将于 2022 年 6 月 21 日至 2022 年 6 月 23 日参加在德克萨斯州沃斯堡会议中心举行的德克萨斯州害虫防治博览会。

        Smart Animal Trap Market Report Scope

        Report Attribute Details
        Market size in US$ 334.36 Million
        Market Size by US$ 507.56 Million
        Global CAGR 7.2%
        Historical Data 2020-2021
        Forecast period 2023-2028
        Segments Covered By 硬件(传感器、摄像头等)
        By 应用(住宅及商业)
        By 组件(硬件、软件和服务)
        Regions and Countries Covered 北美(美国、加拿大、墨西哥)
        • 北美(美国、加拿大、墨西哥)
        欧洲(英国、德国、法国、俄罗斯、意大利、欧洲其他地区)
        • 欧洲(英国、德国、法国、俄罗斯、意大利、欧洲其他地区)
        亚太地区(中国、印度、日本、澳大利亚、亚太地区其他地区)
        • 亚太地区(中国、印度、日本、澳大利亚、亚太地区其他地区)
        南美洲和中美洲(巴西、阿根廷、南美洲和中美洲其他地区)
        • 南美洲和中美洲(巴西、阿根廷、南美洲和中美洲其他地区)
        中东和非洲(南非、沙特阿拉伯、阿联酋、中东和非洲其他地区)
        • 中东和非洲(南非、沙特阿拉伯、阿联酋、中东和非洲其他地区)
        Market leaders and key company profiles
      • Trapmaster
      • AlertHouse ApS (Minkpolice)
      • Revier Manager
      • Wildmelder
      • Skyhawk
      • CatchAlive ApS
      • Encounter Solutions Ltd.
      • Econode Ltd.
      • Wildlife Dominion Management LLC. (HogEye)
      • Report Coverage
        Report Coverage

        Revenue forecast, Company Analysis, Industry landscape, Growth factors, and Trends

        Segment Covered
        Segment Covered

        This text is related
        to segments covered.

        Regional Scope
        Regional Scope

        North America, Europe, Asia Pacific, Middle East & Africa, South & Central America

        Country Scope
        Country Scope

        This text is related
        to country scope.

        Frequently Asked Questions


        What will be the global market size for smart animal trap market by 2028?

        By 2028, the global market size of smart animal trap market will be USD 507.56 Million.

        Which countries are registering a high growth rate during the forecast period?

        US, Germany, China, UAE, Brazil are registering a high growth rate during the forecast period.

        Which application held the largest share in smart animal trap market in 2021?

        The commercial segment led the smart animal trap market with a market share of 66.9% in 2021. Commercial users of smart animal traps are governments, national park management authorities, large agriculturists, and food-based multinational corporations.

        Which country is holding the major market share of North America smart animal trap market?

        US holds the major market share of smart animal trap market in 2022.

        What is the future trend in the smart animal trap market?

        Integration of advanced connectivity and computing technologies to propel the market growth during the forecast period.

        Which are the key players holding the major market share of smart animal trap market?

        Trapmaster.; AlertHouse ApS (Minkpolice); Revier Manager; Wildmelder; and Skyhawk are the five key market players operating in the global smart animal trap market.

        What are the driving factors impacting the smart animal trap market?

        Rise in human wildlife conflicts and rapid increase in population of several wildlife species are major driving factors contributing towards the growth of smart animal trap market.

        What is the estimated global market size for the smart animal trap market in 2021?

        The global smart animal trap market was valued USD 318.47 million in 2021.

        The List of Companies - Smart Animal Trap Market

        1. Trapmaster
        2. AlertHouse ApS (Minkpolice)
        3. Revier Manager
        4. Wildmelder
        5. Skyhawk
        6. CatchAlive ApS
        7. Encounter Solutions Ltd.
        8. Econode Ltd.
        9. Wildlife Dominion Management LLC. (HogEye)
        10. PestSense Pty Ltd Animal Trap Solutions
        11. TrapSmart tm LLp
        12. uWatch Ltd.
        13. Fallenmeder TRAPMASTER
        14. Tritos
        15. Boarmaster

        The Insight Partners performs research in 4 major stages: Data Collection & Secondary Research, Primary Research, Data Analysis and Data Triangulation & Final Review.

        1. Data Collection and Secondary Research:

        As a market research and consulting firm operating from a decade, we have published and advised several client across the globe. First step for any study will start with an assessment of currently available data and insights from existing reports. Further, historical and current market information is collected from Investor Presentations, Annual Reports, SEC Filings, etc., and other information related to company’s performance and market positioning are gathered from Paid Databases (Factiva, Hoovers, and Reuters) and various other publications available in public domain.

        Several associations trade associates, technical forums, institutes, societies and organization are accessed to gain technical as well as market related insights through their publications such as research papers, blogs and press releases related to the studies are referred to get cues about the market. Further, white papers, journals, magazines, and other news articles published in last 3 years are scrutinized and analyzed to understand the current market trends.

        1. Primary Research:

        The primarily interview analysis comprise of data obtained from industry participants interview and answers to survey questions gathered by in-house primary team.

        For primary research, interviews are conducted with industry experts/CEOs/Marketing Managers/VPs/Subject Matter Experts from both demand and supply side to get a 360-degree view of the market. The primary team conducts several interviews based on the complexity of the markets to understand the various market trends and dynamics which makes research more credible and precise.

        A typical research interview fulfils the following functions:

        • Provides first-hand information on the market size, market trends, growth trends, competitive landscape, and outlook
        • Validates and strengthens in-house secondary research findings
        • Develops the analysis team’s expertise and market understanding

        Primary research involves email interactions and telephone interviews for each market, category, segment, and sub-segment across geographies. The participants who typically take part in such a process include, but are not limited to:

        • Industry participants: VPs, business development managers, market intelligence managers and national sales managers
        • Outside experts: Valuation experts, research analysts and key opinion leaders specializing in the electronics and semiconductor industry.

        Below is the breakup of our primary respondents by company, designation, and region:

        Research Methodology

        Once we receive the confirmation from primary research sources or primary respondents, we finalize the base year market estimation and forecast the data as per the macroeconomic and microeconomic factors assessed during data collection.

        1. Data Analysis:

        Once data is validated through both secondary as well as primary respondents, we finalize the market estimations by hypothesis formulation and factor analysis at regional and country level.

        • Macro-Economic Factor Analysis:

        We analyse macroeconomic indicators such the gross domestic product (GDP), increase in the demand for goods and services across industries, technological advancement, regional economic growth, governmental policies, the influence of COVID-19, PEST analysis, and other aspects. This analysis aids in setting benchmarks for various nations/regions and approximating market splits. Additionally, the general trend of the aforementioned components aid in determining the market's development possibilities.

        • Country Level Data:

        Various factors that are especially aligned to the country are taken into account to determine the market size for a certain area and country, including the presence of vendors, such as headquarters and offices, the country's GDP, demand patterns, and industry growth. To comprehend the market dynamics for the nation, a number of growth variables, inhibitors, application areas, and current market trends are researched. The aforementioned elements aid in determining the country's overall market's growth potential.

        • Company Profile:

        The “Table of Contents” is formulated by listing and analyzing more than 25 - 30 companies operating in the market ecosystem across geographies. However, we profile only 10 companies as a standard practice in our syndicate reports. These 10 companies comprise leading, emerging, and regional players. Nonetheless, our analysis is not restricted to the 10 listed companies, we also analyze other companies present in the market to develop a holistic view and understand the prevailing trends. The “Company Profiles” section in the report covers key facts, business description, products & services, financial information, SWOT analysis, and key developments. The financial information presented is extracted from the annual reports and official documents of the publicly listed companies. Upon collecting the information for the sections of respective companies, we verify them via various primary sources and then compile the data in respective company profiles. The company level information helps us in deriving the base number as well as in forecasting the market size.

        • Developing Base Number:

        Aggregation of sales statistics (2020-2022) and macro-economic factor, and other secondary and primary research insights are utilized to arrive at base number and related market shares for 2022. The data gaps are identified in this step and relevant market data is analyzed, collected from paid primary interviews or databases. On finalizing the base year market size, forecasts are developed on the basis of macro-economic, industry and market growth factors and company level analysis.

        1. Data Triangulation and Final Review:

        The market findings and base year market size calculations are validated from supply as well as demand side. Demand side validations are based on macro-economic factor analysis and benchmarks for respective regions and countries. In case of supply side validations, revenues of major companies are estimated (in case not available) based on industry benchmark, approximate number of employees, product portfolio, and primary interviews revenues are gathered. Further revenue from target product/service segment is assessed to avoid overshooting of market statistics. In case of heavy deviations between supply and demand side values, all thes steps are repeated to achieve synchronization.

        We follow an iterative model, wherein we share our research findings with Subject Matter Experts (SME’s) and Key Opinion Leaders (KOLs) until consensus view of the market is not formulated – this model negates any drastic deviation in the opinions of experts. Only validated and universally acceptable research findings are quoted in our reports.

        We have important check points that we use to validate our research findings – which we call – data triangulation, where we validate the information, we generate from secondary sources with primary interviews and then we re-validate with our internal data bases and Subject matter experts. This comprehensive model enables us to deliver high quality, reliable data in shortest possible time.

        Your data will never be shared with third parties, however, we may send you information from time to time about our products that may be of interest to you. By submitting your details, you agree to be contacted by us. You may contact us at any time to opt-out.

        Related Reports