兽医诊断产品市场规模及趋势(2031年)

  • Report Code : TIPRE00041036
  • Category : Life Sciences
  • Status : Published
  • No. of Pages : 382
立即购买

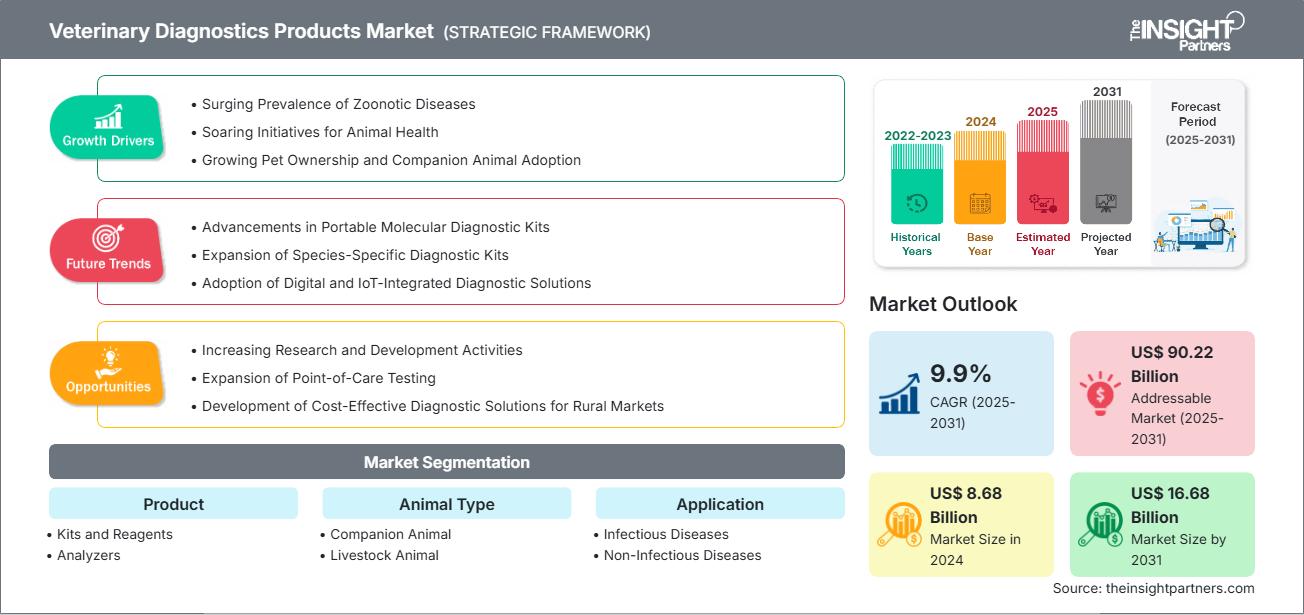
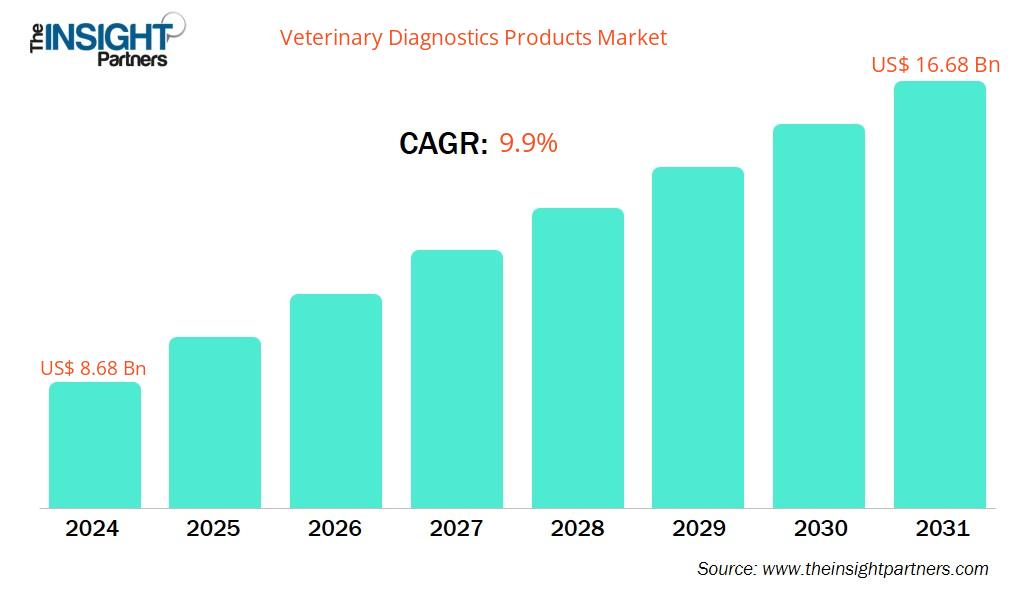
兽医诊断产品市场规模预计将从 2024 年的 86.8 亿美元增至 2031 年的 166.8 亿美元,2025-2031 年期间的复合年增长率为 9.9%。  

兽医诊断产品市场分析

人畜共患疾病的流行率飙升、动物健康倡议的激增、宠物饲养量的增加以及伴侣动物的领养推动了市场的增长。为农村市场开发经济高效的诊断解决方案将为未来几年兽医诊断产品市场创造充足的机会。

兽医诊断产品市场概况

预计北美将主导兽医诊断产品市场,在预测期内占据最大份额。此外,由于人们对动物健康的认识不断提高,预计亚太地区在预测期内将实现显著的复合年增长率。随着人们越来越意识到预防保健、早期疾病检测和及时治疗的重要性,宠物主人正在寻找可靠的诊断测试来追踪其宠物的健康状况。这种变化对急诊医学、护理和外科等许多医疗领域都具有吸引力。

定制此报告以满足您的要求

您将获得任何报告的免费定制,包括本报告的部分内容、国家级分析、Excel 数据包,以及为初创企业和大学提供优惠和折扣

兽医诊断产品市场:

Veterinary Diagnostics Products Market
  • 获取此报告的顶级关键市场趋势。
    此免费样品将包括数据分析,从市场趋势到估计和预测。

兽医诊断产品市场驱动因素和机遇


市场驱动因素:


  • 人畜共患疾病流行率飙升:人畜共患疾病由病毒、细菌、寄生虫和真菌引起,由动物传播给人类,并导致疾病。常见的人畜共患疾病包括埃博拉病毒、狂犬病、沙门氏菌病、炭疽病、莱姆病、大肠杆菌和禽流感。这些疾病构成了重大的公共卫生挑战。
  • 动物健康倡议蓬勃发展:自提高疫苗接种意识以管理人畜共患疾病以来,世界动物卫生组织和世界卫生组织发起了全球宣传活动。根据世界卫生组织的《全球战略计划》,目标是到2030年消除犬类狂犬病造成的人类死亡。该计划支持提高疫苗使用率的努力。  
  • 宠物拥有量和伴侣动物领养量不断增长:根据 HealthforAnimals 于 2024 年发布的报告,全球宠物数量已超过 10 亿只。宠物数量的增长归因于城市化、生活方式的改变以及与宠物(尤其是猫狗)之间更紧密的情感联系。


市场机会:


  • 研发活动不断增加:市场参与者不断增加的研发支出推动了检测技术的创新。这提高了试剂盒的灵敏度和特异性,并解决了不同地区特定的动物健康挑战。
  • 扩大即时检测:即时检测 (POC) 使兽医和农民能够快速获得结果,而无需依赖中心实验室。从偏远农村地区到城市诊所,这些中心实验室在全球各地基础设施各异的环境中至关重要。这种方法有助于快速识别疾病,改善动物福利,提高牲畜生产力,并支持可持续农业和人畜共患疾病控制的国际目标。
  • 为农村市场开发经济高效的诊断解决方案:农村地区缺乏合适的实验室设施和技术熟练的工人,因此需要价格实惠、易于使用的诊断工具。这些工具可供农民或受过基本培训的个人使用。 

兽医诊断产品市场报告细分分析

为了更清晰地了解兽医诊断产品市场运作方式、增长潜力和最新趋势,我们将兽医诊断产品市场划分为不同的细分市场。以下是大多数行业报告中使用的标准细分方法:

按动物类型:

  • 伴侣动物:伴侣动物医疗保健包括用于诊断、治疗和预防宠物(例如猫狗)疾病的产品和服务。它涵盖疫苗接种、药物治疗、诊断测试和特殊饮食,以改善动物健康。
  • 牲畜:由于对动物源性食品的需求大幅增加,畜牧业在过去几年中发生了迅速变化。

按产品:

  • 试剂盒和试剂:受“同一个健康”方法等国际举措和对动物健康的日益关注推动,全球市场兽医诊断试剂盒和试剂的推出和供应正在增长。
  • 分析仪:医疗器械开发商可以获得动物研究和设备临床研究的资金支持。

按应用:

  • 传染病:犬细小病毒和禽流感等人畜共患疾病发病率不断上升,需要 PCR 和 ELISA 等快速诊断工具来控制传播并改善治疗效果。
  • 非传染性疾病:动物的非传染性疾病,也称为非传染性疾病,包括代谢紊乱(酮症和糖尿病)、炎症问题(乳腺炎)和肌肉骨骼问题(跛足、癌症和肥胖症)。

按最终用户:

  • 公共医疗机构
  • 私人医疗机构

按地理位置:

  • 北美
  • 欧洲
  • 亚太地区
  • 拉美
  • 中东和非洲

北美兽医诊断产品市场预计将占据相当大的市场份额。该地区狂犬病、流感等疾病的高发性以及完善的医疗基础设施等因素可能会推动市场发展。


兽医诊断产品市场区域洞察

Insight Partners 的分析师已详尽阐述了预测期内影响兽医诊断产品市场的区域趋势和因素。本节还讨论了北美、欧洲、亚太地区、中东和非洲以及南美和中美洲的兽医诊断产品市场细分和地域分布。

兽医诊断产品市场报告范围

报告属性细节
2024年的市场规模86.8亿美元
2031年的市场规模166.8亿美元
全球复合年增长率(2025-2031)9.9%
史料2021-2023
预测期2025-2031
涵盖的领域按产品
  • 试剂盒和试剂
  • 分析器
按动物类型
  • 伴侣动物
  • 牲畜动物
按应用
  • 传染病
  • 非传染性疾病
按最终用户
  • 公共医疗机构
  • 私人医疗机构
覆盖地区和国家北美
  • 美国
  • 加拿大
  • 墨西哥
欧洲
  • 西班牙
  • 英国
  • 德国
  • 法国
  • 意大利
  • 欧洲其他地区
亚太地区
  • 韩国
  • 中国
  • 印度
  • 日本
  • 澳大利亚
  • 亚太其他地区
中东和非洲
  • 南非
  • 南非
  • 阿联酋
  • 中东和非洲其他地区
南美洲和中美洲
  • 巴西
  • 阿根廷
  • 南美洲和中美洲其他地区
市场领导者和主要公司简介
  • 硕腾公司
  • 赛默飞世尔科技公司
  • 朗道实验室有限公司
  • Bionote公司
  • 黄金标准诊断布达佩斯 Kft
  • Ubio生物技术系统私人有限公司
  • 安全诊断私人有限公司
  • InBios国际公司
  • VMRD公司
  • 富士胶片公司


兽医诊断产品市场参与者密度:了解其对业务动态的影响

兽医诊断产品市场正在快速增长,这得益于终端用户需求的不断增长,而这些需求的驱动因素包括消费者偏好的不断变化、技术进步以及对产品优势的认知度不断提高。随着需求的增长,企业正在扩展产品线,不断创新以满足消费者需求,并抓住新兴趋势,从而进一步推动市场增长。


Veterinary Diagnostics Products Market


  • 获取兽医诊断产品市场主要参与者概览

兽医诊断产品市场份额(按地区)分析

预计未来几年亚太地区将增长最快。南美、中美、中东和非洲等新兴市场也为兽医诊断产品供应商提供了许多尚未开发的扩张机会。

由于狂犬病、流感和利什曼病等疾病的高发性,各地区兽医诊断产品市场的增长情况各不相同。以下是各地区市场份额和趋势的总结:


1. 北美


  • 市场份额:占据全球市场的很大份额
  • 关键驱动因素:
    • 传染病等疾病的高发病率
    • 完善的医疗基础设施
    • 政府支持举措
  • 趋势:制造业进步和可持续实践


2.欧洲


  • 市场份额:由于疼痛状况的日益普遍,市场份额大幅增加
  • 关键驱动因素:
    • 宠物数量和传染病的流行
    • 加强研发活动
  • 趋势:监管对市场结构的影响


3. 亚太地区


  • 市场份额:增长最快的地区,市场份额逐年上升
  • 关键驱动因素:
    • 庞大的生产基地和成本优势
    • 医疗基础设施快速改善
    • 本地生产和出口能力强
  • 趋势:配方和交付方面的创新


4. 南美洲和中美洲


  • 市场份额:市场稳步增长
  • 关键驱动因素:
    • 传染病和自我药疗的发病率不断上升
    • 不断增强的动物健康意识和消费能力
  • 趋势:诊断试剂盒制造的技术发展


5.中东和非洲


  • 市场份额:虽然较小,但增长迅速
  • 关键驱动因素:
    • 扩大医疗基础设施
    • 传染病流行情况
  • 趋势:诊断产品的增长

兽医诊断产品市场参与者密度:了解其对业务动态的影响


市场密度高,竞争激烈


由于 Zoetis Inc、Randox Laboratories Ltd 和 Fujifilm Corp 等老牌企业的存在,竞争十分激烈。Bionote Inc 和 Gold Standard Diagnostics Budapest Kft 等区域性和利基供应商加剧了不同地区的竞争格局。

这种激烈的竞争促使公司通过提供以下产品脱颖而出:

  • 高级产品
  • 定制和可持续解决方案等增值服务
  • 有竞争力的定价模式
  • 遵守监管准则

机遇与战略举措

  • 企业在研发上的投入不断增加,推动了检测技术的创新,也提高了试剂盒的灵敏度和特异性,并解决了不同地区特定的动物健康问题。
  • 制造商可能会专注于本地生产以削减成本并加强供应链,尤其是在印度等大批量市场。

兽医诊断产品市场的主要公司有:

  1. 硕腾公司
  2. 赛默飞世尔科技公司
  3. 朗道实验室有限公司
  4. Bionote公司
  5. 黄金标准诊断布达佩斯 Kft
  6. Ubio生物技术系统私人有限公司
  7. 安全诊断私人有限公司
  8. InBios国际公司
  9. VMRD公司
  10. 富士胶片公司


免责声明:以上列出的公司没有按任何特定顺序排列。


研究过程中分析的其他公司:

  1. Idexx实验室公司
  2. ARI医疗科技有限公司
  3. 免疫学顾问实验室公司
  4. 赫斯卡公司
  5. 创新诊断 SAS
  6. i-SENS公司
  7. 天津市陆康医疗科技有限公司
  8. 环球生物传感器公司
  9. Elabscience生物技术公司
  10. 礼来动物保健公司
  11. Ceva Santé Animale
  12. 深圳迈瑞动物医疗技术股份有限公司

兽医诊断产品市场新闻和最新发展

  • Zoetis 推出 AI Masses,这是 Vetscan Imagyst 的全新人工智能细胞学功能 Zoetis Inc. 推出了 AI Masses,这是 Vetscan Imagyst 分析仪的最新功能。AI Masses 可准确检测潜在的肿瘤细胞,支持兽医专业人员做出明智的决策,并简化诊断和临床工作流程。
  • 富士胶片全新兽医内部诊断系统富士胶片医疗欧洲公司宣布推出 FUJI DRI-CHEM AU20V,这是一款增强型兽医内部诊断测量设备。这是富士胶片 FVET 兽医诊断产品组合的最新成员,旨在快速提供实验室级质量的检测结果。

兽医诊断产品市场报告覆盖范围和交付成果

《兽医诊断产品市场规模和预测(2021-2031)》报告对以下领域进行了详细的市场分析:

  • 兽医诊断产品市场规模及全球、区域和国家层面所有主要细分市场的预测
  • 兽医诊断产品市场趋势以及市场动态,例如驱动因素、限制因素和关键机遇
  • 详细的 PEST 和 SWOT 分析
  • 兽医诊断产品市场分析涵盖主要市场趋势、全球和区域框架、主要参与者、法规和最新市场发展
  • 行业格局和竞争分析,涵盖市场集中度、热图分析、知名参与者以及兽医诊断产品市场的最新发展
  • 详细的公司简介
  • 历史分析(2 年)、基准年、预测(7 年)及复合年增长率
  • PEST 和 SWOT 分析
  • 市场规模价值/数量 - 全球、区域、国家
  • 行业和竞争格局
  • Excel 数据集
veterinary-diagnostics-products-market-report-deliverables-img1
veterinary-diagnostics-products-market-report-deliverables-img2
Report Coverage
Report Coverage

Revenue forecast, Company Analysis, Industry landscape, Growth factors, and Trends

Segment Covered
Segment Covered

This text is related
to segments covered.

Regional Scope
Regional Scope

North America, Europe, Asia Pacific, Middle East & Africa, South & Central America

Country Scope
Country Scope

This text is related
to country scope.

常见问题


Which are the leading players operating in the veterinary diagnostics products market?

Zoetis Inc., Thermo Fisher Scientific Inc., Randox Laboratories Ltd, Bionote Inc., Gold Standard Diagnostics Budapest Kft., Ubio Biotechnology Systems Pvt Ltd, Secure Diagnostics Pvt Ltd, InBios International Inc., VMRD Inc., and Fujifilm Corp are among the key players operating in the veterinary diagnostics products market.

What are the factors driving the veterinary diagnostics products market?

The surging prevalence of zoonotic diseases, soaring initiatives for animal health, growing pet ownership, and companion animal adoption drive the market growth.

What would be the estimated value of the veterinary diagnostics products market by 2031?

The veterinary diagnostics products market is estimated to reach US$16.68 billion by 2031.

What is the expected CAGR of the veterinary diagnostics products market?

The veterinary diagnostics products market is estimated to register a CAGR of 9.9% during the forecast period.

Your data will never be shared with third parties, however, we may send you information from time to time about our products that may be of interest to you. By submitting your details, you agree to be contacted by us. You may contact us at any time to opt-out.

The List of Companies - Veterinary Diagnostics Products Market

  1. Zoetis Inc
  2. Thermo Fisher Scientific Inc
  3. Randox Laboratories Ltd
  4. Bionote Inc
  5. Gold Standard Diagnostics Budapest Kft
  6. Ubio Biotechnology Systems Pvt Ltd
  7. Secure Diagnostics Pvt Ltd
  8. InBios International Inc
  9. VMRD Inc
  10. Fujifilm Corp
销售支持
US: +1-646-491-9876
UK: +44-20-8125-4005
Email: sales@theinsightpartners.com
与我们聊天
DUNS Logo
87-673-9708
ISO Certified Logo
ISO 9001:2015
ISO Certified Logo

The Insight Partners performs research in 4 major stages: Data Collection & Secondary Research, Primary Research, Data Analysis and Data Triangulation & Final Review.

  1. Data Collection and Secondary Research:

As a market research and consulting firm operating from a decade, we have published and advised several client across the globe. First step for any study will start with an assessment of currently available data and insights from existing reports. Further, historical and current market information is collected from Investor Presentations, Annual Reports, SEC Filings, etc., and other information related to company’s performance and market positioning are gathered from Paid Databases (Factiva, Hoovers, and Reuters) and various other publications available in public domain.

Several associations trade associates, technical forums, institutes, societies and organization are accessed to gain technical as well as market related insights through their publications such as research papers, blogs and press releases related to the studies are referred to get cues about the market. Further, white papers, journals, magazines, and other news articles published in last 3 years are scrutinized and analyzed to understand the current market trends.

  1. Primary Research:

The primarily interview analysis comprise of data obtained from industry participants interview and answers to survey questions gathered by in-house primary team.

For primary research, interviews are conducted with industry experts/CEOs/Marketing Managers/VPs/Subject Matter Experts from both demand and supply side to get a 360-degree view of the market. The primary team conducts several interviews based on the complexity of the markets to understand the various market trends and dynamics which makes research more credible and precise.

A typical research interview fulfils the following functions:

  • Provides first-hand information on the market size, market trends, growth trends, competitive landscape, and outlook
  • Validates and strengthens in-house secondary research findings
  • Develops the analysis team’s expertise and market understanding

Primary research involves email interactions and telephone interviews for each market, category, segment, and sub-segment across geographies. The participants who typically take part in such a process include, but are not limited to:

  • Industry participants: VPs, business development managers, market intelligence managers and national sales managers
  • Outside experts: Valuation experts, research analysts and key opinion leaders specializing in the electronics and semiconductor industry.

Below is the breakup of our primary respondents by company, designation, and region:

Research Methodology

Once we receive the confirmation from primary research sources or primary respondents, we finalize the base year market estimation and forecast the data as per the macroeconomic and microeconomic factors assessed during data collection.

  1. Data Analysis:

Once data is validated through both secondary as well as primary respondents, we finalize the market estimations by hypothesis formulation and factor analysis at regional and country level.

  • Macro-Economic Factor Analysis:

We analyse macroeconomic indicators such the gross domestic product (GDP), increase in the demand for goods and services across industries, technological advancement, regional economic growth, governmental policies, the influence of COVID-19, PEST analysis, and other aspects. This analysis aids in setting benchmarks for various nations/regions and approximating market splits. Additionally, the general trend of the aforementioned components aid in determining the market's development possibilities.

  • Country Level Data:

Various factors that are especially aligned to the country are taken into account to determine the market size for a certain area and country, including the presence of vendors, such as headquarters and offices, the country's GDP, demand patterns, and industry growth. To comprehend the market dynamics for the nation, a number of growth variables, inhibitors, application areas, and current market trends are researched. The aforementioned elements aid in determining the country's overall market's growth potential.

  • Company Profile:

The “Table of Contents” is formulated by listing and analyzing more than 25 - 30 companies operating in the market ecosystem across geographies. However, we profile only 10 companies as a standard practice in our syndicate reports. These 10 companies comprise leading, emerging, and regional players. Nonetheless, our analysis is not restricted to the 10 listed companies, we also analyze other companies present in the market to develop a holistic view and understand the prevailing trends. The “Company Profiles” section in the report covers key facts, business description, products & services, financial information, SWOT analysis, and key developments. The financial information presented is extracted from the annual reports and official documents of the publicly listed companies. Upon collecting the information for the sections of respective companies, we verify them via various primary sources and then compile the data in respective company profiles. The company level information helps us in deriving the base number as well as in forecasting the market size.

  • Developing Base Number:

Aggregation of sales statistics (2020-2022) and macro-economic factor, and other secondary and primary research insights are utilized to arrive at base number and related market shares for 2022. The data gaps are identified in this step and relevant market data is analyzed, collected from paid primary interviews or databases. On finalizing the base year market size, forecasts are developed on the basis of macro-economic, industry and market growth factors and company level analysis.

  1. Data Triangulation and Final Review:

The market findings and base year market size calculations are validated from supply as well as demand side. Demand side validations are based on macro-economic factor analysis and benchmarks for respective regions and countries. In case of supply side validations, revenues of major companies are estimated (in case not available) based on industry benchmark, approximate number of employees, product portfolio, and primary interviews revenues are gathered. Further revenue from target product/service segment is assessed to avoid overshooting of market statistics. In case of heavy deviations between supply and demand side values, all thes steps are repeated to achieve synchronization.

We follow an iterative model, wherein we share our research findings with Subject Matter Experts (SME’s) and Key Opinion Leaders (KOLs) until consensus view of the market is not formulated – this model negates any drastic deviation in the opinions of experts. Only validated and universally acceptable research findings are quoted in our reports.

We have important check points that we use to validate our research findings – which we call – data triangulation, where we validate the information, we generate from secondary sources with primary interviews and then we re-validate with our internal data bases and Subject matter experts. This comprehensive model enables us to deliver high quality, reliable data in shortest possible time.