نمو سوق موصلات الطاقة الفضائية والدفاعية والحجم والمشاركة والاتجاهات وتحليل اللاعبين الرئيسيين والتوقعات حتى عام 2027
البيانات التاريخية : 2019-2020 | سنة الأساس : 2021 | فترة التنبؤ : 2022-2027توقعات سوق موصلات الطاقة في قطاعي الطيران والدفاع حتى عام ٢٠٢٧ - تأثير جائحة كوفيد-١٩ والتحليل العالمي حسب التصنيف الحالي (٥-٤٠ أمبير، >٤٠-٨٠ أمبير، >٨٠-١٥٠ أمبير، >١٥٠-٣٠٠ أمبير، >٣٠٠-٦٠٠ أمبير، >٦٠٠-٩٠٠ أمبير)؛ شكل الموصل (مستطيل ودائري)؛ الاستخدام (في مجال الطيران، والمركبات البرية العسكرية، والمعدات المحمولة على الجسم، والسفن البحرية).
- تاريخ التقرير : May 2020
- رمز التقرير : TIPRE00010500
- الفئة : الفضاء والدفاع
- الحالة : نُشرت
- تنسيقات التقارير المتاحة :


- عدد الصفحات : 206
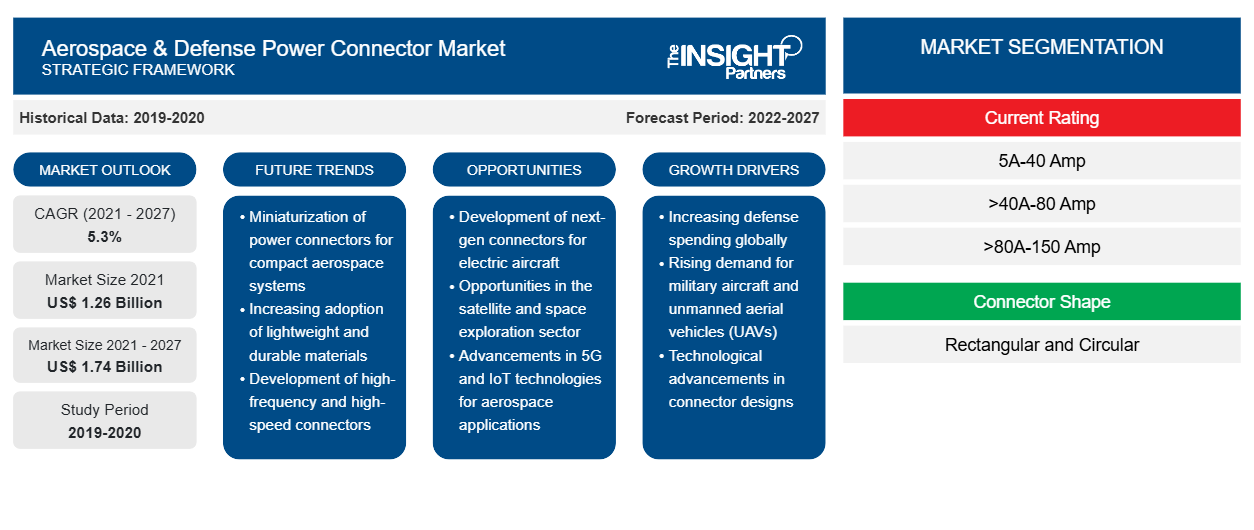
من المتوقع أن ينمو سوق موصلات الطاقة في مجال الطيران والدفاع من 1،262.71 مليون دولار أمريكي في عام 2021 إلى 1،737.78 مليون دولار أمريكي بحلول عام 2027. ومن المتوقع أن ينمو سوق موصلات الطاقة في مجال الطيران والدفاع بمعدل نمو سنوي مركب قدره 5.3٪ خلال الفترة المتوقعة من 2021 إلى 2027.
تشهد صناعة تصنيع الطائرات العالمية نموًا كبيرًا بسبب الطلب المتزايد على الطائرات التجارية والعسكرية في جميع أنحاء العالم. تعد الدخول المتاحة المتزايدة في البلدان النامية ووجود لاعبين كبار مثل بوينج وإيرباص من بين العوامل التي تدفع الطلب على هذه الطائرات. في سيناريو عالمي، من المتوقع أن تحافظ الطائرات التجارية على نمو مستمر على مدى السنوات القادمة، بغض النظر عن العديد من التحديات التي تواجهها شركات الطيران التجارية مثل أسعار الوقود غير المؤكدة والتغييرات التنظيمية الأخرى في مختلف البلدان. بالإضافة إلى ذلك، من المتوقع أن تؤدي الاستثمارات المتزايدة في المعدات الدفاعية عبر البلدان إلى دفع الطلب على الطائرات العسكرية خلال الفترة المتوقعة من 2020 إلى 2027. يتطلب الإنتاج المتزايد للطائرات دمج المعدات المتقدمة مثل التحكم في المحرك، والإلكترونيات، ونظام المقصورة، ونظام الترفيه أثناء الطيران، والذي يتطلب موصلات طاقة من أجل توفير الطاقة لهذه الأنظمة. تم تصميم موصلات الطاقة لتلبية معايير الطيران والدفاع. من المتوقع أن تعمل كل هذه العوامل على تغذية الطلب على موصلات الطاقة في مناطق جغرافية مختلفة وتوفر فرص نمو مستقبلية للاعبين في سوق موصلات الطاقة في مجال الطيران والدفاع العاملين في السوق العالمية.
تعتمد صناعة إنتاج الطائرات بشكل كبير على العمالة اليدوية على الرغم من التكنولوجيا الروبوتية. وفي أعقاب لوائح الإغلاق الصارمة التي فرضتها العديد من البلدان، يشهد قطاع تصنيع الطائرات عددًا أقل بكثير من العمال في مرافق تصنيع الطائرات والمكونات المعنية. ونظرًا لأن قطاع تصنيع الطائرات يتركز بشكل أساسي في أمريكا الشمالية وأوروبا، فإن المنطقتين تواجهان تحديًا هائلاً في الحفاظ على وتيرة التصنيع مع تفشي المرض. تصنع الدول الأوروبية مكونات طائرات مختلفة ومعدات ومركبات دفاعية. ومع ذلك، تواجه غالبية الدول الأوروبية تحديًا يتمثل في تفشي المرض المتزايد باستمرار. ويشهد صانعو الطائرات في جميع أنحاء العالم انخفاضًا حادًا في شراء المكونات. والانخفاض في إنتاج مكونات الطائرات هو نتيجة لنقص العمالة.
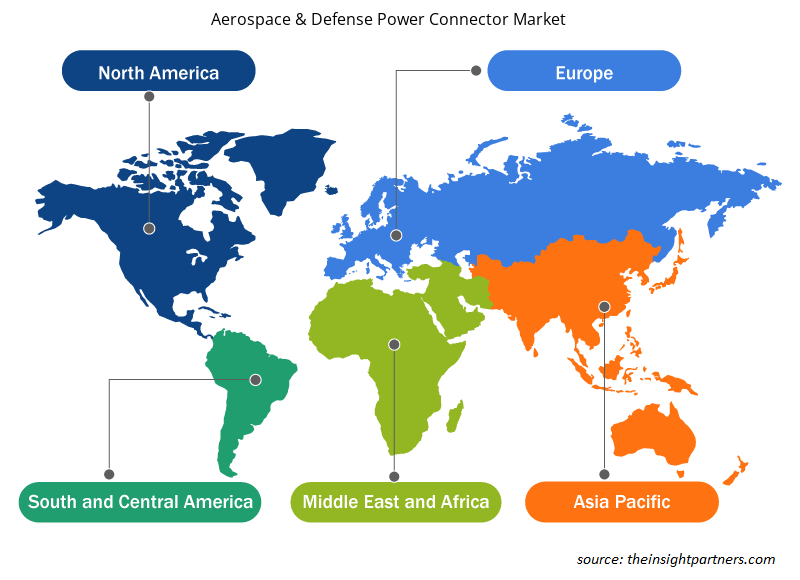
تم تقسيم سوق موصلات الطاقة الجوية والدفاعية على أساس التصنيف الحالي وشكل الموصل والتطبيق والجغرافيا. بناءً على التصنيف الحالي، تم تقسيم السوق إلى 5 أمبير إلى 40 أمبير، >40 أمبير إلى 80 أمبير، >80 أمبير إلى 150 أمبير، >150 أمبير إلى 300 أمبير، >300 أمبير إلى 600 أمبير، >600 إلى 900 أمبير. مثلت شريحة 5 أمبير إلى 40 أمبير أكبر حصة من السوق الإجمالية طوال فترة التنبؤ. بناءً على شكل الموصل، تم تقسيم السوق إلى مستطيل ودائري. بناءً على التطبيق، يتم تقسيم السوق إلى الفضاء والمركبات البرية العسكرية والمعدات التي يرتديها الجسم والسفن البحرية. ينقسم قطاع الفضاء والطيران إلى نظام التحكم في المحرك والإلكترونيات ومعدات المقصورة وغيرها. من الناحية الجغرافية، يتم تقسيم السوق إلى خمس مناطق رئيسية - أمريكا الشمالية، وأوروبا، ومنطقة آسيا والمحيط الهادئ (APAC)، والشرق الأوسط وأفريقيا (MEA)، وأمريكا الجنوبية (SAM).
قم بتخصيص هذا التقرير ليناسب متطلباتك
ستحصل على تخصيص لأي تقرير - مجانًا - بما في ذلك أجزاء من هذا التقرير، أو تحليل على مستوى الدولة، وحزمة بيانات Excel، بالإضافة إلى الاستفادة من العروض والخصومات الرائعة للشركات الناشئة والجامعات
سوق موصلات الطاقة في مجال الطيران والدفاع: رؤى استراتيجية
- احصل على أهم اتجاهات السوق الرئيسية لهذا التقرير.ستتضمن هذه العينة المجانية تحليلاً للبيانات، بدءًا من اتجاهات السوق وحتى التقديرات والتوقعات.
رؤى حول سوق موصلات الطاقة في مجال الطيران والدفاع
تحفيز الطلب على تحديث الجنود
تتطلب سيناريوهات ساحة المعركة المتزايدة من الجيوش تجهيز الجنود بتقنيات متقدمة. تركز الجيوش في جميع أنحاء العالم بشكل كبير على تحسين حماية الجنود من خلال الدروع الواقية الفعالة والحماية الشخصية. تعمل العديد من البلدان المتقدمة تكنولوجيًا مثل الصين والولايات المتحدة على تحديث قواتها المسلحة بسرعة، كما تستثمر بشكل كبير في البحث والتطوير لتكنولوجيا الدفاع المتقدمة. كما تجري أبحاثًا في مجموعة واسعة من التكنولوجيا المتعلقة بالدفاع، مثل الذكاء الاصطناعي والروبوتات وعلوم المعلومات الكمومية والبيومترية. تميل الحكومة بشدة إلى استثمار المليارات في المعدات العسكرية والدفاعية؛ على سبيل المثال، وفقًا لمعهد ستوكهولم الدولي لأبحاث السلام (SIPRI)، في عام 2019، ارتفع الإنفاق العسكري العالمي إلى 1917 مليار دولار أمريكي، ويشمل ذلك الإنفاق على القوات والأنشطة العسكرية الحالية، وشراء الأسلحة والمعدات، والبناء العسكري، والبحث والتطوير، والقيادة والدعم.
رؤى السوق القائمة على التصنيف الحالي
يقدم اللاعبون في السوق العاملون في سوق موصلات الطاقة في مجال الطيران والدفاع منتجاتهم بتصنيفات تيار مختلفة، وذلك لتلبية متطلبات العملاء. تتمتع موصلات الطاقة بمجموعة واسعة من التطبيقات، ويتطلب كل تطبيق موصلات مختلفة بتيار متفاوت. تم تحليل سوق موصلات الطاقة في مجال الطيران والدفاع على أساس تصنيفات تيار مختلفة، والتي تشمل 5 أمبير إلى 40 أمبير، >40 أمبير إلى 80 أمبير، >80 أمبير إلى 150 أمبير، >150 أمبير إلى 300 أمبير، >300 أمبير إلى 600 أمبير، >600 أمبير إلى 900 أمبير.
رؤى السوق المستندة إلى شكل الموصل
عندما يتعلق الأمر بالأجهزة الكهربائية، فإن مصدر الطاقة الثابت والموثوق به أمر بالغ الأهمية. يعتمد اختيار موصل الطاقة المناسب تمامًا على طبيعة التطبيق وكذلك على المتطلبات المحددة للعميل. تتراوح مجموعة موصلات الطاقة من الإصدارات ذات الجهد العالي والمعايير المحددة إلى تنوع التصميم، وتوفر مجموعة موصلات الطاقة مجموعة واسعة وعملية لتلبية أهداف التطبيق الفردية للمستخدم. هناك مجموعة واسعة من المنتجات المستطيلة والأسطوانية للاستخدام في التطبيقات ذات التيار العالي والطاقة العالية.
رؤى السوق القائمة على التطبيق
تُستخدم موصلات الطاقة بكثافة في تطبيقات مختلفة في قطاع الطيران والدفاع. تعد موصلات الطاقة مكونات أساسية في الطائرات والمركبات البرية العسكرية والسفن البحرية والمعدات التي يتم ارتداؤها على الجسم. يسمح وجود أعداد كبيرة من المقاولين في مجال الطيران والدفاع في جميع أنحاء العالم للاعبين في سوق موصلات الطاقة بتجربة طلب كبير على منتجاتهم، مما يحفز سوق موصلات الطاقة في مجال الطيران والدفاع عامًا بعد عام.
يركز اللاعبون العاملون في سوق موصلات الطاقة في مجال الطيران والدفاع على استراتيجيات مثل مبادرات السوق والاستحواذ وإطلاق المنتجات للحفاظ على مواقعهم في سوق موصلات الطاقة في مجال الطيران والدفاع. فيما يلي بعض التطورات التي قام بها اللاعبون الرئيسيون في سوق موصلات الطاقة في مجال الطيران والدفاع:
في فبراير 2020، أعلنت شركة AMETEK عن استكمال توسعة كبيرة في إنتاج الموصلات المحكمة، مما أدى إلى تقليل وقت التسليم بنحو 35% للمنتجات التي كانت في نقص لأكثر من عام. وتم زيادة المعدات والمرافق والموظفين في مواقعها في أوهايو وكاليفورنيا.
في يوليو 2020، وسعت شركة Radiall سلسلة EPX™ الخاصة بها بإضافة موصل iEPX الأحدث، وهو غلاف فصل EPXB2 محسن الوزن يتميز بتخفيف الضغط المتكامل وغطاء خلفي EMI مضغوط ويدعم التكامل السريع والأكثر فعالية من حيث التكلفة في أنظمة الطائرات.
نطاق تقرير سوق موصلات الطاقة في مجال الطيران والدفاع
رؤى إقليمية حول سوق موصلات الطاقة في مجال الطيران والدفاع
لقد قام المحللون في Insight Partners بشرح الاتجاهات والعوامل الإقليمية المؤثرة على سوق موصلات الطاقة في مجال الطيران والدفاع طوال فترة التوقعات بشكل شامل. يناقش هذا القسم أيضًا قطاعات سوق موصلات الطاقة في مجال الطيران والدفاع والجغرافيا في جميع أنحاء أمريكا الشمالية وأوروبا ومنطقة آسيا والمحيط الهادئ والشرق الأوسط وأفريقيا وأمريكا الجنوبية والوسطى.
- احصل على البيانات الإقليمية المحددة لسوق موصلات الطاقة الجوية والدفاعية
نطاق تقرير سوق موصلات الطاقة في مجال الطيران والدفاع
| سمة التقرير | تفاصيل |
|---|---|
| حجم السوق في عام 2021 | 1.26 مليار دولار أمريكي |
| حجم السوق بحلول عام 2027 | 1.74 مليار دولار أمريكي |
| معدل النمو السنوي المركب العالمي (2021 - 2027) | 5.3% |
| البيانات التاريخية | 2019-2020 |
| فترة التنبؤ | 2022-2027 |
| القطاعات المغطاة | حسب التقييم الحالي
|
| المناطق والدول المغطاة | أمريكا الشمالية
|
| قادة السوق وملفات تعريف الشركات الرئيسية |
|
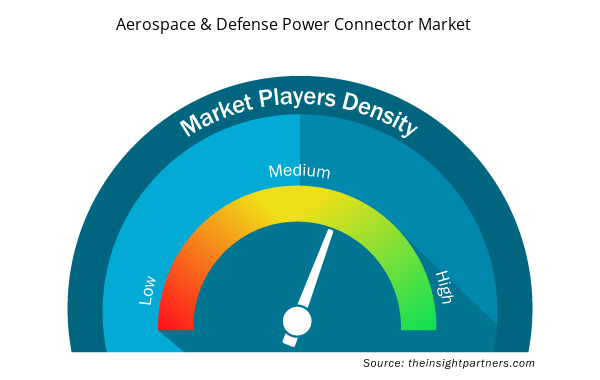
كثافة اللاعبين في السوق: فهم تأثيرها على ديناميكيات الأعمال
يشهد سوق موصلات الطاقة في مجال الطيران والدفاع نموًا سريعًا، مدفوعًا بالطلب المتزايد من المستخدم النهائي بسبب عوامل مثل تفضيلات المستهلكين المتطورة والتقدم التكنولوجي والوعي المتزايد بفوائد المنتج. ومع ارتفاع الطلب، تعمل الشركات على توسيع عروضها والابتكار لتلبية احتياجات المستهلكين والاستفادة من الاتجاهات الناشئة، مما يؤدي إلى زيادة نمو السوق.
تشير كثافة اللاعبين في السوق إلى توزيع الشركات أو المؤسسات العاملة في سوق أو صناعة معينة. وهي تشير إلى عدد المنافسين (اللاعبين في السوق) الموجودين في مساحة سوق معينة نسبة إلى حجمها أو قيمتها السوقية الإجمالية.
الشركات الرئيسية العاملة في سوق موصلات الطاقة الجوية والدفاعية هي:
- شركة أميتك
- شركة أمفينول
- شركة أرو للإلكترونيات
- كولينز ايروسبيس (شركة رايثيون تكنولوجيز)
- شركة إيتون المحدودة
إخلاء المسؤولية : الشركات المذكورة أعلاه ليست مرتبة بأي ترتيب معين.
- احصل على نظرة عامة على أهم اللاعبين الرئيسيين في سوق موصلات الطاقة في مجال الطيران والدفاع
سوق موصلات الطاقة في مجال الطيران والدفاع – حسب المكون
- 5 أمبير إلى 40 أمبير
- >40 أمبير إلى 80 أمبير
- >80 أمبير إلى 150 أمبير
- >150 أمبير إلى 300 أمبير
- >300 أمبير إلى 600 أمبير
- >600 أمبير إلى 900 أمبير
سوق موصلات الطاقة في مجال الطيران والدفاع – حسب شكل الموصل
- مستطيل
- دائري
سوق موصلات الطاقة في مجال الطيران والدفاع – حسب التطبيق
- الفضاء الجوي
- مركبة عسكرية برية
- المعدات التي يتم ارتداؤها على الجسم
- السفن البحرية
سوق موصلات الطاقة في مجال الطيران والدفاع – حسب المنطقة الجغرافية
- أمريكا الشمالية
- نحن
- كندا
- المكسيك
- أوروبا
- فرنسا
- ألمانيا
- روسيا
- المملكة المتحدة
- إيطاليا
- بقية أوروبا
- آسيا والمحيط الهادئ (APAC)
- الصين
- الهند
- اليابان
- أستراليا
- كوريا الجنوبية
- بقية منطقة آسيا والمحيط الهادئ
- الشرق الأوسط وأفريقيا
- المملكة العربية السعودية
- الامارات العربية المتحدة
- جنوب أفريقيا
- باقي منطقة الشرق الأوسط وأفريقيا
- سام
- البرازيل
- بقية سام
سوق موصلات الطاقة في مجال الطيران والدفاع – نبذة عن الشركة
- شركة أميتك
- شركة أمفينول
- شركة أرو للإلكترونيات
- كولينز ايروسبيس (شركة رايثيون تكنولوجيز)
- شركة إيتون المحدودة
- موصلات فيشر SA
- شركة آي تي تي
- موليكس، ذ.م.م
- راديال
- اتصال تي إي

نافين خبيرٌ متمرسٌ في أبحاث السوق والاستشارات، يتمتع بخبرةٍ تزيد عن 9 سنوات في مشاريع مُخصصة ومُشتركة واستشارية. يشغل حاليًا منصب نائب الرئيس المساعد، وقد نجح في إدارة أصحاب المصلحة عبر سلسلة قيمة المشاريع، وألّف أكثر من 100 تقرير بحثي وأكثر من 30 مهمة استشارية. يمتد نطاق عمله ليشمل مشاريع صناعية وحكومية، مساهمًا بشكل كبير في نجاح العملاء واتخاذ القرارات القائمة على البيانات.
نافين حاصلٌ على شهادة في هندسة الإلكترونيات والاتصالات من جامعة فرجينيا التقنية، كارناتاكا، وشهادة ماجستير في إدارة الأعمال في التسويق والعمليات من جامعة مانيبال. وهو عضوٌ نشطٌ في معهد مهندسي الكهرباء والإلكترونيات (IEEE) لمدة 9 سنوات، حيث شارك في مؤتمراتٍ وندواتٍ تقنية، وتطوّع على مستوى الأقسام والمناطق. قبل منصبه الحالي، عمل مستشارًا استراتيجيًا مساعدًا في IndustryARC، ومستشارًا للخوادم الصناعية في شركة هيوليت باكارد (HP Global).
- التحليل التاريخي (سنتان)، سنة الأساس، التوقعات (7 سنوات) مع معدل النمو السنوي المركب
- تحليل PEST و SWOT
- حجم السوق والقيمة / الحجم - عالمي، إقليمي، بلد
- الصناعة والمنافسة
- مجموعة بيانات إكسل
التقارير الحديثة
تقارير ذات صلة
شهادات العملاء
تقرير سوق أنظمة SCADA من Insight Partners شامل، ويقدم رؤى قيّمة حول الاتجاهات الحالية والتوقعات المستقبلية. تميّز الفريق باحترافية عالية وسرعة في الاستجابة ودعم مستمر طوال الوقت. نحن راضون جدًا ونوصي بشدة بخدماتهم.
ران كيديم شريك, شركة ريالي تكنولوجيز المحدودةطلبتُ تقريرًا عن سوق برمجيات محدد، وأعدّه الفريق في غضون أيام قليلة. كانت المعلومات ذات صلة وثيقة وعرضها جيد. ثم طلبتُ بعض التعديلات والإضافات على التقرير. وكان الفريق متجاوبًا للغاية، وحصلتُ على التقرير النهائي في أقل من أسبوع.
جان هيرفيه جين رئيس مجلس الإدارة, فيوتشر أناليتيكاعملنا مع شركة "إنسايت بارتنرز" لإجراء دراسة سوقية وتوقعات مهمة. زودونا برؤى واضحة حول الفرص والمخاطر، مما ساعدنا في صياغة خططنا. كانت أبحاثهم سهلة الاستخدام ومبنية على بيانات دقيقة، مما ساعدنا على اتخاذ قرارات ذكية وواثقة. نوصي بهم بشدة.
بيوش ناجبال نائب الرئيس الأول, شعاع عالي عالميقدّمت شركة Insight Partners أبحاثًا سوقية ثاقبة ومنظمة جيدًا بخبرة واسعة في هذا المجال. تميّز فريقهم بالاحترافية وسرعة الاستجابة طوال الوقت. وسهّل موقعهم الإلكتروني سهل الاستخدام الوصول إلى تقارير القطاع. نوصي بهم بشدة لخدمات بحثية موثوقة وعالية الجودة.
يوكيهيكو أداتشي المدير التنفيذي, ديب بلو، ذ.م.م.هذه أول مرة أشتري فيها تقرير سوق من The Insight Partners. رغم أنني كنت مترددًا في البداية، إلا أنني زرت موقعهم الإلكتروني وشعرت براحة أكبر للمخاطرة وشراء تقرير السوق. أنا راضٍ تمامًا عن جودة التقرير وخدمة العملاء. كانت لديّ عدة أسئلة وتعليقات حول التقرير الأولي، ولكن بعد بضع محادثات عبر البريد الإلكتروني مع محللهم، أعتقد أن لديّ تقريرًا يمكنني استخدامه كمدخل لعملية التخطيط الاستراتيجي لدينا. شكرًا جزيلاً لكم على تخصيص وقتكم الإضافي وجعل هذه التجربة إيجابية. سأوصي بخدماتكم للآخرين بالتأكيد، وستكونون أول من ألجأ إليه عندما نحتاج إلى المزيد من بيانات السوق.
جون سوزوكي الرئيس والرئيس التنفيذي وعضو مجلس الإدارة, بي كيه تكنولوجيزأود أن أقدّر دعمكم واحترافيتكم في الاستجابة لطلبي للحصول على معلومات بشأن سوق التشخيص المخبري للأمراض المعدية في نيجيريا. كما أُقدّر صبركم وتوجيهكم، واستعدادكم لتقديم خصم، مما مكّننا في النهاية من إتمام الصفقة. أتطلع إلى التعامل مع "ذا إنسايت بارتنرز" مستقبلًا، كل ذلك بفضل الانطباع الذي تركتموه لديّ نتيجةً لهذا اللقاء الأول.
الدكتور تشيجيوك أونيا المدير الإداري, شركة باينكريست للرعاية الصحية المحدودةسبب الشراء
- اتخاذ قرارات مدروسة
- فهم ديناميكيات السوق
- تحليل المنافسة
- رؤى العملاء
- توقعات السوق
- تخفيف المخاطر
- التخطيط الاستراتيجي
- مبررات الاستثمار
- تحديد الأسواق الناشئة
- تحسين استراتيجيات التسويق
- تعزيز الكفاءة التشغيلية
- مواكبة التوجهات التنظيمية


 احصل على عينة مجانية ل - سوق موصلات الطاقة في مجال الطيران والدفاع