نظرة عامة على سوق الجرارات الزراعية المدمجة والنمو والاتجاهات والتحليل والتقرير البحثي (2022-2030)
البيانات التاريخية : 2020-2022 | سنة الأساس : 2022 | فترة التنبؤ : 2022-2030حجم سوق الجرارات الزراعية المدمجة وتوقعاته (2020-2030)، والحصة العالمية والإقليمية، والاتجاهات، وتحليل فرص النمو. يغطي التقرير: حسب النوع (دفع ثنائي أو رباعي)، والسعة (أقل من 30 حصانًا، و30-40 حصانًا، و40-60 حصانًا)، والتطبيق (الزراعة والغابات).
- تاريخ التقرير : Mar 2026
- رمز التقرير : TIPRE00023228
- الفئة : التصنيع والبناء
- الحالة : البيانات الصادرة
- تنسيقات التقارير المتاحة :


- عدد الصفحات : 150
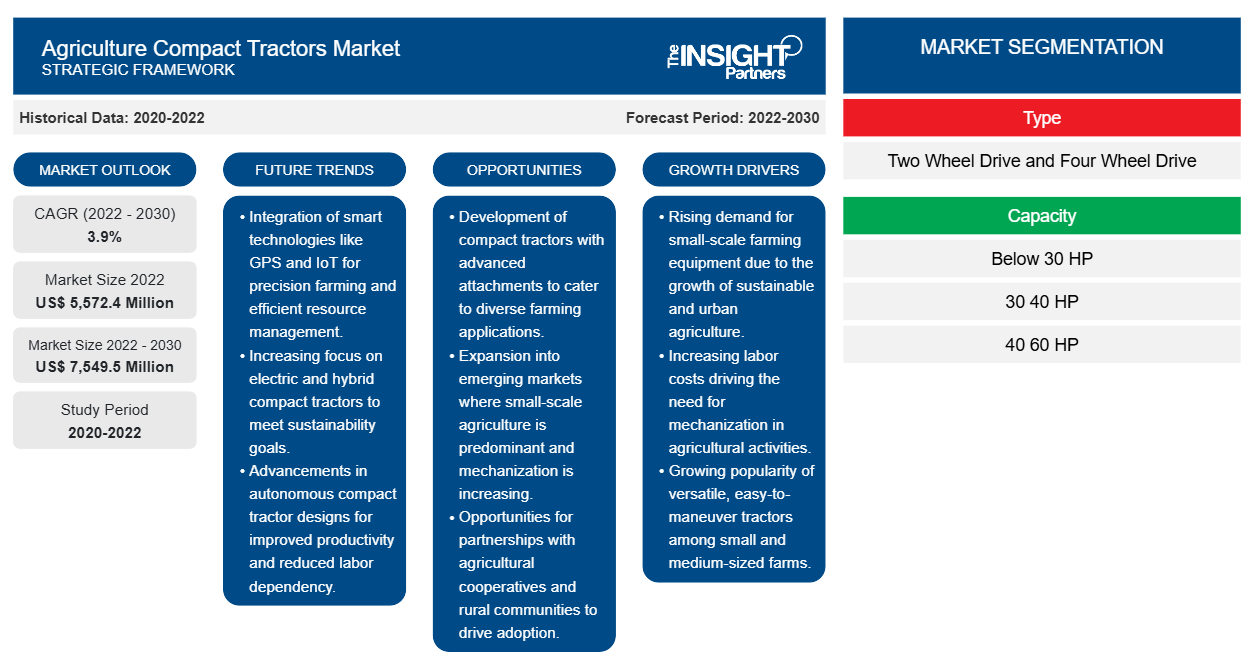
[تقرير بحثي] من المتوقع أن ينمو حجم سوق الجرارات الزراعية المدمجة من 5،572.4 مليون دولار أمريكي في عام 2022 إلى 7،549.5 مليون دولار أمريكي بحلول عام 2030؛ ومن المتوقع أن يسجل السوق معدل نمو سنوي مركب بنسبة 3.9٪ من عام 2022 إلى عام 2030.
وجهة نظر المحلل:
إن قطاع الزراعة المتنامي باستمرار، إلى جانب التفضيل المتزايد للمعدات الحديثة، يدفع نمو سوق الجرارات الزراعية المدمجة العالمية . يتزايد الطلب على الغذاء مع النمو السكاني المستمر. وفقًا للتوقعات الأخيرة التي قدمتها الأمم المتحدة، من المتوقع أن يصل عدد سكان العالم إلى 8.5 مليار بحلول عام 2030 ويزيد إلى 9.7 مليار بحلول عام 2050. ونتيجة لذلك، يتزايد الطلب على المنتجات الزراعية بسرعة، مما يثقل كاهل المزارعين لتعزيز غلة مزارعهم. وبالتالي، فإن الحجم المتزايد للأنشطة الزراعية يدفع الطلب على الجرارات الزراعية المدمجة.
في يناير 2024، قدمت شركة LS Mtron Co.، وهي شركة كورية جنوبية لتصنيع الآلات الثقيلة والمكونات الإلكترونية، سلسلة الجرارات الصغيرة الجديدة MT2·MT2E في أمريكا الشمالية. تم تصميم الطرازين من هذه السلسلة - MT2 المتميز وMT2E الاقتصادي - لتحسين الراحة التشغيلية في الأماكن المحدودة ومناسبة للزراعة على نطاق صغير. تم تصميم مجموعة المنتجات هذه لمختلف الوظائف، بما في ذلك مكوك سهل الاستخدام للعمليات الأمامية والخلفية السلسة، ودواسات مزدوجة مناسبة لنقل التربة أو الحصى. تعمل أنشطة تطوير المنتجات هذه من قبل مصنعي الجرارات الزراعية المدمجة على تغذية نمو سوق الجرارات الزراعية المدمجة.
نظرة عامة على السوق:
تُستخدم الجرارات المدمجة، والمعروفة عادةً باسم الجرارات الخدمية المدمجة، في المقام الأول في الأنشطة الزراعية الصغيرة مثل الحرث والحش والزراعة والحرث والنقل. وهي أصغر حجمًا وسعة، وأكثر فائدة للمزارع الصغيرة ومزارع الفاكهة والمكسرات وكروم العنب والحدائق والمروج. تستهلك الجرارات المدمجة وقودًا أقل وتتطلب صيانة منخفضة، مما يؤدي إلى انخفاض تكاليف التشغيل.
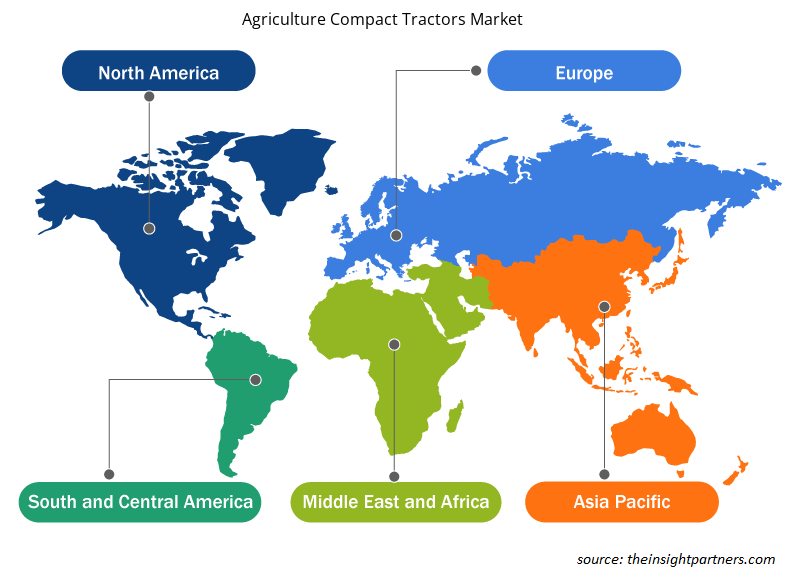
تهيمن منطقة آسيا والمحيط الهادئ على سوق الجرارات الزراعية المدمجة نظرًا للنطاق الواسع للأنشطة الزراعية في دول مثل الصين والهند. ومع ذلك، من المتوقع أن تسجل أمريكا الشمالية وأوروبا قيمًا قوية لمعدل النمو السنوي المركب خلال فترة التوقعات. تعد الولايات المتحدة واحدة من أكبر منتجي المكسرات والفواكه. وفقًا للبيانات التي نشرتها وزارة الزراعة الأمريكية في عام 2022، شكلت المزارع العائلية الصغيرة 88٪ من إجمالي المزارع في الولايات المتحدة. وبالتالي، فإن وجود عدد كبير من المزارع الصغيرة في الولايات المتحدة هو عامل رئيسي يفيد سوق الجرارات الزراعية المدمجة في هذا البلد.
قم بتخصيص هذا التقرير ليناسب متطلباتك
ستحصل على تخصيص لأي تقرير - مجانًا - بما في ذلك أجزاء من هذا التقرير، أو تحليل على مستوى الدولة، وحزمة بيانات Excel، بالإضافة إلى الاستفادة من العروض والخصومات الرائعة للشركات الناشئة والجامعات
سوق الجرارات الزراعية المدمجة: رؤى استراتيجية
-
احصل على أهم اتجاهات السوق الرئيسية لهذا التقرير.ستتضمن هذه العينة المجانية تحليلاً للبيانات، بدءًا من اتجاهات السوق وحتى التقديرات والتوقعات.
محرك السوق:
مبادرات حكومية لدعم صغار المزارعين
تعمل السياسات الحكومية والمبادرات الداعمة مثل التمويل على تعزيز عدد المزارع الصغيرة في مختلف البلدان. على سبيل المثال، تقدم وزارة الزراعة الأمريكية برنامج قروض صغيرة للمزارعين الصغار والمبتدئين، مما يمكنهم من الحصول على ما يصل إلى 35000 دولار أمريكي في شكل قروض من خلال طلبات بسيطة. علاوة على ذلك، في عام 2023، أعلنت حكومة غيانا عن مبادرة من خلال برنامج المسار الوطني لأنظمة الغذاء. وكجزء من هذا المشروع، تم توفير إمدادات المدخلات الزراعية ومنحة نقدية لمرة واحدة لمزارعي الحيازات الصغيرة والمشاركين في برامج التمكين الاجتماعي والاقتصادي المستمرة في جميع أنحاء البلاد. تعمل مثل هذه المبادرات الحكومية على تمكين المزارعين الصغار من تبني المعدات الزراعية، بما في ذلك الجرارات المدمجة. وعلاوة على ذلك، تخلق هذه البرامج والمبادرات بيئة مواتية للمزارع الزراعية الصغيرة في الدول النامية والمتقدمة، مما يؤدي في النهاية إلى توسيع حجم سوق الجرارات الزراعية المدمجة.
التحليل القطاعي:
تم إجراء تحليل سوق الجرارات الزراعية المدمجة من خلال النظر في القطاعات التالية: النوع والسعة والتطبيق. على أساس السعة، يتم تقسيم السوق إلى أقل من 30 حصانًا، و30 حصانًا - 40 حصانًا، و40 حصانًا - 60 حصانًا. تمثل قطاعات 40 حصانًا - 60 حصانًا و30 حصانًا - 40 حصانًا مجتمعة أكثر من 50٪ من حصة سوق الجرارات الزراعية المدمجة. هذه الجرارات مناسبة للمزارع متوسطة الحجم لمهام مثل الحرث والحرث والزراعة والحصاد. على سبيل المثال، أطلقت Farmtrac جرار Farmtrac 60 Powermaxx الجديد في عام 2024. يحتوي هذا الجرار على محرك بقوة 55 حصانًا ويوفر العديد من الميزات.
التحليل الإقليمي:
يشمل النطاق الجغرافي لتقرير سوق الجرارات الزراعية المدمجة أمريكا الشمالية (الولايات المتحدة وكندا والمكسيك) وأوروبا (إسبانيا والمملكة المتحدة وألمانيا وفرنسا وإيطاليا وبقية أوروبا) وآسيا والمحيط الهادئ (كوريا الجنوبية والصين والهند واليابان وأستراليا وبقية آسيا والمحيط الهادئ) والشرق الأوسط وأفريقيا (جنوب أفريقيا والمملكة العربية السعودية والإمارات العربية المتحدة وبقية الشرق الأوسط وأفريقيا) وأمريكا الجنوبية والوسطى (البرازيل والأرجنتين وبقية أمريكا الجنوبية والوسطى). استحوذت منطقة آسيا والمحيط الهادئ على أكبر حصة في سوق الجرارات الزراعية المدمجة في عام 2022.
تنقسم سوق الجرارات الزراعية المدمجة في أمريكا الشمالية إلى الولايات المتحدة وكندا والمكسيك. يقود قطاع الزراعة في أمريكا الشمالية، وخاصة في دول مثل الولايات المتحدة وكندا والمكسيك، الطلب بشكل كبير على الجرارات الزراعية المدمجة. سيستمر توسع قطاع الزراعة والتطوير المستمر للمنتجات في تعزيز السوق في هذه المنطقة في المستقبل. وفقًا للبيانات التي نشرتها وزارة الزراعة الأمريكية في عام 2021، ساهم قطاع الزراعة بحوالي 1.264 تريليون دولار أمريكي في الناتج المحلي الإجمالي للولايات المتحدة في عام 2021، وهو ما يمثل 5.4٪ من الناتج المحلي الإجمالي الوطني. وفقًا للبيانات التي نشرتها الحكومة الكندية في عام 2022، يساهم قطاع الزراعة والأغذية الزراعية بشكل كبير في الاقتصاد الكندي. بلغت مبيعات السلع الزراعية الكندية، التي تنمو بمعدل سنوي قدره 5.6٪، 87.7 مليار دولار أمريكي في عام 2022. يؤدي العدد المتزايد من المزارع الصغيرة إلى زيادة الطلب على الجرارات المدمجة، مما يوفر سبل نمو جديدة للبائعين. علاوة على ذلك، يركز العديد من اللاعبين الرئيسيين في الولايات المتحدة الآن على تطوير الجرارات المدمجة الآلية بالكامل، ومن المتوقع أن تؤدي مثل هذه التطورات إلى ظهور اتجاهات جديدة لسوق الجرارات الزراعية المدمجة في أمريكا الشمالية في السنوات القادمة.
رؤى إقليمية حول سوق الجرارات الزراعية المدمجة
لقد قام المحللون في Insight Partners بشرح الاتجاهات والعوامل الإقليمية المؤثرة على سوق الجرارات الزراعية المدمجة طوال فترة التوقعات بشكل شامل. يناقش هذا القسم أيضًا قطاعات سوق الجرارات الزراعية المدمجة والجغرافيا في جميع أنحاء أمريكا الشمالية وأوروبا ومنطقة آسيا والمحيط الهادئ والشرق الأوسط وأفريقيا وأمريكا الجنوبية والوسطى.
- احصل على البيانات الإقليمية المحددة لسوق الجرارات الزراعية المدمجة
نطاق تقرير سوق الجرارات الزراعية المدمجة
| سمة التقرير | تفاصيل |
|---|---|
| حجم السوق في عام 2022 | 5,572.4 مليون دولار أمريكي |
| حجم السوق بحلول عام 2030 | 7,549.5 مليون دولار أمريكي |
| معدل النمو السنوي المركب العالمي (2022 - 2030) | 3.9% |
| البيانات التاريخية | 2020-2022 |
| فترة التنبؤ | 2022-2030 |
| القطاعات المغطاة |
حسب النوع
|
| المناطق والدول المغطاة |
أمريكا الشمالية
|
| قادة السوق وملفات تعريف الشركات الرئيسية |
|
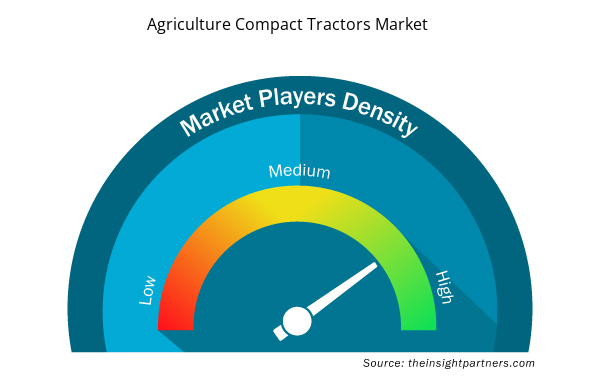
كثافة اللاعبين في سوق الجرارات الزراعية المدمجة: فهم تأثيرها على ديناميكيات الأعمال
يشهد سوق الجرارات الزراعية المدمجة نموًا سريعًا، مدفوعًا بالطلب المتزايد من المستخدم النهائي بسبب عوامل مثل تفضيلات المستهلكين المتطورة والتقدم التكنولوجي والوعي المتزايد بفوائد المنتج. ومع ارتفاع الطلب، تعمل الشركات على توسيع عروضها والابتكار لتلبية احتياجات المستهلكين والاستفادة من الاتجاهات الناشئة، مما يؤدي إلى زيادة نمو السوق.
تشير كثافة اللاعبين في السوق إلى توزيع الشركات أو المؤسسات العاملة في سوق أو صناعة معينة. وهي تشير إلى عدد المنافسين (اللاعبين في السوق) الموجودين في مساحة سوق معينة نسبة إلى حجمها أو قيمتها السوقية الإجمالية.
الشركات الرئيسية العاملة في سوق الجرارات الزراعية المدمجة هي:
- جرار يانمار
- ماهيندرا
- شركة TYM
- سوليكتراك
- جون ديري
إخلاء المسؤولية : الشركات المذكورة أعلاه ليست مرتبة بأي ترتيب معين.
- احصل على نظرة عامة على أهم اللاعبين الرئيسيين في سوق الجرارات الزراعية المدمجة
تحليل اللاعب الرئيسي:
تعد شركة AGCO GmbH، وYamaha Tractors، وSolis، وBobcat Company، وMahindra Tractors، وKubota، وJohn Deere، وMassey Ferguson، وNew Holland من بين اللاعبين البارزين الذين تم عرضهم في تقرير سوق الجرارات الزراعية المدمجة. بالإضافة إلى هؤلاء اللاعبين، تمت دراسة العديد من الشركات المهمة الأخرى وتحليلها خلال هذه الدراسة للحصول على نظرة عامة شاملة على سوق الجرارات الزراعية المدمجة العالمية.
التطورات الأخيرة:
تتبنى الشركات في سوق الجرارات الزراعية المدمجة العالمية بشكل كبير الاستراتيجيات غير العضوية والعضوية مثل عمليات الدمج والاستحواذ. وفيما يلي بعض التطورات الأخيرة التي قام بها كبار اللاعبين في سوق الجرارات الزراعية المدمجة، وفقًا للبيانات الصحفية:
سنة |
أخبار |
منطقة |
|
أغسطس 2023 |
أطلقت شركة Case IH جراراتها الجديدة Farmall Subcompact 25SC. هذا الطراز الجديد هو أصغر جرار في مجموعة Case IH. يتمتع الجرار الجديد بمحرك بقوة تتراوح من 25 حصانًا إلى 115 حصانًا. |
منطقة آسيا والمحيط الهادئ |
|
فبراير 2023 |
طرحت شركة Bobcat مجموعة جديدة من الجرارات الصغيرة، والتي أطلق عليها اسم السلسلة 1000 و2000 و4000. وتضم السلسلة تسعة نماذج من الجرارات الصغيرة التي تختلف على أساس قوة المحرك. وتتراوح قوة هذه الجرارات بين 25 إلى 85 حصانًا. |
أوروبا |

نيفيديتا خبيرة أبحاث مُتميزة، تتمتع بخبرة تزيد عن 9 سنوات في أبحاث السوق واستشارات الأعمال. تشغل حاليًا منصب مديرة مشاريع في مجال تكنولوجيا المعلومات والاتصالات لدى شركة "ذا إنسايت بارتنرز"، وتتمتع بخبرة واسعة في إدارة وتنفيذ مهام الأبحاث المُجمعة والمُخصصة والقائمة على الاشتراكات والاستشارات في مختلف قطاعات التكنولوجيا.
بفضل سجلها الحافل في تقديم تحليلات قائمة على البيانات ورؤى عملية، ساهمت نيفيديتا بشكل رئيسي في العديد من المشاريع الحيوية. يشمل عملها تنفيذ المشاريع من البداية إلى النهاية، بدءًا من فهم أهداف العملاء، وتحليل اتجاهات السوق، وصولًا إلى استخلاص التوصيات الاستراتيجية. وقد تعاونت على نطاق واسع مع شركات رائدة في مجال تكنولوجيا المعلومات والاتصالات، مما ساعدها على تحديد فرص السوق ومواكبة تحولات القطاع.
تحمل نيفيديتا ماجستير إدارة أعمال في الإدارة من شركة "آي إم إس" في دهرادون. قبل انضمامها إلى "ذا إنسايت بارتنرز"، اكتسبت خبرة قيّمة في شركتي "ماركتس آند ماركتس" و"فيوتشر ماركت إنسايتس" في بونا، حيث شغلت مناصب بحثية مُختلفة وبنت أساسًا قويًا في تحليل القطاع والتفاعل مع العملاء.
- التحليل التاريخي (سنتان)، سنة الأساس، التوقعات (7 سنوات) مع معدل النمو السنوي المركب
- تحليل PEST و SWOT
- حجم السوق والقيمة / الحجم - عالمي، إقليمي، بلد
- الصناعة والمنافسة
- مجموعة بيانات إكسل
التقارير الحديثة
شهادات العملاء
تقرير سوق أنظمة SCADA من Insight Partners شامل، ويقدم رؤى قيّمة حول الاتجاهات الحالية والتوقعات المستقبلية. تميّز الفريق باحترافية عالية وسرعة في الاستجابة ودعم مستمر طوال الوقت. نحن راضون جدًا ونوصي بشدة بخدماتهم.
ران كيديم شريك, شركة ريالي تكنولوجيز المحدودةطلبتُ تقريرًا عن سوق برمجيات محدد، وأعدّه الفريق في غضون أيام قليلة. كانت المعلومات ذات صلة وثيقة وعرضها جيد. ثم طلبتُ بعض التعديلات والإضافات على التقرير. وكان الفريق متجاوبًا للغاية، وحصلتُ على التقرير النهائي في أقل من أسبوع.
جان هيرفيه جين رئيس مجلس الإدارة, فيوتشر أناليتيكاعملنا مع شركة "إنسايت بارتنرز" لإجراء دراسة سوقية وتوقعات مهمة. زودونا برؤى واضحة حول الفرص والمخاطر، مما ساعدنا في صياغة خططنا. كانت أبحاثهم سهلة الاستخدام ومبنية على بيانات دقيقة، مما ساعدنا على اتخاذ قرارات ذكية وواثقة. نوصي بهم بشدة.
بيوش ناجبال نائب الرئيس الأول, شعاع عالي عالميقدّمت شركة Insight Partners أبحاثًا سوقية ثاقبة ومنظمة جيدًا بخبرة واسعة في هذا المجال. تميّز فريقهم بالاحترافية وسرعة الاستجابة طوال الوقت. وسهّل موقعهم الإلكتروني سهل الاستخدام الوصول إلى تقارير القطاع. نوصي بهم بشدة لخدمات بحثية موثوقة وعالية الجودة.
يوكيهيكو أداتشي المدير التنفيذي, ديب بلو، ذ.م.م.هذه أول مرة أشتري فيها تقرير سوق من The Insight Partners. رغم أنني كنت مترددًا في البداية، إلا أنني زرت موقعهم الإلكتروني وشعرت براحة أكبر للمخاطرة وشراء تقرير السوق. أنا راضٍ تمامًا عن جودة التقرير وخدمة العملاء. كانت لديّ عدة أسئلة وتعليقات حول التقرير الأولي، ولكن بعد بضع محادثات عبر البريد الإلكتروني مع محللهم، أعتقد أن لديّ تقريرًا يمكنني استخدامه كمدخل لعملية التخطيط الاستراتيجي لدينا. شكرًا جزيلاً لكم على تخصيص وقتكم الإضافي وجعل هذه التجربة إيجابية. سأوصي بخدماتكم للآخرين بالتأكيد، وستكونون أول من ألجأ إليه عندما نحتاج إلى المزيد من بيانات السوق.
جون سوزوكي الرئيس والرئيس التنفيذي وعضو مجلس الإدارة, بي كيه تكنولوجيزأود أن أقدّر دعمكم واحترافيتكم في الاستجابة لطلبي للحصول على معلومات بشأن سوق التشخيص المخبري للأمراض المعدية في نيجيريا. كما أُقدّر صبركم وتوجيهكم، واستعدادكم لتقديم خصم، مما مكّننا في النهاية من إتمام الصفقة. أتطلع إلى التعامل مع "ذا إنسايت بارتنرز" مستقبلًا، كل ذلك بفضل الانطباع الذي تركتموه لديّ نتيجةً لهذا اللقاء الأول.
الدكتور تشيجيوك أونيا المدير الإداري, شركة باينكريست للرعاية الصحية المحدودةسبب الشراء
- اتخاذ قرارات مدروسة
- فهم ديناميكيات السوق
- تحليل المنافسة
- رؤى العملاء
- توقعات السوق
- تخفيف المخاطر
- التخطيط الاستراتيجي
- مبررات الاستثمار
- تحديد الأسواق الناشئة
- تحسين استراتيجيات التسويق
- تعزيز الكفاءة التشغيلية
- مواكبة التوجهات التنظيمية


 احصل على عينة مجانية ل - سوق الجرارات الزراعية المدمجة