نمو سوق المحولات التناظرية إلى الرقمية والحجم والمشاركة والاتجاهات وتحليل اللاعبين الرئيسيين والتوقعات حتى عام 2030
البيانات التاريخية : 2021-2022 | سنة الأساس : 2022 | فترة التنبؤ : 2023-2031حجم سوق المحولات التناظرية إلى الرقمية وتوقعاتها (2020-2030)، والحصة العالمية والإقليمية، والاتجاهات، وفرص النمو. يغطي التقرير: حسب النوع (دمج المحولات التناظرية إلى الرقمية، ومحولات دلتا سيجما التناظرية إلى الرقمية، ومحولات التقريب المتتالية التناظرية إلى الرقمية، ومحولات رامب التناظرية إلى الرقمية، وغيرها)، والدقة (8 بت، 10 بت، 12 بت، 14 بت، 16 بت، وغيرها)، والتطبيق (الصناعة، والإلكترونيات الاستهلاكية، والسيارات، والرعاية الصحية، والاتصالات، وغيرها)، والجغرافيا.
- تاريخ التقرير : Dec 2023
- رمز التقرير : TIPRE00034165
- الفئة : الإلكترونيات وأشباه الموصلات
- الحالة : نُشرت
- تنسيقات التقارير المتاحة :


- عدد الصفحات : 208
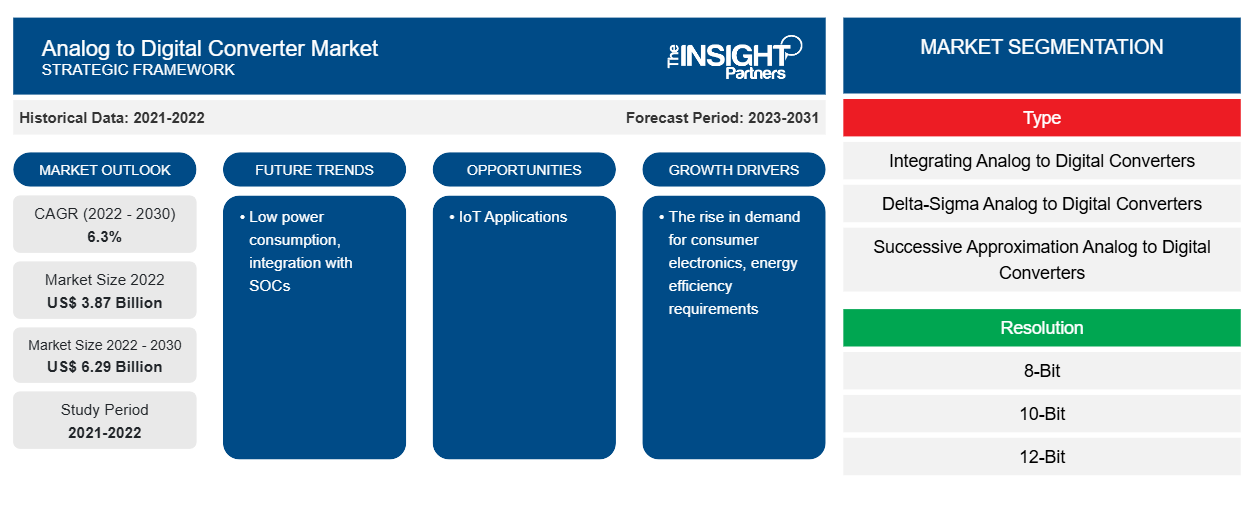
من المتوقع أن يصل حجم سوق المحولات التناظرية إلى الرقمية إلى 6.29 مليار دولار أمريكي بحلول عام 2030 من 3.87 مليار دولار أمريكي في عام 2022. ومن المتوقع أن يسجل السوق معدل نمو سنوي مركب بنسبة 6.3٪ خلال الفترة 2022-2030. ومن المرجح أن يظل انخفاض استهلاك الطاقة والتكامل مع أنظمة التشغيل المتكاملة (SOCs) اتجاهًا رئيسيًا في السوق.
تحليل سوق المحولات التناظرية إلى الرقمية
تلعب محولات البيانات دورًا حاسمًا في تمكين المحتوى عالي الدقة لتجربة تشغيل موسيقى عالية الجودة للغاية. تعمل هذه المحولات على تصفية الضوضاء غير المرغوب فيها وضمان انخفاض استهلاك الطاقة لزيادة عمر بطارية الأجهزة مثل سماعات الرأس. شهد المصنعون مطالب متزايدة لسرعة تحويل أسرع ودقة أعلى. هناك العديد من التطورات الجارية في سوق المحولات التناظرية إلى الرقمية لتحقيق دقة أعلى ونطاق ديناميكي أوسع وتوافق فعال. ساعدت التطورات في تقنيات أخذ العينات الزائدة الجديدة بشكل بارز في خفض تكلفة المحولات. وفقًا للعديد من الشركات المصنعة، يُعزى الطلب على دقة أعلى بين مصممي أنظمة اكتساب البيانات إلى هدفهم المتمثل في الاستفادة من كل بت من الدقة. توفر المحولات ذات الدقة العالية تفاصيل مهمة وإضافية حول البيانات.
من المتوقع أن تفتح التطورات في مجال الاتصالات، مثل طرح تقنية الجيل الخامس، مجالات تطبيق جديدة للمحولات التناظرية إلى الرقمية. يتم دمج المحول التناظري إلى الرقمي (ADC) في محطات قاعدة الجيل الخامس لتحويل القيم التناظرية إلى قيم رقمية لصالح المستخدمين. تشهد دول مثل الهند والصين والولايات المتحدة وألمانيا والبرازيل ارتفاعًا في تجارب الجيل الخامس. علاوة على ذلك، تُستخدم المحولات التناظرية إلى الرقمية أيضًا في قطاع السيارات ولها تطبيقات في أنظمة الاتصالات عن بعد و LiDAR. هناك حاجة إلى المحولات التناظرية إلى الرقمية في عدد لا يحصى من الصناعات، مثل أشباه الموصلات والسيارات والاتصالات والصناعة. كما تُستخدم أيضًا في تصوير أجهزة اقتران الشحنة (CCD)، بما في ذلك الماسحات الضوئية والكاميرات الرقمية وكاميرات الفيديو وأجهزة الاختبار.
نظرة عامة على سوق المحولات التناظرية إلى الرقمية
تساعد المحولات التناظرية إلى الرقمية (ADCs) في تحويل البيانات من الإشارات التناظرية المستلمة من الظواهر البيئية إلى إشارات رقمية. تتضمن عملية التحويل بالكامل عدة خطوات، مثل أخذ العينات والتكميم والترميز. تعد المحولات التناظرية إلى الرقمية المكونات الأساسية حيث يجب تحويل القيم التناظرية إلى قيم رقمية لمزيد من المعالجة. تشمل الأنواع المختلفة من المحولات التناظرية إلى الرقمية الموجودة في السوق المحولات التناظرية إلى الرقمية المتزامنة أو السريعة، والمحولات التناظرية إلى الرقمية من النوع المتتبع، والمحولات التناظرية إلى الرقمية من النوع المضاد، والمحولات التناظرية إلى الرقمية من النوع التقريبي المتتالي، والمحولات التناظرية إلى الرقمية من نوع سيجما دلتا، والمحولات التناظرية إلى الرقمية أحادية وثنائية ومتعددة المنحدرات. تجد هذه المحولات تطبيقات في معالجة الإشارات الرقمية (المتحكمات الدقيقة، وبطاقات موالف التلفزيون، ومذبذبات التخزين الرقمية)، والأجهزة العلمية (أنظمة التصوير الرقمي، وأجهزة استشعار درجة الحرارة ، وأنظمة الرادار)، والصوت الرقمي (التسجيل الصوتي، ومحطات العمل الصوتية الرقمية، وتعديل شفرة النبض).
قم بتخصيص هذا التقرير ليناسب متطلباتك
ستحصل على تخصيص لأي تقرير - مجانًا - بما في ذلك أجزاء من هذا التقرير، أو تحليل على مستوى الدولة، وحزمة بيانات Excel، بالإضافة إلى الاستفادة من العروض والخصومات الرائعة للشركات الناشئة والجامعات
سوق المحولات التناظرية إلى الرقمية: رؤى استراتيجية
-
احصل على أهم اتجاهات السوق الرئيسية لهذا التقرير.ستتضمن هذه العينة المجانية تحليلاً للبيانات، بدءًا من اتجاهات السوق وحتى التقديرات والتوقعات.
محركات وفرص سوق المحولات التناظرية إلى الرقمية
ارتفاع الطلب على الأجهزة الإلكترونية الاستهلاكية لصالح السوق
كان التوسع الحضري المتزايد وارتفاع الدخل المتاح من أهم العوامل التي مكنت انتشار صناعة الإلكترونيات. وفقًا لمكتب التحليل الاقتصادي الأمريكي، في مارس 2023، ارتفع الدخل الشخصي المتاح (DPI) في الولايات المتحدة بنسبة 0.5٪ في فبراير 2023 مقارنة بشهر يناير 2023. يساهم نمو الدخل المتاح للأشخاص في القوة الشرائية القوية، مما يعزز مبيعات أجهزة التلفزيون والميكروويف وغيرها من الأجهزة الإلكترونية الاستهلاكية . علاوة على ذلك، تلعب زيادة المبادرات الحكومية لتعزيز الناتج المحلي للإنتاج دورًا حاسمًا في تعزيز الصناعة الإلكترونية في مختلف البلدان. وفقًا لوزارة الإلكترونيات وتكنولوجيا المعلومات، من المتوقع أن يصل تصنيع الإلكترونيات الهندي في مارس 2023 إلى 300 مليار دولار أمريكي بحلول عام 2025-2026. تعمل الخطوات والمبادرات الاستراتيجية للحكومة على دعم تقدم صناعة الإلكترونيات. بموجب السياسة الوطنية الهندية للإلكترونيات 2019 (NPE 2019)، يتم تقديم مخططات خاصة لتصنيع الإلكترونيات على نطاق واسع.
إن الطلب المتزايد باستمرار على الأجهزة الإلكترونية الاستهلاكية مثل الهواتف الذكية والأجهزة اللوحية وأجهزة التلفزيون الذكية وأجهزة الألعاب وأجهزة الواقع المعزز والواقع الافتراضي ومكبرات الصوت الذكية يعمل على دفع صناعة الإلكترونيات الاستهلاكية إلى الأمام. يتم استخدام المحولات التناظرية إلى الرقمية في أكثر الأجهزة الإلكترونية والتطبيقات تقدمًا. فهي تساعد في تحويل المدخلات في العالم الحقيقي إلى إشارة رقمية للمعالجة والتخزين. إن الطلب المتزايد على المحولات التناظرية إلى الرقمية الصوتية في تصنيع أنظمة الصوت الاستهلاكية وأنظمة المسرح المنزلي يعمل على زيادة نمو سوق المحولات التناظرية إلى الرقمية.
تطبيقات إنترنت الأشياء
تظهر أجهزة الاستشعار كعوامل لا غنى عنها في النظام البيئي المعقد لإنترنت الأشياء (IoT)، حيث تراقب مجموعة واسعة من الخصائص الفيزيائية مثل درجة الحرارة والرطوبة والضغط والضوء والحركة وغير ذلك الكثير. توفر معظم أجهزة الاستشعار إشارات تناظرية ترتبط بالظواهر الفيزيائية التي من المفترض أن تقيسها. ومع ذلك، من أجل جمع بيانات المستشعر وتحليلها ونقلها بشكل فعال عبر شبكات إنترنت الأشياء، يجب تحويل الإشارة التناظرية إلى تنسيق رقمي. يتم تنفيذ هذه المهمة الحاسمة بواسطة محولات التناظرية إلى الرقمية (ADCs).
تقرير تحليل تجزئة سوق المحولات التناظرية إلى الرقمية
إن القطاعات الرئيسية التي ساهمت في اشتقاق تحليل سوق المحول التناظري إلى الرقمي هي نوع الاستشعار والاتجاه الحالي والمستخدم النهائي.
- بناءً على النوع، ينقسم سوق المحولات التناظرية إلى الرقمية إلى محولات تناظرية إلى رقمية متكاملة، ومحولات دلتا سيجما التناظرية إلى الرقمية، ومحولات التقريب التناظري إلى الرقمي المتتالية، ومحولات المنحدر التناظرية إلى الرقمية، وغيرها. احتل قطاع المحولات التناظرية إلى الرقمية المتتالية التقريب الحصة الأكبر في عام 2023.
- من حيث الدقة، يتم تقسيم السوق إلى 8 بت، و10 بت، و12 بت، و14 بت، و16 بت، وغيرها.
- حسب التطبيق، يتم تقسيم السوق إلى الصناعة، والإلكترونيات الاستهلاكية، والسيارات، والرعاية الصحية، والاتصالات، وغيرها.
تحليل حصة سوق المحولات التناظرية إلى الرقمية حسب المنطقة الجغرافية
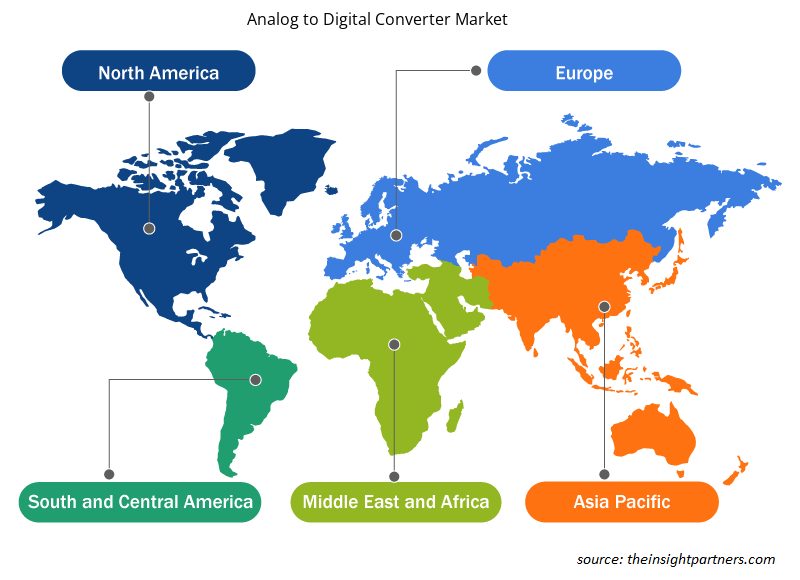
ينقسم النطاق الجغرافي لتقرير سوق المحول التناظري إلى الرقمي بشكل أساسي إلى خمس مناطق: أمريكا الشمالية، وآسيا والمحيط الهادئ، وأوروبا، والشرق الأوسط وأفريقيا، وأمريكا الجنوبية والوسطى.
سيطرت أمريكا الشمالية على حصة سوق المحولات التناظرية إلى الرقمية في عام 2022. تم تقسيم سوق أمريكا الشمالية إلى الولايات المتحدة وكندا والمكسيك. استحوذت الولايات المتحدة على أكبر حصة في سوق المحولات التناظرية إلى الرقمية في أمريكا الشمالية في عام 2022. تعد البلاد موطنًا للاعبين الرئيسيين في السوق مثل Analog Devices، Inc.؛ Cirrus Logic، Inc.؛ Microchip Technology، Inc.؛ و Texas Instruments Incorporated. تعد الولايات المتحدة مركزًا للتصنيع وتكنولوجيا المعلومات والسيارات، من بين القطاعات الأخرى التي تتطلب حلولاً متقدمة تقنيًا للدقة في الإنتاج والعمليات الأخرى. يعد قانون البنية التحتية الحزبي، الذي وقعه الرئيس الأمريكي بايدن، استثمارًا لمرة واحدة في الجيل في البنية التحتية للولايات المتحدة. إن الارتفاع المتوقع في البنية التحتية للاتصالات مع مثل هذه المبادرات يعزز اعتماد المحولات التناظرية إلى الرقمية في أمريكا الشمالية.
رؤى إقليمية حول سوق المحولات التناظرية إلى الرقمية
لقد قام المحللون في Insight Partners بشرح الاتجاهات والعوامل الإقليمية المؤثرة على سوق المحولات التناظرية إلى الرقمية طوال فترة التوقعات بشكل شامل. يناقش هذا القسم أيضًا قطاعات سوق المحولات التناظرية إلى الرقمية والجغرافيا في جميع أنحاء أمريكا الشمالية وأوروبا ومنطقة آسيا والمحيط الهادئ والشرق الأوسط وأفريقيا وأمريكا الجنوبية والوسطى.
- احصل على البيانات الإقليمية المحددة لسوق المحولات التناظرية إلى الرقمية
نطاق تقرير سوق المحولات التناظرية إلى الرقمية
| سمة التقرير | تفاصيل |
|---|---|
| حجم السوق في عام 2022 | 3.87 مليار دولار أمريكي |
| حجم السوق بحلول عام 2030 | 6.29 مليار دولار أمريكي |
| معدل النمو السنوي المركب العالمي (2022 - 2030) | 6.3% |
| البيانات التاريخية | 2021-2022 |
| فترة التنبؤ | 2023-2031 |
| القطاعات المغطاة |
حسب النوع
|
| المناطق والدول المغطاة |
أمريكا الشمالية
|
| قادة السوق وملفات تعريف الشركات الرئيسية |
|
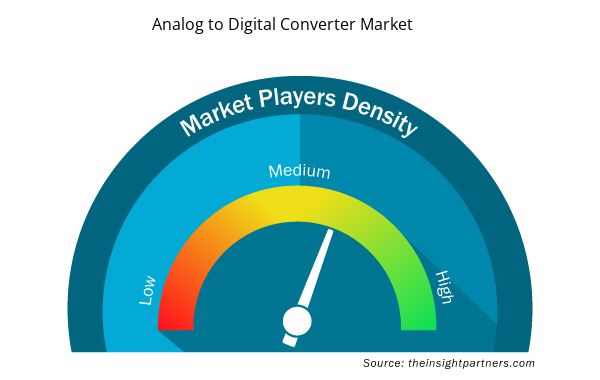
كثافة اللاعبين في سوق المحولات التناظرية إلى الرقمية: فهم تأثيرها على ديناميكيات الأعمال
يشهد سوق المحولات التناظرية إلى الرقمية نموًا سريعًا، مدفوعًا بالطلب المتزايد من المستخدم النهائي بسبب عوامل مثل تفضيلات المستهلك المتطورة والتقدم التكنولوجي والوعي المتزايد بفوائد المنتج. ومع ارتفاع الطلب، تعمل الشركات على توسيع عروضها والابتكار لتلبية احتياجات المستهلكين والاستفادة من الاتجاهات الناشئة، مما يؤدي إلى زيادة نمو السوق.
تشير كثافة اللاعبين في السوق إلى توزيع الشركات أو المؤسسات العاملة في سوق أو صناعة معينة. وهي تشير إلى عدد المنافسين (اللاعبين في السوق) الموجودين في مساحة سوق معينة نسبة إلى حجمها أو قيمتها السوقية الإجمالية.
الشركات الرئيسية العاملة في سوق المحولات التناظرية إلى الرقمية هي:
- شركة أساهي كاساي للأجهزة الدقيقة
- شركة انالوج ديفايسز
- شركة سيروس لوجيك
- شركة مايكرو شيب للتكنولوجيا
- صناعات مكونات أشباه الموصلات
- شركة LL ROHM المحدودة
إخلاء المسؤولية : الشركات المذكورة أعلاه ليست مرتبة بأي ترتيب معين.
- احصل على نظرة عامة على أهم اللاعبين الرئيسيين في سوق المحولات التناظرية إلى الرقمية
أخبار سوق المحولات التناظرية إلى الرقمية والتطورات الأخيرة
يتم تقييم سوق المحولات التناظرية إلى الرقمية من خلال جمع البيانات النوعية والكمية بعد البحث الأولي والثانوي، والذي يتضمن منشورات الشركات المهمة وبيانات الجمعيات وقواعد البيانات. فيما يلي بعض التطورات في سوق المحولات التناظرية إلى الرقمية:
- كشفت شركة Agile Analog عن أول محولات رقمية تناظرية إلى رقمية قابلة للتخصيص وذات 12 بت، والتي لا تعتمد على عملية معينة، استجابة للطلب المتزايد على هذه المحولات للحصول على دقة أعلى. (المصدر: Agile Analog، بيان صحفي، فبراير 2023)
- أطلقت شركة Renesas Electronics Corporation منتجًا جديدًا لعائلة متحكمات RL78 (MCU) الشهيرة، والتي تتضمن أجهزة 8 و16 بت للتطبيقات الحساسة للطاقة. إحدى الميزات الرئيسية لسلسلة RL78/G24 التي تم إطلاقها حديثًا هي محولها التناظري إلى الرقمي 12 بت، القادر على أخذ عينات متزامنة من 3 قنوات بسرعة تحويل قصوى تبلغ 1 ميكروثانية (µs). (المصدر: Renesas Electronics Corporation، بيان صحفي، مارس 2019)
تقرير سوق المحولات التناظرية إلى الرقمية والتغطية والنتائج المتوقعة
يوفر تقرير "حجم سوق المحول التناظري إلى الرقمي والتوقعات (2020-2030)" تحليلاً مفصلاً للسوق يغطي المجالات التالية:
- حجم سوق المحولات التناظرية إلى الرقمية وتوقعاتها على المستويات العالمية والإقليمية والوطنية لجميع قطاعات السوق الرئيسية التي يغطيها النطاق
- اتجاهات سوق المحولات التناظرية إلى الرقمية، بالإضافة إلى ديناميكيات السوق مثل المحركات والقيود والفرص الرئيسية
- تحليل مفصل لقوى PEST/Porter الخمس وSWOT
- تحليل سوق المحولات التناظرية إلى الرقمية يغطي اتجاهات السوق الرئيسية والإطار العالمي والإقليمي والجهات الفاعلة الرئيسية واللوائح والتطورات الأخيرة في السوق
- تحليل المشهد الصناعي والمنافسة الذي يغطي تركيز السوق، وتحليل خريطة الحرارة، واللاعبين البارزين، والتطورات الأخيرة في سوق المحول التناظري إلى الرقمي
- ملفات تعريف الشركة التفصيلية

نافين خبيرٌ متمرسٌ في أبحاث السوق والاستشارات، يتمتع بخبرةٍ تزيد عن 9 سنوات في مشاريع مُخصصة ومُشتركة واستشارية. يشغل حاليًا منصب نائب الرئيس المساعد، وقد نجح في إدارة أصحاب المصلحة عبر سلسلة قيمة المشاريع، وألّف أكثر من 100 تقرير بحثي وأكثر من 30 مهمة استشارية. يمتد نطاق عمله ليشمل مشاريع صناعية وحكومية، مساهمًا بشكل كبير في نجاح العملاء واتخاذ القرارات القائمة على البيانات.
نافين حاصلٌ على شهادة في هندسة الإلكترونيات والاتصالات من جامعة فرجينيا التقنية، كارناتاكا، وشهادة ماجستير في إدارة الأعمال في التسويق والعمليات من جامعة مانيبال. وهو عضوٌ نشطٌ في معهد مهندسي الكهرباء والإلكترونيات (IEEE) لمدة 9 سنوات، حيث شارك في مؤتمراتٍ وندواتٍ تقنية، وتطوّع على مستوى الأقسام والمناطق. قبل منصبه الحالي، عمل مستشارًا استراتيجيًا مساعدًا في IndustryARC، ومستشارًا للخوادم الصناعية في شركة هيوليت باكارد (HP Global).
- التحليل التاريخي (سنتان)، سنة الأساس، التوقعات (7 سنوات) مع معدل النمو السنوي المركب
- تحليل PEST و SWOT
- حجم السوق والقيمة / الحجم - عالمي، إقليمي، بلد
- الصناعة والمنافسة
- مجموعة بيانات إكسل
التقارير الحديثة
تقارير ذات صلة
شهادات العملاء
تقرير سوق أنظمة SCADA من Insight Partners شامل، ويقدم رؤى قيّمة حول الاتجاهات الحالية والتوقعات المستقبلية. تميّز الفريق باحترافية عالية وسرعة في الاستجابة ودعم مستمر طوال الوقت. نحن راضون جدًا ونوصي بشدة بخدماتهم.
ران كيديم شريك, شركة ريالي تكنولوجيز المحدودةطلبتُ تقريرًا عن سوق برمجيات محدد، وأعدّه الفريق في غضون أيام قليلة. كانت المعلومات ذات صلة وثيقة وعرضها جيد. ثم طلبتُ بعض التعديلات والإضافات على التقرير. وكان الفريق متجاوبًا للغاية، وحصلتُ على التقرير النهائي في أقل من أسبوع.
جان هيرفيه جين رئيس مجلس الإدارة, فيوتشر أناليتيكاعملنا مع شركة "إنسايت بارتنرز" لإجراء دراسة سوقية وتوقعات مهمة. زودونا برؤى واضحة حول الفرص والمخاطر، مما ساعدنا في صياغة خططنا. كانت أبحاثهم سهلة الاستخدام ومبنية على بيانات دقيقة، مما ساعدنا على اتخاذ قرارات ذكية وواثقة. نوصي بهم بشدة.
بيوش ناجبال نائب الرئيس الأول, شعاع عالي عالميقدّمت شركة Insight Partners أبحاثًا سوقية ثاقبة ومنظمة جيدًا بخبرة واسعة في هذا المجال. تميّز فريقهم بالاحترافية وسرعة الاستجابة طوال الوقت. وسهّل موقعهم الإلكتروني سهل الاستخدام الوصول إلى تقارير القطاع. نوصي بهم بشدة لخدمات بحثية موثوقة وعالية الجودة.
يوكيهيكو أداتشي المدير التنفيذي, ديب بلو، ذ.م.م.هذه أول مرة أشتري فيها تقرير سوق من The Insight Partners. رغم أنني كنت مترددًا في البداية، إلا أنني زرت موقعهم الإلكتروني وشعرت براحة أكبر للمخاطرة وشراء تقرير السوق. أنا راضٍ تمامًا عن جودة التقرير وخدمة العملاء. كانت لديّ عدة أسئلة وتعليقات حول التقرير الأولي، ولكن بعد بضع محادثات عبر البريد الإلكتروني مع محللهم، أعتقد أن لديّ تقريرًا يمكنني استخدامه كمدخل لعملية التخطيط الاستراتيجي لدينا. شكرًا جزيلاً لكم على تخصيص وقتكم الإضافي وجعل هذه التجربة إيجابية. سأوصي بخدماتكم للآخرين بالتأكيد، وستكونون أول من ألجأ إليه عندما نحتاج إلى المزيد من بيانات السوق.
جون سوزوكي الرئيس والرئيس التنفيذي وعضو مجلس الإدارة, بي كيه تكنولوجيزأود أن أقدّر دعمكم واحترافيتكم في الاستجابة لطلبي للحصول على معلومات بشأن سوق التشخيص المخبري للأمراض المعدية في نيجيريا. كما أُقدّر صبركم وتوجيهكم، واستعدادكم لتقديم خصم، مما مكّننا في النهاية من إتمام الصفقة. أتطلع إلى التعامل مع "ذا إنسايت بارتنرز" مستقبلًا، كل ذلك بفضل الانطباع الذي تركتموه لديّ نتيجةً لهذا اللقاء الأول.
الدكتور تشيجيوك أونيا المدير الإداري, شركة باينكريست للرعاية الصحية المحدودةسبب الشراء
- اتخاذ قرارات مدروسة
- فهم ديناميكيات السوق
- تحليل المنافسة
- رؤى العملاء
- توقعات السوق
- تخفيف المخاطر
- التخطيط الاستراتيجي
- مبررات الاستثمار
- تحديد الأسواق الناشئة
- تحسين استراتيجيات التسويق
- تعزيز الكفاءة التشغيلية
- مواكبة التوجهات التنظيمية


 احصل على عينة مجانية ل - سوق المحولات التناظرية إلى الرقمية