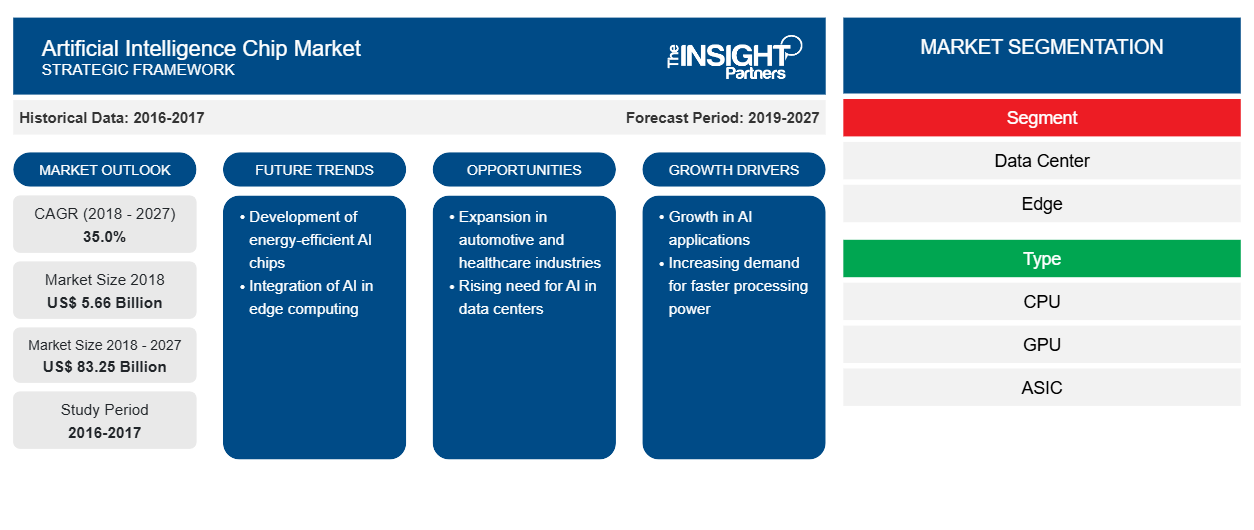
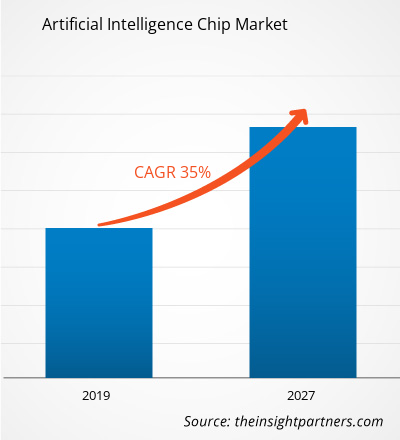
بلغت قيمة سوق شرائح الذكاء الاصطناعي 5658.1 مليون دولار أمريكي في عام 2018، ومن المتوقع أن تصل إلى 83،252.7 مليون دولار أمريكي بحلول عام 2027؛ ومن المتوقع أن تنمو بمعدل نمو سنوي مركب قدره 35.0٪ خلال الفترة 2019-2027.
مع توفر كمية هائلة من البيانات وقابلية التوسع الهائلة لقوة الحوسبة المستندة إلى السحابة، أصبح الذكاء الاصطناعي اتجاهًا هائلاً عبر الصناعات في السنوات القليلة الماضية. في عالمنا الرقمي اليوم، تعد المعلومات هي المفتاح لنجاح الشركات والحفاظ على النمو المستدام. تعتمد معظم الصناعات، وخاصة قطاع الخدمات، بشكل كبير على التحليلات لتزويدها برؤى تجارية مفيدة وتمكينها من البقاء قادرة على المنافسة في السوق. تعمل الشركات باستمرار على أتمتة عملياتها التجارية التي كانت تُجرى في وقت سابق إما برمجيًا أو يدويًا. مع التقدم في شرائح الذكاء الاصطناعي وإدخال شرائح مخصصة للتطبيق، تمتلك الشركات الآن القدرة على جمع التحليلات في الوقت الفعلي وتحويل البيانات إلى رؤى قابلة للتنفيذ. هناك العديد من حالات الاستخدام المتاحة في سوق شرائح الذكاء الاصطناعي للذكاء الاصطناعي التي يتم تنفيذها بنجاح عبر مختلف القطاعات الرأسية.
تشمل تطبيقات الذكاء الاصطناعي الرئيسية التي تستخدم فيها شرائح الذكاء الاصطناعي التعلم الآلي (ML)، ومعالجة اللغة الطبيعية (NLP)، وأنظمة الخبراء، والتعرف الآلي على الكلام، وتخطيط الذكاء الاصطناعي، ورؤية الكمبيوتر.
قم بتخصيص هذا التقرير ليناسب متطلباتك
ستحصل على تخصيص لأي تقرير - مجانًا - بما في ذلك أجزاء من هذا التقرير، أو تحليل على مستوى الدولة، وحزمة بيانات Excel، بالإضافة إلى الاستفادة من العروض والخصومات الرائعة للشركات الناشئة والجامعات
سوق شرائح الذكاء الاصطناعي:
- احصل على أهم اتجاهات السوق الرئيسية لهذا التقرير.ستتضمن هذه العينة المجانية تحليلاً للبيانات، بدءًا من اتجاهات السوق وحتى التقديرات والتوقعات.
رؤى السوق – سوق شرائح الذكاء الاصطناعي
زيادة الاستثمارات في الشركات الناشئة المتخصصة في شرائح الذكاء الاصطناعي من شأنها أن تغذي السوق خلال الفترة المتوقعة
لقد شهد الذكاء الاصطناعي وتطبيقاته مثل التعلم الآلي والتعلم العميق نموًا هائلاً على مدار السنوات القليلة الماضية. يتم استخدام الذكاء الاصطناعي على نطاق واسع في العديد من المجالات التي تتراوح من تطبيقات الحوسبة السحابية إلى المساعدين الرقميين والمركبات ذاتية القيادة / ذاتية القيادة. مع حالات الاستخدام المتزايدة للذكاء الاصطناعي ومشهد السوق المتطور، أصبحت التطورات في الرقائق الحالية ضرورة. يتم استخدام الذكاء الاصطناعي بشكل أساسي في سوق تدريب مراكز البيانات حيث تعد NVIDIA رائدة في السوق. ومع ذلك، فإن الطلب على رقائق الذكاء الاصطناعي المخصصة للتطبيقات والاستدلال على الحافة ومركز البيانات هي القطاعات سريعة النمو في سوق رقائق الذكاء الاصطناعي، وهناك العديد من الشركات الناشئة الجديدة التي تأتي للاستفادة من هذا السوق
رؤى القطاعات
بناءً على القطاع، ينقسم سوق شرائح الذكاء الاصطناعي إلى تطبيقات مركز البيانات/السحابة والحافة. استحوذ مركز البيانات على أكبر حصة في حصة السوق العالمية في عام 2018. في الوقت الحاضر، يتمثل التطبيق الرئيسي للشرائح الاصطناعية في تطبيقات مركز البيانات/السحابة. تُستخدم شرائح الذكاء الاصطناعي في مراكز البيانات لأغراض التدريب والاستدلال. التدريب هو عملية تقوم فيها خوارزميات الذكاء الاصطناعي بتحليل البيانات والتعلم ثم استخدام هذه المعلومات للاستجابة لمشاكل العالم الحقيقي. يتم تحليل كمية هائلة من البيانات بواسطة خوارزميات الذكاء الاصطناعي أثناء عملية التدريب. من أجل مساعدة المطورين في تقصير عمليات تطوير تكنولوجيا الذكاء الاصطناعي الخاصة بهم، يجب ألا يركز مصنعو الشرائح فقط على زيادة أداء المعالج ولكن أيضًا على توفير نظام بيئي كامل يشمل الأجهزة والإطار وأدوات الدعم الأخرى
رؤى النوع
بناءً على النوع، ينقسم سوق شرائح الذكاء الاصطناعي إلى وحدة المعالجة المركزية، وASIC، وGPU، وFPGA وغيرها. شكلت شريحة نوع وحدة معالجة الرسومات أكبر حصة في حصة السوق العالمية في عام 2018. في الوقت الحاضر في تطبيقات الذكاء الاصطناعي، تعد وحدات معالجة الرسومات أو وحدات معالجة الرسومات هي الأجهزة الأكثر استخدامًا. تجعل التوازي العالي وعرض النطاق الترددي للذاكرة لوحدات معالجة الرسومات منها الخيار الأكثر قابلية للتطبيق لتطبيقات التعلم الآلي والعميق خاصة في التدريب. تم استخدام وحدات معالجة الرسومات في البداية لتسريع عدد كبير من عمليات الضرب والإضافة التي يتم تنفيذها في عرض الرسومات. مع زيادة الطلب على الرسومات عالية الأداء، نما الطلب على وحدات معالجة الرسومات القوية أيضًا.
يركز اللاعبون في السوق على ابتكارات وتطويرات المنتجات الجديدة من خلال دمج التقنيات والميزات المتقدمة في منتجاتهم للتنافس مع المنافسين.
- في مارس 2019، دخلت AMD في شراكة مع ScaleMP لتمكين مصنعي خوادم AMD من إنشاء أنظمة تحتوي على 4 و8 وحتى 128 مقبس معالج، وما يصل إلى 8192 وحدة معالجة مركزية و256 تيرابايت من الذاكرة المشتركة.
- في يوليو 2018، كشفت جوجل عن شرائح ذكاء اصطناعي صغيرة جديدة، Edge TPU، للتعلم الآلي على الجهاز. Edge TPU هي دائرة متكاملة مخصصة للتطبيقات (ASIC) من جوجل مصممة لتشغيل الذكاء الاصطناعي على الحافة. وهي توفر أداءً عاليًا في مساحة مادية وطاقة صغيرة، مما يتيح نشر الذكاء الاصطناعي عالي الدقة على الحافة.
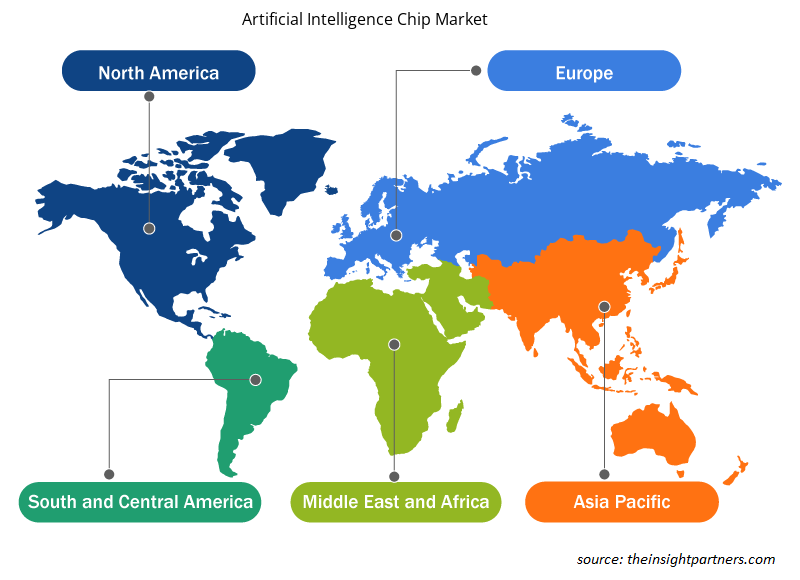
رؤى إقليمية حول سوق شرائح الذكاء الاصطناعي
لقد قام المحللون في Insight Partners بشرح الاتجاهات والعوامل الإقليمية المؤثرة على سوق شرائح الذكاء الاصطناعي طوال فترة التوقعات بشكل شامل. يناقش هذا القسم أيضًا قطاعات سوق شرائح الذكاء الاصطناعي والجغرافيا في جميع أنحاء أمريكا الشمالية وأوروبا ومنطقة آسيا والمحيط الهادئ والشرق الأوسط وأفريقيا وأمريكا الجنوبية والوسطى.
- احصل على البيانات الإقليمية المحددة لسوق شرائح الذكاء الاصطناعي
نطاق تقرير سوق شريحة الذكاء الاصطناعي
| سمة التقرير | تفاصيل |
|---|---|
| حجم السوق في عام 2018 | 5.66 مليار دولار أمريكي |
| حجم السوق بحلول عام 2027 | 83.25 مليار دولار أمريكي |
| معدل النمو السنوي المركب العالمي (2018 - 2027) | 35.0% |
| البيانات التاريخية | 2016-2017 |
| فترة التنبؤ | 2019-2027 |
| القطاعات المغطاة | حسب القطاع
|
| المناطق والدول المغطاة | أمريكا الشمالية
|
| قادة السوق وملفات تعريف الشركات الرئيسية |
|
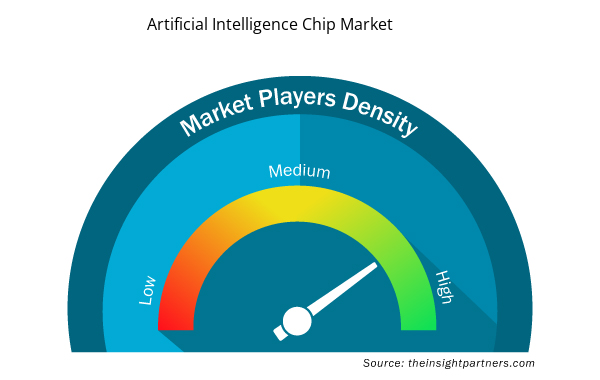
كثافة اللاعبين في سوق شرائح الذكاء الاصطناعي: فهم تأثيرها على ديناميكيات الأعمال
يشهد سوق شرائح الذكاء الاصطناعي نموًا سريعًا، مدفوعًا بالطلب المتزايد من المستخدم النهائي بسبب عوامل مثل تفضيلات المستهلكين المتطورة والتقدم التكنولوجي والوعي المتزايد بفوائد المنتج. ومع ارتفاع الطلب، تعمل الشركات على توسيع عروضها والابتكار لتلبية احتياجات المستهلكين والاستفادة من الاتجاهات الناشئة، مما يؤدي إلى زيادة نمو السوق.
تشير كثافة اللاعبين في السوق إلى توزيع الشركات أو المؤسسات العاملة في سوق أو صناعة معينة. وهي تشير إلى عدد المنافسين (اللاعبين في السوق) الموجودين في مساحة سوق معينة نسبة إلى حجمها أو قيمتها السوقية الإجمالية.
الشركات الرئيسية العاملة في سوق شرائح الذكاء الاصطناعي هي:
- شركة ادفانسد مايكرو ديفايسز
- شركة ألفابت (جوجل)
- شركة هواوي للتكنولوجيا المحدودة
- شركة آي بي إم
- شركة إنتل
إخلاء المسؤولية : الشركات المذكورة أعلاه ليست مرتبة بأي ترتيب معين.
- احصل على نظرة عامة على أهم اللاعبين الرئيسيين في سوق شرائح الذكاء الاصطناعي
'
تم تقسيم سوق شريحة الذكاء الاصطناعي العالمية على النحو التالي:
سوق شرائح الذكاء الاصطناعي – حسب القطاع
- مركز البيانات
- حافة
سوق شرائح الذكاء الاصطناعي – حسب النوع
- وحدة المعالجة المركزية
- وحدة معالجة الرسوميات
- ASIC
- FPGA
- آحرون
سوق شرائح الذكاء الاصطناعي – حسب القطاع
- الخدمات المالية والمصرفية والتأمين
- بيع بالتجزئة
- تكنولوجيا المعلومات والاتصالات
- السيارات والنقل
- الرعاية الصحية
- الإعلام والترفيه
- آحرون
سوق الذكاء الاصطناعي – حسب الجغرافيا
أمريكا الشمالية
- نحن
- كندا
- المكسيك
أوروبا
- فرنسا
- ألمانيا
- إيطاليا
- روسيا
- المملكة المتحدة
- بقية أوروبا
آسيا والمحيط الهادئ (APAC)
- كوريا الجنوبية
- الصين
- الهند
- أستراليا
- اليابان
- بقية آسيا والمحيط الهادئ
الشرق الأوسط وأفريقيا
- المملكة العربية السعودية
- الامارات العربية المتحدة
- جنوب أفريقيا
- باقي منطقة الشرق الأوسط وأفريقيا
أمريكا الجنوبية (SAM)
- البرازيل
- الأرجنتين
- بقية أمريكا الجنوبية
سوق شرائح الذكاء الاصطناعي – نبذة عن الشركات
- شركة ادفانسد مايكرو ديفايسز
- شركة جوجل
- شركة هواوي للتكنولوجيا المحدودة
- آي بي إم
- شركة إنتل
- شركة ميكرون للتكنولوجيا
- شركة NVIDIA
- شركة كوالكوم
- شركة سامسونج للإلكترونيات المحدودة
- شركة زيلينكس
- التحليل التاريخي (سنتان)، السنة الأساسية، التوقعات (7 سنوات) مع معدل النمو السنوي المركب
- تحليل PEST و SWOT
- حجم السوق والقيمة / الحجم - عالميًا وإقليميًا وقطريًا
- الصناعة والمنافسة
- مجموعة بيانات Excel


Report Coverage
Revenue forecast, Company Analysis, Industry landscape, Growth factors, and Trends

Segment Covered
This text is related
to segments covered.

Regional Scope
North America, Europe, Asia Pacific, Middle East & Africa, South & Central America

Country Scope
This text is related
to country scope.
The List of Companies - Artificial Intelligence Chip Market
- Advanced Micro Devices, Inc.
- Alphabet Inc. (Google)
- Huawei Technologies Co., Ltd.
- IBM Corporation
- Intel Corporation
- Micron technology, Inc.
- NVIDIA Corporation
- Qualcomm Incorporated
- Samsung electronics Co., Ltd.
- Xilinx, Inc.
The Insight Partners performs research in 4 major stages: Data Collection & Secondary Research, Primary Research, Data Analysis and Data Triangulation & Final Review.
- Data Collection and Secondary Research:
As a market research and consulting firm operating from a decade, we have published and advised several client across the globe. First step for any study will start with an assessment of currently available data and insights from existing reports. Further, historical and current market information is collected from Investor Presentations, Annual Reports, SEC Filings, etc., and other information related to company’s performance and market positioning are gathered from Paid Databases (Factiva, Hoovers, and Reuters) and various other publications available in public domain.
Several associations trade associates, technical forums, institutes, societies and organization are accessed to gain technical as well as market related insights through their publications such as research papers, blogs and press releases related to the studies are referred to get cues about the market. Further, white papers, journals, magazines, and other news articles published in last 3 years are scrutinized and analyzed to understand the current market trends.
- Primary Research:
The primarily interview analysis comprise of data obtained from industry participants interview and answers to survey questions gathered by in-house primary team.
For primary research, interviews are conducted with industry experts/CEOs/Marketing Managers/VPs/Subject Matter Experts from both demand and supply side to get a 360-degree view of the market. The primary team conducts several interviews based on the complexity of the markets to understand the various market trends and dynamics which makes research more credible and precise.
A typical research interview fulfils the following functions:
- Provides first-hand information on the market size, market trends, growth trends, competitive landscape, and outlook
- Validates and strengthens in-house secondary research findings
- Develops the analysis team’s expertise and market understanding
Primary research involves email interactions and telephone interviews for each market, category, segment, and sub-segment across geographies. The participants who typically take part in such a process include, but are not limited to:
- Industry participants: VPs, business development managers, market intelligence managers and national sales managers
- Outside experts: Valuation experts, research analysts and key opinion leaders specializing in the electronics and semiconductor industry.
Below is the breakup of our primary respondents by company, designation, and region:

Once we receive the confirmation from primary research sources or primary respondents, we finalize the base year market estimation and forecast the data as per the macroeconomic and microeconomic factors assessed during data collection.
- Data Analysis:
Once data is validated through both secondary as well as primary respondents, we finalize the market estimations by hypothesis formulation and factor analysis at regional and country level.
- Macro-Economic Factor Analysis:
We analyse macroeconomic indicators such the gross domestic product (GDP), increase in the demand for goods and services across industries, technological advancement, regional economic growth, governmental policies, the influence of COVID-19, PEST analysis, and other aspects. This analysis aids in setting benchmarks for various nations/regions and approximating market splits. Additionally, the general trend of the aforementioned components aid in determining the market's development possibilities.
- Country Level Data:
Various factors that are especially aligned to the country are taken into account to determine the market size for a certain area and country, including the presence of vendors, such as headquarters and offices, the country's GDP, demand patterns, and industry growth. To comprehend the market dynamics for the nation, a number of growth variables, inhibitors, application areas, and current market trends are researched. The aforementioned elements aid in determining the country's overall market's growth potential.
- Company Profile:
The “Table of Contents” is formulated by listing and analyzing more than 25 - 30 companies operating in the market ecosystem across geographies. However, we profile only 10 companies as a standard practice in our syndicate reports. These 10 companies comprise leading, emerging, and regional players. Nonetheless, our analysis is not restricted to the 10 listed companies, we also analyze other companies present in the market to develop a holistic view and understand the prevailing trends. The “Company Profiles” section in the report covers key facts, business description, products & services, financial information, SWOT analysis, and key developments. The financial information presented is extracted from the annual reports and official documents of the publicly listed companies. Upon collecting the information for the sections of respective companies, we verify them via various primary sources and then compile the data in respective company profiles. The company level information helps us in deriving the base number as well as in forecasting the market size.
- Developing Base Number:
Aggregation of sales statistics (2020-2022) and macro-economic factor, and other secondary and primary research insights are utilized to arrive at base number and related market shares for 2022. The data gaps are identified in this step and relevant market data is analyzed, collected from paid primary interviews or databases. On finalizing the base year market size, forecasts are developed on the basis of macro-economic, industry and market growth factors and company level analysis.
- Data Triangulation and Final Review:
The market findings and base year market size calculations are validated from supply as well as demand side. Demand side validations are based on macro-economic factor analysis and benchmarks for respective regions and countries. In case of supply side validations, revenues of major companies are estimated (in case not available) based on industry benchmark, approximate number of employees, product portfolio, and primary interviews revenues are gathered. Further revenue from target product/service segment is assessed to avoid overshooting of market statistics. In case of heavy deviations between supply and demand side values, all thes steps are repeated to achieve synchronization.
We follow an iterative model, wherein we share our research findings with Subject Matter Experts (SME’s) and Key Opinion Leaders (KOLs) until consensus view of the market is not formulated – this model negates any drastic deviation in the opinions of experts. Only validated and universally acceptable research findings are quoted in our reports.
We have important check points that we use to validate our research findings – which we call – data triangulation, where we validate the information, we generate from secondary sources with primary interviews and then we re-validate with our internal data bases and Subject matter experts. This comprehensive model enables us to deliver high quality, reliable data in shortest possible time.
 احصل على عينة مجانية لهذا التقرير