سوق منصات التجارة الإلكترونية B2B – المحركات والاتجاهات والفرص وإحصاءات النمو | 2031
البيانات التاريخية : 2021-2022 | سنة الأساس : 2023 | فترة التنبؤ : 2024-2031حجم سوق منصات التجارة الإلكترونية بين الشركات (B2B) وتوقعاته (2021-2031)، والحصة العالمية والإقليمية، والاتجاهات، وفرص النمو. يغطي التقرير: حسب النوع (محليًا وسحابيًا)؛ وحجم المؤسسة (الشركات الصغيرة والمتوسطة والكبيرة)؛ وقطاع المستخدم النهائي (السيارات، والكهربائيات والإلكترونيات، والصناعات العامة، وغيرها)، والموقع الجغرافي.
- تاريخ التقرير : Feb 2026
- رمز التقرير : TIPRE00008088
- الفئة : التكنولوجيا والإعلام والاتصالات
- الحالة : البيانات الصادرة
- تنسيقات التقارير المتاحة :


- عدد الصفحات : 150
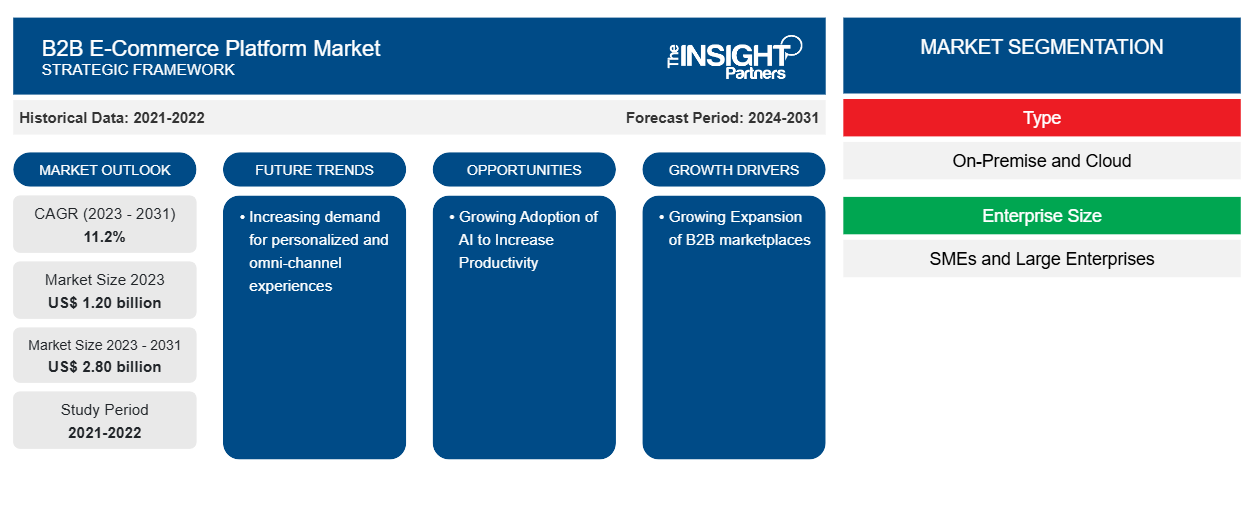
من المتوقع أن يصل حجم سوق منصات التجارة الإلكترونية بين الشركات إلى 2.80 مليار دولار أمريكي بحلول عام 2031 من 1.20 مليار دولار أمريكي في عام 2023. ومن المتوقع أن يسجل السوق معدل نمو سنوي مركب بنسبة 11.2٪ في الفترة 2023-2031. ومن المرجح أن يظل الطلب المتزايد على التجارب الشخصية ومتعددة القنوات اتجاهًا رئيسيًا في سوق منصات التجارة الإلكترونية بين الشركات.
تحليل سوق منصات التجارة الإلكترونية B2B
تستخدم العديد من الشركات التقنيات الرقمية لتحسين تجربة العملاء وتعزيز الكفاءة وأتمتة العمليات. أصبحت الأعمال التجارية عبر الإنترنت أسهل بالنسبة للشركات بسبب التبني الواسع النطاق للهواتف الذكية والتطوير المستمر لشبكات الإنترنت عالية السرعة. ونتيجة لذلك، هناك المزيد من منصات التجارة الإلكترونية B2B المتاحة، مما يمنح الشركات طريقة سهلة وفعالة للتواصل مع العملاء والشركاء. في الوقت نفسه، تمكن العولمة المستمرة الشركات من إجراء التجارة الإلكترونية B2B مع العملاء والبائعين في جميع أنحاء العالم، وبالتالي تحفيز التجارة الدولية.
نظرة عامة على سوق منصات التجارة الإلكترونية B2B
التجارة بين الشركات (B2B) هي تبادل السلع أو الخدمات أو المعلومات بين الشركات وليس من شركة إلى مستهلك (B2C). تتم معاملة B2B بين شركتين، مثل بائع التجزئة عبر الإنترنت وتاجر الجملة. كان انتشار الوباء أحد العوامل الرئيسية التي غذت نمو السوق في السنوات الأخيرة، حيث يتعين على معظم الشركات اتباع قيود مختلفة. بالإضافة إلى ذلك، فإن العدد المتزايد من جيل الألفية الذين يدخلون مجال B2B يعزز أيضًا نمو سوق منصات التجارة الإلكترونية B2B.
قم بتخصيص هذا التقرير ليناسب متطلباتك
ستحصل على تخصيص لأي تقرير - مجانًا - بما في ذلك أجزاء من هذا التقرير، أو تحليل على مستوى الدولة، وحزمة بيانات Excel، بالإضافة إلى الاستفادة من العروض والخصومات الرائعة للشركات الناشئة والجامعات
سوق منصات التجارة الإلكترونية B2B: رؤى استراتيجية
-
احصل على أهم اتجاهات السوق الرئيسية لهذا التقرير.ستتضمن هذه العينة المجانية تحليلاً للبيانات، بدءًا من اتجاهات السوق وحتى التقديرات والتوقعات.
محركات وفرص سوق منصات التجارة الإلكترونية B2B
التوسع المتزايد في أسواق B2B
يستخدم بائعو B2B منصات التجارة الإلكترونية التابعة لجهات خارجية لتوسيع نطاق وصولهم وتقييم المنافسة وتوفير الراحة للمشترين الذين يستخدمون الأسواق مثل Amazon Business وAlibaba.com لإجراء عمليات الشراء. توفر أسواق B2B للمشترين موارد مثل التسوق المقارن وتقييمات العملاء ومراجعات المنتجات. لهذا السبب، وفقًا لـ Google، يفضل أكثر من 80٪ من مشتري B2B الطلب أو إجراء المدفوعات من خلال قنوات التجارة الرقمية. وبالتالي، فإن التوسع المتزايد في أسواق B2B يغذي نمو سوق منصات التجارة الإلكترونية B2B.
تزايد استخدام الذكاء الاصطناعي لزيادة الإنتاجية
وفقًا لشركة Salesforce، Inc.، فإن 32% من شركات B2B قد قامت بدمج الذكاء الاصطناعي بالكامل، بينما لا يزال ما يقرب من نصفها (45%) في مرحلة التجريب. وقد لاحظت الشركات بالفعل مكاسب كبيرة في إنتاجية العمال والفعالية التشغيلية. بالإضافة إلى ذلك، يتمتع الذكاء الاصطناعي بالقدرة على تعزيز المجالات التي كانت تشكل مشكلة في التحول الرقمي B2B بشكل كبير. يتمتع الذكاء الاصطناعي بالقدرة على تقليل كمية العمل اليدوي المطلوبة لهذه المهام بشكل كبير. مع الذكاء الاصطناعي التوليدي، يمكن للشركات الآن عرض المزيد من مخزونها رقميًا - وسيكون العديد منها قادرًا على التوسع في مواد المنتج الأكثر تعقيدًا، مثل تجارب الشراء المرئية. وبالتالي، من المتوقع أن يخلق التبني المتزايد للذكاء الاصطناعي فرصة لنمو سوق منصة التجارة الإلكترونية B2B في الفترة المتوقعة.forecasted period.
تقرير تحليل تجزئة سوق منصات التجارة الإلكترونية B2B
إن القطاعات الرئيسية التي ساهمت في اشتقاق تحليل سوق منصة التجارة الإلكترونية B2B هي النوع وحجم المؤسسة وصناعة المستخدم النهائي.
- بناءً على النوع، يتم تقسيم سوق منصات التجارة الإلكترونية بين الشركات إلى منصات محلية وأخرى سحابية. وقد استحوذت شريحة المنصات المحلية على حصة سوقية أكبر في عام 2023.
- بناءً على حجم المؤسسة، يتم تقسيم السوق إلى الشركات الصغيرة والمتوسطة الحجم والشركات الكبيرة. احتلت شريحة الشركات الكبيرة حصة سوقية أكبر في عام 2023.
- بناءً على صناعة المستخدم النهائي، يتم تقسيم السوق إلى صناعات السيارات والكهرباء والإلكترونيات والصناعات العامة وغيرها. ومن المتوقع أن يشهد قطاع السيارات نموًا كبيرًا في الفترة المتوقعة.
تحليل حصة سوق منصات التجارة الإلكترونية B2B حسب المنطقة الجغرافية
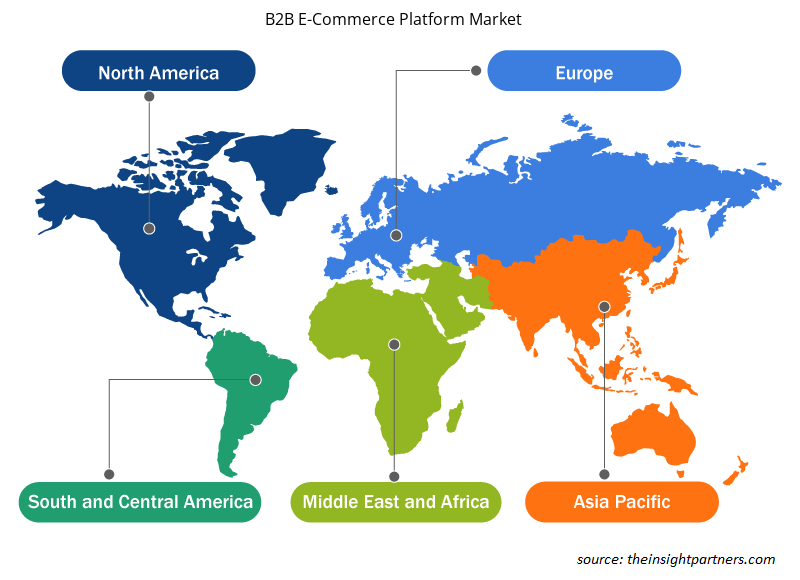
ينقسم النطاق الجغرافي لتقرير سوق منصة التجارة الإلكترونية B2B بشكل أساسي إلى خمس مناطق:أمريكا الشمالية، ومنطقة آسيا والمحيط الهادئ، وأوروبا، والشرق الأوسط وأفريقيا، وأمريكا الجنوبية/أمريكا الجنوبية والوسطى.
من المتوقع أن تشهد منطقة آسيا والمحيط الهادئ نموًا كبيرًا في سوق منصات التجارة الإلكترونية B2B. السوق في هذه المنطقة مقسمة إلى أستراليا والصين والهند واليابان وكوريا الجنوبية وبقية منطقة آسيا والمحيط الهادئ. من المرجح أن يعزز التوسع الصناعي والتحضر في المنطقة، وخاصة في الصين واليابان والهند، من توسع السوق. أيضًا، وفقًا لاتحاد النقل الجوي الدولي (IATA)، تقود منطقة آسيا والمحيط الهادئ نمو سوق التجارة الإلكترونية على مستوى العالم، حيث تمثل الصين نسبة كبيرة من النمو. وفقًا لإدارة التجارة الدولية، فإن سوق التجارة الإلكترونية في الصين هي الأكبر في العالم وتولد ما يقرب من 50٪ من معاملات العالم. علاوة على ذلك، وفقًا لمؤسسة India Brand Equity Foundation (IBEF)، من المتوقع أن يصل سوق التجارة الإلكترونية في الهند إلى 188 مليار دولار أمريكي بحلول عام 2025. وبالتالي، فإن قطاع التجارة الإلكترونية المتنامي في المنطقة يغذي نمو سوق منصات التجارة الإلكترونية B2B.
رؤى إقليمية حول سوق منصات التجارة الإلكترونية B2B
لقد قام المحللون في Insight Partners بشرح الاتجاهات والعوامل الإقليمية المؤثرة على سوق منصة التجارة الإلكترونية B2B طوال فترة التوقعات بشكل شامل. يناقش هذا القسم أيضًا قطاعات سوق منصة التجارة الإلكترونية B2B والجغرافيا في جميع أنحاء أمريكا الشمالية وأوروبا ومنطقة آسيا والمحيط الهادئ والشرق الأوسط وأفريقيا وأمريكا الجنوبية والوسطى.
- احصل على البيانات الإقليمية المحددة لسوق منصات التجارة الإلكترونية B2B
نطاق تقرير سوق منصات التجارة الإلكترونية B2B
| سمة التقرير | تفاصيل |
|---|---|
| حجم السوق في عام 2023 | 1.20 مليار دولار أمريكي |
| حجم السوق بحلول عام 2031 | 2.80 مليار دولار أمريكي |
| معدل النمو السنوي المركب العالمي (2023 - 2031) | 11.2% |
| البيانات التاريخية | 2021-2022 |
| فترة التنبؤ | 2024-2031 |
| القطاعات المغطاة |
حسب النوع
|
| المناطق والدول المغطاة |
أمريكا الشمالية
|
| قادة السوق وملفات تعريف الشركات الرئيسية |
|
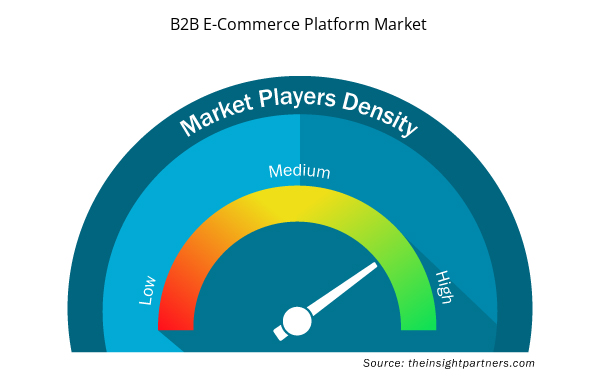
كثافة اللاعبين في سوق منصات التجارة الإلكترونية B2B: فهم تأثيرها على ديناميكيات الأعمال
يشهد سوق منصات التجارة الإلكترونية بين الشركات نموًا سريعًا، مدفوعًا بالطلب المتزايد من المستخدم النهائي بسبب عوامل مثل تفضيلات المستهلكين المتطورة والتقدم التكنولوجي والوعي المتزايد بفوائد المنتج. ومع ارتفاع الطلب، تعمل الشركات على توسيع عروضها والابتكار لتلبية احتياجات المستهلكين والاستفادة من الاتجاهات الناشئة، مما يؤدي إلى زيادة نمو السوق.
تشير كثافة اللاعبين في السوق إلى توزيع الشركات أو المؤسسات العاملة في سوق أو صناعة معينة. وهي تشير إلى عدد المنافسين (اللاعبين في السوق) الموجودين في مساحة سوق معينة نسبة إلى حجمها أو قيمتها السوقية الإجمالية.
الشركات الرئيسية العاملة في سوق منصة التجارة الإلكترونية B2B هي:
- شركة أبتوس
- شركة بيج كوميرس المحدودة
- علي بابا
- كيبو كوميرس
- شركة ماجنيتو لحلول تكنولوجيا المعلومات المحدودة
- شركة الحلول حسب الطلب المحدودة
إخلاء المسؤولية : الشركات المذكورة أعلاه ليست مرتبة بأي ترتيب معين.
- احصل على نظرة عامة على أهم اللاعبين الرئيسيين في سوق منصات التجارة الإلكترونية B2B
أخبار سوق منصات التجارة الإلكترونية B2B والتطورات الأخيرة
يتم تقييم سوق منصة التجارة الإلكترونية B2B من خلال جمع البيانات النوعية والكمية بعد البحث الأولي والثانوي، والتي تتضمن منشورات الشركات المهمة وبيانات الجمعيات وقواعد البيانات. فيما يلي قائمة بالتطورات في السوق:
- وقعت شركة Schaeffler India Limited، وهي شركة تابعة لشركة Schaeffler AG، اتفاقية شراء أسهم للاستحواذ على 100% من أسهم شركة KRSV Innovative Auto Solutions Private Limited ("KRSV" فيما يلي). يقع المقر الرئيسي لشركة KRSV في بنغالورو وتقدم حلول الإصلاح لورش ما بعد البيع الهندية من خلال منصة التجارة الإلكترونية B2B سريعة النمو، Koovers. تعد Koovers إضافة مثالية لأنشطة Schaeffler Automotive Aftermarket في الهند. (المصدر: Schaeffler، بيان صحفي، 2023)
- أعلنت شركة BigCommerce، وهي منصة التجارة الإلكترونية الرائدة Open SaaS للعلامات التجارية B2C وB2B سريعة النمو والراسخة، عن الاستحواذ على BundleB2B، وهي شريكة تقنية BigCommerce منذ فترة طويلة والتي توفر وظائف B2B من المستوى التالي لتجار BigCommerce. (المصدر: Intertek، بيان صحفي، 2021)
تقرير سوق منصات التجارة الإلكترونية B2B - التغطية والنتائج المتوقعة
يوفر تقرير "حجم سوق منصات التجارة الإلكترونية B2B والتوقعات (2021-2031)" تحليلاً مفصلاً للسوق يغطي المجالات التالية:
- حجم السوق والتوقعات على المستويات العالمية والإقليمية والوطنية لجميع قطاعات السوق الرئيسية التي يغطيها النطاق
- ديناميكيات السوق مثل المحركات والقيود والفرص الرئيسية
- الاتجاهات المستقبلية الرئيسية
- تحليل مفصل لقوى PEST/Porter الخمس وSWOT
- تحليل السوق العالمي والإقليمي الذي يغطي اتجاهات السوق الرئيسية واللاعبين الرئيسيين واللوائح والتطورات الأخيرة في السوق
- تحليل المشهد الصناعي والمنافسة الذي يغطي تركيز السوق، وتحليل خريطة الحرارة، واللاعبين البارزين، والتطورات الأخيرة
- ملفات تعريف الشركة التفصيلية

أنكيتا خبيرة ديناميكية في أبحاث السوق والاستشارات، تتمتع بخبرة تزيد عن 8 سنوات في قطاعات التكنولوجيا والإعلام وتكنولوجيا المعلومات والاتصالات والإلكترونيات وأشباه الموصلات. وقد قادت ونفذت بنجاح أكثر من 100 مهمة استشارية وبحثية لعملاء عالميين مثل مايكروسوفت وأوراكل وشركة NEC وSAP وKPMG وExpeditors International. تشمل كفاءاتها الأساسية تقييم السوق، وتحليل البيانات، والتنبؤ، وصياغة الاستراتيجيات، والاستخبارات التنافسية، وكتابة التقارير.
أنكيتا بارعة في إدارة دورات المشاريع الكاملة، بدءًا من تصميم عروض ما قبل البيع ومناقشات العملاء، وصولًا إلى تقديم رؤى عملية بعد البيع. كما أنها ماهرة في إدارة فرق متعددة الوظائف، وهيكلة وحدات بحثية معقدة، ومواءمة الحلول مع أهداف العمل الخاصة بالعملاء. وقد مكنتها مهاراتها الممتازة في التواصل والقيادة والعرض التقديمي من تحقيق نتائج قيّمة باستمرار في بيئات سوقية سريعة التطور.
- التحليل التاريخي (سنتان)، سنة الأساس، التوقعات (7 سنوات) مع معدل النمو السنوي المركب
- تحليل PEST و SWOT
- حجم السوق والقيمة / الحجم - عالمي، إقليمي، بلد
- الصناعة والمنافسة
- مجموعة بيانات إكسل
التقارير الحديثة
شهادات العملاء
تقرير سوق أنظمة SCADA من Insight Partners شامل، ويقدم رؤى قيّمة حول الاتجاهات الحالية والتوقعات المستقبلية. تميّز الفريق باحترافية عالية وسرعة في الاستجابة ودعم مستمر طوال الوقت. نحن راضون جدًا ونوصي بشدة بخدماتهم.
ران كيديم شريك, شركة ريالي تكنولوجيز المحدودةطلبتُ تقريرًا عن سوق برمجيات محدد، وأعدّه الفريق في غضون أيام قليلة. كانت المعلومات ذات صلة وثيقة وعرضها جيد. ثم طلبتُ بعض التعديلات والإضافات على التقرير. وكان الفريق متجاوبًا للغاية، وحصلتُ على التقرير النهائي في أقل من أسبوع.
جان هيرفيه جين رئيس مجلس الإدارة, فيوتشر أناليتيكاعملنا مع شركة "إنسايت بارتنرز" لإجراء دراسة سوقية وتوقعات مهمة. زودونا برؤى واضحة حول الفرص والمخاطر، مما ساعدنا في صياغة خططنا. كانت أبحاثهم سهلة الاستخدام ومبنية على بيانات دقيقة، مما ساعدنا على اتخاذ قرارات ذكية وواثقة. نوصي بهم بشدة.
بيوش ناجبال نائب الرئيس الأول, شعاع عالي عالميقدّمت شركة Insight Partners أبحاثًا سوقية ثاقبة ومنظمة جيدًا بخبرة واسعة في هذا المجال. تميّز فريقهم بالاحترافية وسرعة الاستجابة طوال الوقت. وسهّل موقعهم الإلكتروني سهل الاستخدام الوصول إلى تقارير القطاع. نوصي بهم بشدة لخدمات بحثية موثوقة وعالية الجودة.
يوكيهيكو أداتشي المدير التنفيذي, ديب بلو، ذ.م.م.هذه أول مرة أشتري فيها تقرير سوق من The Insight Partners. رغم أنني كنت مترددًا في البداية، إلا أنني زرت موقعهم الإلكتروني وشعرت براحة أكبر للمخاطرة وشراء تقرير السوق. أنا راضٍ تمامًا عن جودة التقرير وخدمة العملاء. كانت لديّ عدة أسئلة وتعليقات حول التقرير الأولي، ولكن بعد بضع محادثات عبر البريد الإلكتروني مع محللهم، أعتقد أن لديّ تقريرًا يمكنني استخدامه كمدخل لعملية التخطيط الاستراتيجي لدينا. شكرًا جزيلاً لكم على تخصيص وقتكم الإضافي وجعل هذه التجربة إيجابية. سأوصي بخدماتكم للآخرين بالتأكيد، وستكونون أول من ألجأ إليه عندما نحتاج إلى المزيد من بيانات السوق.
جون سوزوكي الرئيس والرئيس التنفيذي وعضو مجلس الإدارة, بي كيه تكنولوجيزأود أن أقدّر دعمكم واحترافيتكم في الاستجابة لطلبي للحصول على معلومات بشأن سوق التشخيص المخبري للأمراض المعدية في نيجيريا. كما أُقدّر صبركم وتوجيهكم، واستعدادكم لتقديم خصم، مما مكّننا في النهاية من إتمام الصفقة. أتطلع إلى التعامل مع "ذا إنسايت بارتنرز" مستقبلًا، كل ذلك بفضل الانطباع الذي تركتموه لديّ نتيجةً لهذا اللقاء الأول.
الدكتور تشيجيوك أونيا المدير الإداري, شركة باينكريست للرعاية الصحية المحدودةسبب الشراء
- اتخاذ قرارات مدروسة
- فهم ديناميكيات السوق
- تحليل المنافسة
- رؤى العملاء
- توقعات السوق
- تخفيف المخاطر
- التخطيط الاستراتيجي
- مبررات الاستثمار
- تحديد الأسواق الناشئة
- تحسين استراتيجيات التسويق
- تعزيز الكفاءة التشغيلية
- مواكبة التوجهات التنظيمية


 احصل على عينة مجانية ل - سوق منصات التجارة الإلكترونية B2B