سوق Busway – المحركات والاتجاهات والفرص وإحصاءات النمو | 2031
البيانات التاريخية : 2021-2022 | سنة الأساس : 2023 | فترة التنبؤ : 2024-2031حجم سوق ممرات الحافلات وتوقعاته (2021-2031)، والحصة العالمية والإقليمية، والاتجاهات، وفرص النمو. يغطي التقرير: حسب الأنواع (ممرات الحافلات ذات التوصيل الهوائي (BMC)، وممرات الحافلات ذات السدادات العازلة المكثفة (CMC)، وممرات الحافلات المغلقة عالية القوة (CFW) وغيرها)، والتطبيق (المباني التجارية، والمباني السكنية، والبنية التحتية الصناعية، وغيرها)، والجغرافيا.
- تاريخ التقرير : Mar 2026
- رمز التقرير : TIPTE100000372
- الفئة : الإلكترونيات وأشباه الموصلات
- الحالة : البيانات الصادرة
- تنسيقات التقارير المتاحة :


- عدد الصفحات : 150
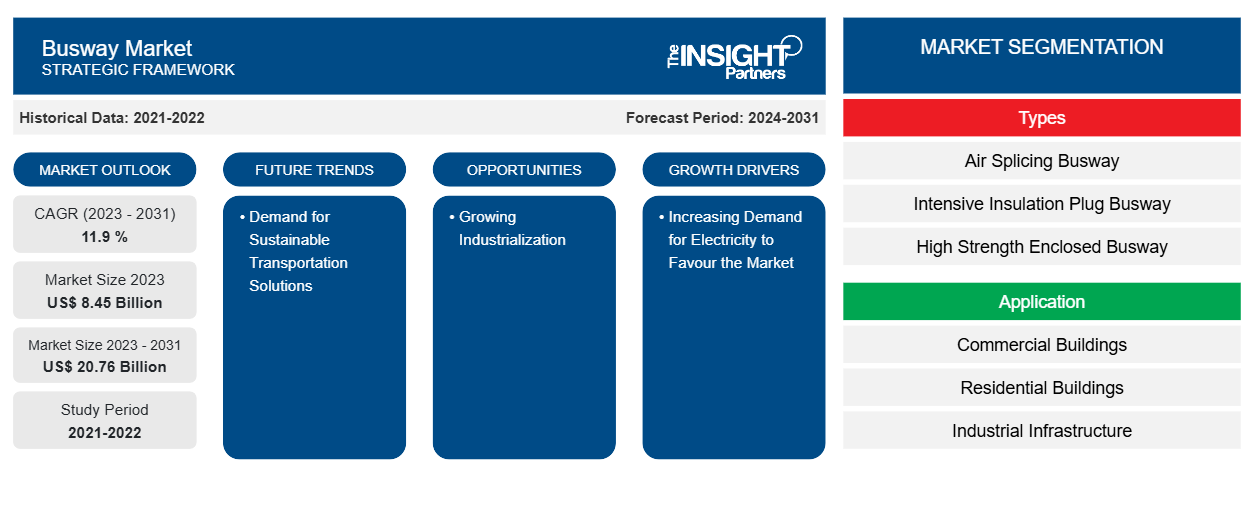
من المتوقع أن يصل حجم سوق مسارات الحافلات إلى 20.76 مليار دولار أمريكي بحلول عام 2031 من 8.45 مليار دولار أمريكي في عام 2023. ومن المتوقع أن يسجل السوق معدل نمو سنوي مركب بنسبة 11.9٪ في الفترة 2023-2031. ومن المرجح أن يظل الطلب المتزايد على الكهرباء والتصنيع المتنامي من الاتجاهات الرئيسية لسوق مسارات الحافلات.
تحليل سوق الحافلات
تُلاحظ اتجاهات نمو مختلفة في مناطق مختلفة من هذه الصناعة. تمثل الأسواق المتقدمة في أمريكا الشمالية وأوروبا جزءًا كبيرًا من حصة السوق العالمية؛ ومع ذلك، تنمو البلدان النامية في مناطق مثل آسيا والمحيط الهادئ والشرق الأوسط وأفريقيا وأفريقيا وأمريكا الجنوبية بسرعة بسبب مجموعة متنوعة من العوامل مثل الحاجة إلى الكهرباء ونمو الصناعات والبنية الأساسية الجديدة. ومن المتوقع أن يزداد اعتماد مسارات الحافلات بسرعة في السنوات القادمة بسبب توسع شبكات الطاقة وتطوير محطات الطاقة المتجددة على مستوى العالم.
نظرة عامة على سوق باصواي
تعرف الرابطة الوطنية لمصنعي الكهرباء (NEMA) مسار الحافلات بأنه نظام توزيع كهربائي مُصنَّع مسبقًا يتكون من أطوال مستقيمة وتجهيزات وأجهزة وملحقات، وكلها محاطة بغلاف واقٍ. تنقل مسارات الحافلات الطاقة وتربطها بالمعدات الكهربائية مثل المحولات ولوحات التوزيع ومعدات التبديل . في التطبيقات التجارية والصناعية، يعد مسار الحافلات بديلاً رائعًا للكابل والقنوات لأنه أسهل في الاستبدال وأقل تكلفة في التركيب ويتطلب عمل تكوين أقل - خاصة في السيناريوهات التي من المحتمل أن تختلف فيها مواضع الحمل.
قم بتخصيص هذا التقرير ليناسب متطلباتك
ستحصل على تخصيص لأي تقرير - مجانًا - بما في ذلك أجزاء من هذا التقرير، أو تحليل على مستوى الدولة، وحزمة بيانات Excel، بالإضافة إلى الاستفادة من العروض والخصومات الرائعة للشركات الناشئة والجامعات
سوق الحافلات: رؤى استراتيجية
-
احصل على أهم اتجاهات السوق الرئيسية لهذا التقرير.ستتضمن هذه العينة المجانية تحليلاً للبيانات، بدءًا من اتجاهات السوق وحتى التقديرات والتوقعات.
محركات وفرص سوق الحافلات
تزايد الطلب على الكهرباء لصالح السوق.
لقد زاد استخدام الكهرباء على مدى العقود القليلة الماضية، وهو الآن ضروري للاقتصادات الحديثة. ومن المتوقع أن يزداد هذا الطلب في السنوات القادمة بسبب ارتفاع الدخل المتاح. وقد أدى زيادة استهلاك الكهرباء إلى زيادة استخدام الكهرباء في الصناعات التي تستهدف المستخدمين النهائيين والسيارات. وهناك نمطان جغرافيان مختلفان للطلب على الكهرباء. وتتوازن مكاسب كفاءة الطاقة مع النمو المستقبلي المرتبط بزيادة الكهربة والرقمنة في الاقتصادات المتقدمة.
التصنيع المتنامي
يؤدي النمو الصناعي إلى تطوير مصانع ومصانع جديدة، الأمر الذي يتطلب بنية تحتية كهربائية قوية للآلات والمعدات الكهربائية، مما يخلق طلبًا على أنظمة الحافلات لتوزيع الكهرباء بكفاءة.
تحليل تجزئة تقرير سوق الحافلات
إن القطاعات الرئيسية التي ساهمت في استخلاص تحليل سوق مسارات الحافلات هي الأنواع والتطبيقات.
- وفقًا للأنواع، يتم تقسيم سوق مسارات الحافلات إلى مسارات الحافلات ذات الوصلات الهوائية (BMC)، ومسارات الحافلات ذات المقابس العازلة المكثفة (CMC)، ومسارات الحافلات المغلقة عالية القوة (CFW)، وغيرها.
- حسب التطبيق، يتم تقسيم السوق إلى المباني التجارية والمباني السكنية والبنية التحتية الصناعية وغيرها.
تحليل حصة سوق الحافلات حسب المنطقة الجغرافية
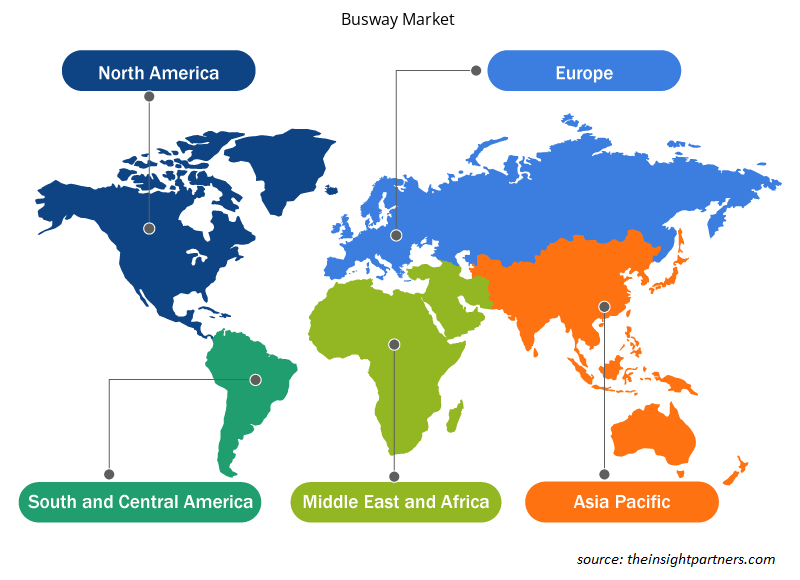
ينقسم النطاق الجغرافي لتقرير سوق الحافلات بشكل أساسي إلى خمس مناطق: أمريكا الشمالية، ومنطقة آسيا والمحيط الهادئ، وأوروبا، والشرق الأوسط وأفريقيا، وأمريكا الجنوبية/أمريكا الجنوبية والوسطى. سيطرت أمريكا الشمالية على سوق الحافلات. وقد أدت اتجاهات تبني التكنولوجيا العالية في مختلف الصناعات في منطقة أمريكا الشمالية إلى تغذية نمو سوق الحافلات. علاوة على ذلك، فإن التركيز القوي على البحث والتطوير في الاقتصادات المتقدمة في الولايات المتحدة وكندا يجبر اللاعبين في أمريكا الشمالية على جلب حلول متقدمة تقنيًا إلى السوق. بالإضافة إلى ذلك، يوجد في الولايات المتحدة العديد من اللاعبين في سوق الحافلات الذين يركزون بشكل متزايد على تطوير حلول مبتكرة. تساهم كل هذه العوامل في نمو سوق الحافلات في المنطقة.
نظرة إقليمية على سوق الحافلات
لقد قام المحللون في Insight Partners بشرح الاتجاهات والعوامل الإقليمية المؤثرة على سوق Busway طوال فترة التوقعات بشكل شامل. يناقش هذا القسم أيضًا قطاعات سوق Busway والجغرافيا في جميع أنحاء أمريكا الشمالية وأوروبا ومنطقة آسيا والمحيط الهادئ والشرق الأوسط وأفريقيا وأمريكا الجنوبية والوسطى.
- احصل على البيانات الإقليمية المحددة لسوق الحافلات
نطاق تقرير سوق الحافلات
| سمة التقرير | تفاصيل |
|---|---|
| حجم السوق في عام 2023 | 8.45 مليار دولار أمريكي |
| حجم السوق بحلول عام 2031 | 20.76 مليار دولار أمريكي |
| معدل النمو السنوي المركب العالمي (2023 - 2031) | 11.9% |
| البيانات التاريخية | 2021-2022 |
| فترة التنبؤ | 2024-2031 |
| القطاعات المغطاة |
حسب الأنواع
|
| المناطق والدول المغطاة |
أمريكا الشمالية
|
| قادة السوق وملفات تعريف الشركات الرئيسية |
|
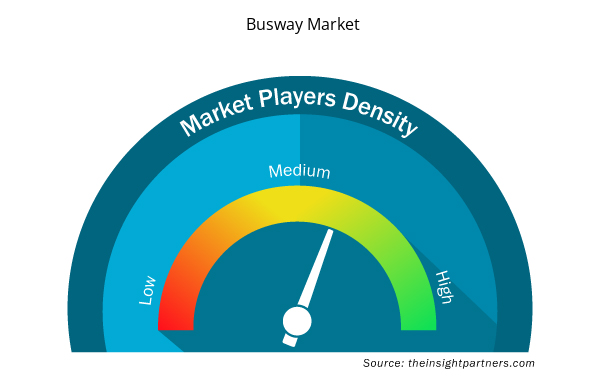
كثافة اللاعبين في سوق الحافلات: فهم تأثيرها على ديناميكيات الأعمال
يشهد سوق Busway نموًا سريعًا، مدفوعًا بالطلب المتزايد من المستخدم النهائي بسبب عوامل مثل تفضيلات المستهلكين المتطورة والتقدم التكنولوجي والوعي المتزايد بفوائد المنتج. ومع ارتفاع الطلب، تعمل الشركات على توسيع عروضها والابتكار لتلبية احتياجات المستهلكين والاستفادة من الاتجاهات الناشئة، مما يؤدي إلى زيادة نمو السوق.
تشير كثافة اللاعبين في السوق إلى توزيع الشركات أو المؤسسات العاملة في سوق أو صناعة معينة. وهي تشير إلى عدد المنافسين (اللاعبين في السوق) الموجودين في مساحة سوق معينة نسبة إلى حجمها أو قيمتها السوقية الإجمالية.
الشركات الرئيسية العاملة في سوق الحافلات هي:
- شنايدر الكتريك
- سيمنز
- ايتون
- كابلات وأنظمة LS
- شركة باور بلاج باص دكت المحدودة
- أي بي بي
إخلاء المسؤولية : الشركات المذكورة أعلاه ليست مرتبة بأي ترتيب معين.
- احصل على نظرة عامة على أهم اللاعبين الرئيسيين في سوق Busway
أخبار سوق الحافلات والتطورات الأخيرة
يتم تقييم سوق مسارات الحافلات من خلال جمع البيانات النوعية والكمية بعد البحث الأولي والثانوي، والذي يتضمن منشورات الشركات المهمة وبيانات الجمعيات وقواعد البيانات. فيما يلي قائمة بالتطورات في السوق:
- في يونيو 2021، أعلنت شركة إدارة الطاقة Eaton أنها أكملت الاستحواذ على حصة 50 في المائة في أعمال حافلات Jiangsu YiNeng Electric، التي تصنع وتسوق منتجات الحافلات في الصين وحققت مبيعات بقيمة 60 مليون دولار أمريكي في عام 2020.
(المصدر: إيتون، بيان صحفي، 2021)
تغطية تقرير سوق الحافلات والمنتجات النهائية
يوفر تقرير "حجم سوق الحافلات والتوقعات (2021-2031)" تحليلاً مفصلاً للسوق يغطي المجالات التالية:
- حجم السوق والتوقعات على المستويات العالمية والإقليمية والوطنية لجميع قطاعات السوق الرئيسية التي يغطيها النطاق
- ديناميكيات السوق مثل المحركات والقيود والفرص الرئيسية
- الاتجاهات المستقبلية الرئيسية
- تحليل مفصل لقوى PEST/Porter الخمس وSWOT
- تحليل السوق العالمي والإقليمي الذي يغطي اتجاهات السوق الرئيسية واللاعبين الرئيسيين واللوائح والتطورات الأخيرة في السوق
- تحليل المشهد الصناعي والمنافسة الذي يغطي تركيز السوق، وتحليل خريطة الحرارة، واللاعبين البارزين، والتطورات الأخيرة
- ملفات تعريف الشركة التفصيلية

نافين خبيرٌ متمرسٌ في أبحاث السوق والاستشارات، يتمتع بخبرةٍ تزيد عن 9 سنوات في مشاريع مُخصصة ومُشتركة واستشارية. يشغل حاليًا منصب نائب الرئيس المساعد، وقد نجح في إدارة أصحاب المصلحة عبر سلسلة قيمة المشاريع، وألّف أكثر من 100 تقرير بحثي وأكثر من 30 مهمة استشارية. يمتد نطاق عمله ليشمل مشاريع صناعية وحكومية، مساهمًا بشكل كبير في نجاح العملاء واتخاذ القرارات القائمة على البيانات.
نافين حاصلٌ على شهادة في هندسة الإلكترونيات والاتصالات من جامعة فرجينيا التقنية، كارناتاكا، وشهادة ماجستير في إدارة الأعمال في التسويق والعمليات من جامعة مانيبال. وهو عضوٌ نشطٌ في معهد مهندسي الكهرباء والإلكترونيات (IEEE) لمدة 9 سنوات، حيث شارك في مؤتمراتٍ وندواتٍ تقنية، وتطوّع على مستوى الأقسام والمناطق. قبل منصبه الحالي، عمل مستشارًا استراتيجيًا مساعدًا في IndustryARC، ومستشارًا للخوادم الصناعية في شركة هيوليت باكارد (HP Global).
- التحليل التاريخي (سنتان)، سنة الأساس، التوقعات (7 سنوات) مع معدل النمو السنوي المركب
- تحليل PEST و SWOT
- حجم السوق والقيمة / الحجم - عالمي، إقليمي، بلد
- الصناعة والمنافسة
- مجموعة بيانات إكسل
التقارير الحديثة
شهادات العملاء
تقرير سوق أنظمة SCADA من Insight Partners شامل، ويقدم رؤى قيّمة حول الاتجاهات الحالية والتوقعات المستقبلية. تميّز الفريق باحترافية عالية وسرعة في الاستجابة ودعم مستمر طوال الوقت. نحن راضون جدًا ونوصي بشدة بخدماتهم.
ران كيديم شريك, شركة ريالي تكنولوجيز المحدودةطلبتُ تقريرًا عن سوق برمجيات محدد، وأعدّه الفريق في غضون أيام قليلة. كانت المعلومات ذات صلة وثيقة وعرضها جيد. ثم طلبتُ بعض التعديلات والإضافات على التقرير. وكان الفريق متجاوبًا للغاية، وحصلتُ على التقرير النهائي في أقل من أسبوع.
جان هيرفيه جين رئيس مجلس الإدارة, فيوتشر أناليتيكاعملنا مع شركة "إنسايت بارتنرز" لإجراء دراسة سوقية وتوقعات مهمة. زودونا برؤى واضحة حول الفرص والمخاطر، مما ساعدنا في صياغة خططنا. كانت أبحاثهم سهلة الاستخدام ومبنية على بيانات دقيقة، مما ساعدنا على اتخاذ قرارات ذكية وواثقة. نوصي بهم بشدة.
بيوش ناجبال نائب الرئيس الأول, شعاع عالي عالميقدّمت شركة Insight Partners أبحاثًا سوقية ثاقبة ومنظمة جيدًا بخبرة واسعة في هذا المجال. تميّز فريقهم بالاحترافية وسرعة الاستجابة طوال الوقت. وسهّل موقعهم الإلكتروني سهل الاستخدام الوصول إلى تقارير القطاع. نوصي بهم بشدة لخدمات بحثية موثوقة وعالية الجودة.
يوكيهيكو أداتشي المدير التنفيذي, ديب بلو، ذ.م.م.هذه أول مرة أشتري فيها تقرير سوق من The Insight Partners. رغم أنني كنت مترددًا في البداية، إلا أنني زرت موقعهم الإلكتروني وشعرت براحة أكبر للمخاطرة وشراء تقرير السوق. أنا راضٍ تمامًا عن جودة التقرير وخدمة العملاء. كانت لديّ عدة أسئلة وتعليقات حول التقرير الأولي، ولكن بعد بضع محادثات عبر البريد الإلكتروني مع محللهم، أعتقد أن لديّ تقريرًا يمكنني استخدامه كمدخل لعملية التخطيط الاستراتيجي لدينا. شكرًا جزيلاً لكم على تخصيص وقتكم الإضافي وجعل هذه التجربة إيجابية. سأوصي بخدماتكم للآخرين بالتأكيد، وستكونون أول من ألجأ إليه عندما نحتاج إلى المزيد من بيانات السوق.
جون سوزوكي الرئيس والرئيس التنفيذي وعضو مجلس الإدارة, بي كيه تكنولوجيزأود أن أقدّر دعمكم واحترافيتكم في الاستجابة لطلبي للحصول على معلومات بشأن سوق التشخيص المخبري للأمراض المعدية في نيجيريا. كما أُقدّر صبركم وتوجيهكم، واستعدادكم لتقديم خصم، مما مكّننا في النهاية من إتمام الصفقة. أتطلع إلى التعامل مع "ذا إنسايت بارتنرز" مستقبلًا، كل ذلك بفضل الانطباع الذي تركتموه لديّ نتيجةً لهذا اللقاء الأول.
الدكتور تشيجيوك أونيا المدير الإداري, شركة باينكريست للرعاية الصحية المحدودةسبب الشراء
- اتخاذ قرارات مدروسة
- فهم ديناميكيات السوق
- تحليل المنافسة
- رؤى العملاء
- توقعات السوق
- تخفيف المخاطر
- التخطيط الاستراتيجي
- مبررات الاستثمار
- تحديد الأسواق الناشئة
- تحسين استراتيجيات التسويق
- تعزيز الكفاءة التشغيلية
- مواكبة التوجهات التنظيمية


 احصل على عينة مجانية ل - سوق باصواي