تحليل سوق أدوات تقويم الأسنان وتوقعاته حسب الحجم والمشاركة والنمو والاتجاهات 2028
البيانات التاريخية : 2020-2021 | سنة الأساس : 2022 | فترة التنبؤ : 2023-2028توقعات سوق أجهزة تنظيف الأسنان حتى عام 2028 - تأثير جائحة كوفيد-19 والتحليل العالمي حسب المنتج (أجهزة تنظيف الأسنان الآلية، وأجهزة تنظيف الأسنان المحمولة، وحشوات أجهزة التنظيف)، والتطبيق (طب دواعم الأسنان، وعلاج لب الأسنان، وغيرها)، والمستخدم النهائي (المستشفيات، وعيادات الأسنان، وغيرها)
- تاريخ التقرير : Jun 2022
- رمز التقرير : TIPRE00029442
- الفئة : علوم الحياة
- الحالة : نُشرت
- تنسيقات التقارير المتاحة :


- عدد الصفحات : 173
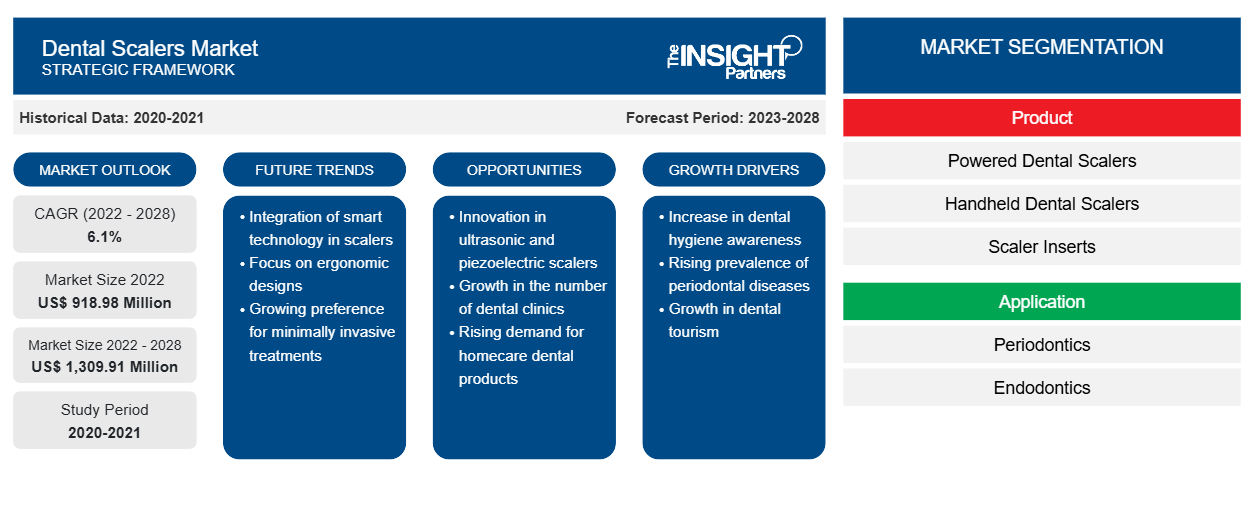
من المتوقع أن ينمو سوق أجهزة تنظيف الأسنان من 918.98 مليون دولار أمريكي في عام 2022 إلى 1،309.91 مليون دولار أمريكي بحلول عام 2028؛ ومن المتوقع أن ينمو بمعدل نمو سنوي مركب قدره 6.1٪ من عام 2022 إلى عام 2028.
إن العدد المتزايد من أطباء الأسنان والمبادرات الرامية إلى التوعية بصحة الفم تدفع نمو السوق. وعلاوة على ذلك، من المرجح أن يظهر الطلب على أجهزة التقشير بالموجات فوق الصوتية كأحد الاتجاهات المستقبلية المهمة في السوق خلال فترة التنبؤ. ومع ذلك، فإن التكلفة العالية لعلاج الأسنان تعيق نمو سوق أجهزة التقشير . وقد أدت التطورات التكنولوجية إلى زيادة الطلب على أجهزة التقشير بالموجات فوق الصوتية. وهي تعتمد على موجات صوتية منخفضة التردد للاهتزاز ضد أسنانك، وإزالة تراكم الجير الصعب بشكل فعال. هناك نوعان من أجهزة التقشير بالموجات فوق الصوتية. يعمل النموذج المغناطيسي بسرعة تتراوح بين 25000 و30000 دورة في الثانية، حيث يتحرك الرأس في حركة دائرية. تتحرك أداة التقشير الكهرضغطية بسرعة تتراوح بين 28000 و36000 دورة في الثانية بينما يهتز الطرف ذهابًا وإيابًا ضد السن.
تتضمن فوائد أجهزة تقشير الأسنان بالموجات فوق الصوتية مقارنة بأجهزة التقشير التقليدية ألمًا أقل مقارنة بأدوات التقشير التقليدية. تتعرض الأنسجة الحساسة لصدمات أقل مع أجهزة تقشير الأسنان بالموجات فوق الصوتية. أجهزة تقشير الأسنان أكثر فعالية في إزالة تراكم الجير من المكشطة اليدوية. يسمح طرف الرش بتنظيف الحطام من الأسنان أثناء عمل طبيب الأسنان. يمكن لأجهزة الرش إعطاء الماء أو عامل مضاد للبكتيريا بكفاءة. يمكن إزالة البقع السطحية في هذه العملية مع إعطاء الأسنان لمعانًا أكثر بياضًا. الوقت المستغرق لإزالة تراكم الجير باستخدام جهاز تقشير الأسنان بالموجات فوق الصوتية أقل من الوقت المستغرق في جهاز التقشير التقليدي. تتطلب هذه الأجهزة كمية أقل من الماء أثناء إجراءات تقشير الأسنان
قم بتخصيص هذا التقرير ليناسب متطلباتك
ستحصل على تخصيص لأي تقرير - مجانًا - بما في ذلك أجزاء من هذا التقرير، أو تحليل على مستوى الدولة، وحزمة بيانات Excel، بالإضافة إلى الاستفادة من العروض والخصومات الرائعة للشركات الناشئة والجامعات
سوق أجهزة تنظيف الأسنان: رؤى استراتيجية
-
احصل على أهم اتجاهات السوق الرئيسية لهذا التقرير.ستتضمن هذه العينة المجانية تحليلاً للبيانات، بدءًا من اتجاهات السوق وحتى التقديرات والتوقعات.
علاوة على ذلك، تضمن أجهزة التقشير بالموجات فوق الصوتية إزالة ممتازة للبقع مقارنة بالتقشير اليدوي. كل هذه الفوائد لأجهزة التقشير بالموجات فوق الصوتية تعمل على دفع سوق أجهزة التقشير بالموجات فوق الصوتية إلى النمو.
فيما يلي لمحة عامة عن الإطلاقات الأخيرة لأجهزة تنظيف الأسنان بالموجات فوق الصوتية:
- في يناير 2021، أطلقت شركة Xiaomi جهاز Sunuo T11 Pro Smart Visual Ultrasonic Dental Scaler بتمويل جماعي على منصة Youpin. وهو جهاز محمول بالموجات فوق الصوتية يمكن استخدامه مباشرة في المنزل دون الحاجة إلى زيارة عيادات الأسنان .
- في يوليو 2017، أطلقت شركة OSUNG مفتاح عزم الدوران ورؤوس القشارة بالموجات فوق الصوتية المتوافقة مع أنظمة EMS وSATELEC.
ومن المتوقع أن تعمل العوامل المذكورة أعلاه على تعزيز نمو سوق أجهزة تنظيف الأسنان من عام 2022 إلى عام 2028.
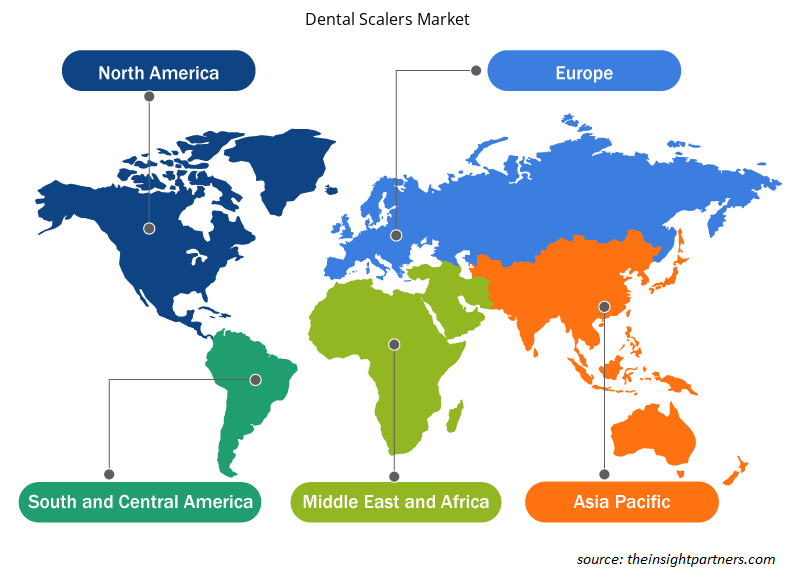
من المتوقع أن تستمر أمريكا الشمالية في هيمنتها على سوق أجهزة تنظيف الأسنان من عام 2022 إلى عام 2028. ومن المتوقع أن تشهد المنطقة طلبًا كبيرًا على أجهزة تنظيف الأسنان خلال فترة التوقعات، بمساعدة النمو السكاني مع انتشار كبير لاضطرابات الأسنان والتركيز الكبير على صحة الفم الجيدة. كما يدعم العديد من اللاعبين في السوق في المنطقة وتطوير علاجات الأسنان الوقائية سوق أجهزة تنظيف الأسنان في أمريكا الشمالية. احتلت الولايات المتحدة أكبر حصة سوقية في سوق أمريكا الشمالية من عام 2022 إلى عام 2028، ومن المتوقع أن تنمو بسبب التبني المتزايد للتقدم التكنولوجي والتركيز المتزايد على تحسين نتائج العلاج. يؤثر الانتشار المتزايد لأمراض الفم والتشوهات في السكان على الطلب على خدمات طب الأسنان في الولايات المتحدة. وفقًا لمراكز السيطرة على الأمراض والوقاية منها في الولايات المتحدة، قام 84.9% من الأطفال الذين تتراوح أعمارهم بين 2 و17 عامًا، و64.0% من البالغين الذين تتراوح أعمارهم بين 18 و64 عامًا، و65.6% من البالغين الذين تبلغ أعمارهم 65 عامًا أو أكثر بزيارة طبيب الأسنان مرة واحدة على الأقل في عام 2018. وفي دراسة نُشرت في جمعية طب الأسنان الأمريكية، فإن التقليح وتحضير الجذور مفيدان للمرضى الذين يعانون من التهاب دواعم السن المزمن. أصبحت رعاية الفم والأسنان أكثر تقدمًا وذكاءً في الولايات المتحدة. لذلك، يوفر التقدم التكنولوجي في طب الأسنان العديد من المزايا لتسهيل عمل أطباء الأسنان ومستخدمي خدمات طب الأسنان التي أصبحت أكثر تطلبًا من حيث الجماليات. هذه العوامل المذكورة أعلاه تدفع نمو سوق أجهزة تقشير الأسنان.
رؤى المستخدم النهائي
بناءً على المستخدم النهائي، يتم تقسيم سوق أجهزة تنظيف الأسنان إلى مستشفيات وعيادات أسنان وغيرها. احتل قطاع المستشفيات أكبر حصة سوقية في عام 2022. ومع ذلك، من المتوقع أن يشهد قطاع عيادات الأسنان أعلى نمو خلال فترة التنبؤ. المستشفيات هي مراكز الرعاية الصحية الأولية التي يبحث عنها المرضى للحصول على الإسعافات الأولية والعلاج. عدد المرضى الذين يزورون المستشفيات أكثر من مراكز الرعاية الصحية الأخرى. مع التطور في تكنولوجيا الرعاية الصحية، كانت هناك زيادة في التكاليف الطبية في العقود القليلة الماضية. إن الانتشار المتزايد لأمراض واضطرابات الأسنان المختلفة التي يمكن علاجها في المستشفيات، وزيادة عدد المرضى بسبب الوعي بخدمات المستشفيات، وإنشاء مستشفيات جديدة في البلدان النامية والمناطق الريفية قد دعم نمو سوق أجهزة تنظيف الأسنان.
تتبنى الشركات العاملة في سوق أجهزة تنظيف الأسنان استراتيجية ابتكار المنتجات لتلبية متطلبات العملاء المتطورة في جميع أنحاء العالم، مما يسمح لها بالحفاظ على اسم علامتها التجارية في سوق أجهزة تنظيف الأسنان العالمية. scalers market adopt the product innovation strategy to meet the evolving customer demands worldwide, allowing them to maintain their brand name in the global dental scalers market.
رؤى إقليمية حول سوق أجهزة تنظيف الأسنانScalers Market Regional Insights
لقد قام المحللون في Insight Partners بشرح الاتجاهات والعوامل الإقليمية المؤثرة على سوق أجهزة تقشير الأسنان طوال فترة التوقعات بشكل شامل. يناقش هذا القسم أيضًا قطاعات سوق أجهزة تقشير الأسنان والجغرافيا في جميع أنحاء أمريكا الشمالية وأوروبا ومنطقة آسيا والمحيط الهادئ والشرق الأوسط وأفريقيا وأمريكا الجنوبية والوسطى.Scalers Market throughout the forecast period have been thoroughly explained by the analysts at Insight Partners. This section also discusses Dental Scalers Market segments and geography across North America, Europe, Asia Pacific, Middle East and Africa, and South and Central America.
- احصل على البيانات الإقليمية المحددة لسوق أجهزة تنظيف الأسنان
نطاق تقرير سوق أجهزة تنظيف الأسنان
| سمة التقرير | تفاصيل |
|---|---|
| حجم السوق في عام 2022 | 918.98 مليون دولار أمريكي |
| حجم السوق بحلول عام 2028 | 1,309.91 مليون دولار أمريكي |
| معدل النمو السنوي المركب العالمي (2022 - 2028) | 6.1% |
| البيانات التاريخية | 2020-2021 |
| فترة التنبؤ | 2023-2028 |
| القطاعات المغطاة |
حسب المنتج
|
| المناطق والدول المغطاة |
أمريكا الشمالية
|
| قادة السوق وملفات تعريف الشركات الرئيسية |
|
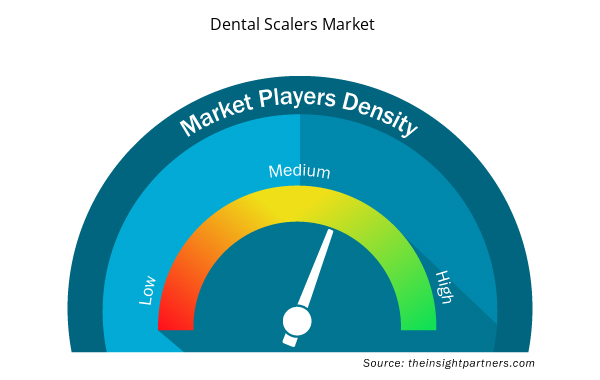
كثافة اللاعبين في سوق أجهزة تنظيف الأسنان: فهم تأثيرها على ديناميكيات الأعمال
يشهد سوق أجهزة تنظيف الأسنان نموًا سريعًا، مدفوعًا بالطلب المتزايد من جانب المستخدم النهائي بسبب عوامل مثل تفضيلات المستهلكين المتطورة والتقدم التكنولوجي والوعي المتزايد بفوائد المنتج. ومع ارتفاع الطلب، تعمل الشركات على توسيع عروضها والابتكار لتلبية احتياجات المستهلكين والاستفادة من الاتجاهات الناشئة، مما يؤدي إلى زيادة نمو السوق.
تشير كثافة اللاعبين في السوق إلى توزيع الشركات أو المؤسسات العاملة في سوق أو صناعة معينة. وهي تشير إلى عدد المنافسين (اللاعبين في السوق) الموجودين في مساحة سوق معينة نسبة إلى حجمها أو قيمتها السوقية الإجمالية.
الشركات الرئيسية العاملة في سوق أجهزة تنظيف الأسنان هي:
- شركة دنتسبلي سيرونا
- هنري شين، المحدودة
- شركة دن مات القابضة المحدودة
- شركة هو-فريدي للتصنيع المحدودة
- براسيلر الولايات المتحدة الأمريكية
إخلاء المسؤولية : الشركات المذكورة أعلاه ليست مرتبة بأي ترتيب معين.
- احصل على نظرة عامة على أهم اللاعبين الرئيسيين في سوق أجهزة تنظيف الأسنان
سوق أجهزة تنظيف الأسنان – التجزئة
بناءً على المنتج، يتم تقسيم سوق أجهزة تقشير الأسنان إلى أجهزة تقشير أسنان تعمل بالطاقة وأجهزة تقشير أسنان محمولة باليد وحشوات تقشير. بناءً على التطبيق، يتم تقسيم السوق إلى أمراض اللثة وعلاج لب الأسنان وغيرها. بناءً على المستخدم النهائي، يتم تقسيم السوق إلى مستشفيات وعيادات أسنان وغيرها. من حيث الجغرافيا، يتم تقسيم سوق أجهزة تقشير الأسنان بشكل أساسي إلى أمريكا الشمالية وأوروبا وآسيا والمحيط الهادئ والشرق الأوسط وأفريقيا (MEA) وأمريكا الجنوبية والوسطى (SAM). يتم تقسيم السوق في أمريكا الشمالية إلى الولايات المتحدة وكندا والمكسيك. يتم تقسيم السوق الأوروبية إلى فرنسا وألمانيا والمملكة المتحدة وإسبانيا وإيطاليا وبقية أوروبا. يتم تقسيم السوق في آسيا والمحيط الهادئ إلى الصين والهند واليابان وأستراليا وكوريا الجنوبية وبقية آسيا والمحيط الهادئ. يتم تقسيم السوق في الشرق الأوسط وأفريقيا إلى المملكة العربية السعودية والإمارات العربية المتحدة وجنوب إفريقيا وبقية الشرق الأوسط وأفريقيا. يتم تقسيم السوق في جنوب إفريقيا إلى البرازيل والأرجنتين وبقية أمريكا الجنوبية. هناك عدد قليل من الشركات العاملة في السوق وهي: DENTSPLY SIRONA Inc.؛ وHENRY SCHEIN, INC؛ وDen-Mat Holdings, LLC؛ وHu-Friedy Mfg. Co., LLC.؛ وBrasseler USA؛ وENVISTA HOLDINGS CORPORATION؛ وCOLTENE Group؛ وBeyes؛ وNakanishi Inc.؛ وTeKne Dental srl.

مرينال محللة أبحاث مخضرمة، تتمتع بخبرة تزيد عن 8 سنوات في مجال استخبارات واستشارات سوق علوم الحياة. بفضل عقليتها الاستراتيجية والتزامها الراسخ بالتميز، اكتسبت خبرة واسعة في التنبؤ بالصناعات الدوائية، وتقييم فرص السوق، وتطوير معايير الصناعة. يرتكز عملها على تقديم رؤى عملية تُمكّن العملاء من اتخاذ قرارات استراتيجية مدروسة.
تكمن قوة مرينال الأساسية في ترجمة مجموعات البيانات الكمية المعقدة إلى معلومات استخباراتية قيّمة. وتُعدّ براعتها التحليلية ركيزةً أساسيةً في صياغة استراتيجيات دخول السوق (GTM) واكتشاف فرص النمو في قطاعي الأدوية والأجهزة الطبية. وبصفتها مستشارةً موثوقةً، تُركز مرينال باستمرار على تبسيط إجراءات سير العمل وترسيخ أفضل الممارسات، مما يُعزز الابتكار والكفاءة التشغيلية لعملائها.
- التحليل التاريخي (سنتان)، سنة الأساس، التوقعات (7 سنوات) مع معدل النمو السنوي المركب
- تحليل PEST و SWOT
- حجم السوق والقيمة / الحجم - عالمي، إقليمي، بلد
- الصناعة والمنافسة
- مجموعة بيانات إكسل
التقارير الحديثة
تقارير ذات صلة
شهادات العملاء
تقرير سوق أنظمة SCADA من Insight Partners شامل، ويقدم رؤى قيّمة حول الاتجاهات الحالية والتوقعات المستقبلية. تميّز الفريق باحترافية عالية وسرعة في الاستجابة ودعم مستمر طوال الوقت. نحن راضون جدًا ونوصي بشدة بخدماتهم.
ران كيديم شريك, شركة ريالي تكنولوجيز المحدودةطلبتُ تقريرًا عن سوق برمجيات محدد، وأعدّه الفريق في غضون أيام قليلة. كانت المعلومات ذات صلة وثيقة وعرضها جيد. ثم طلبتُ بعض التعديلات والإضافات على التقرير. وكان الفريق متجاوبًا للغاية، وحصلتُ على التقرير النهائي في أقل من أسبوع.
جان هيرفيه جين رئيس مجلس الإدارة, فيوتشر أناليتيكاعملنا مع شركة "إنسايت بارتنرز" لإجراء دراسة سوقية وتوقعات مهمة. زودونا برؤى واضحة حول الفرص والمخاطر، مما ساعدنا في صياغة خططنا. كانت أبحاثهم سهلة الاستخدام ومبنية على بيانات دقيقة، مما ساعدنا على اتخاذ قرارات ذكية وواثقة. نوصي بهم بشدة.
بيوش ناجبال نائب الرئيس الأول, شعاع عالي عالميقدّمت شركة Insight Partners أبحاثًا سوقية ثاقبة ومنظمة جيدًا بخبرة واسعة في هذا المجال. تميّز فريقهم بالاحترافية وسرعة الاستجابة طوال الوقت. وسهّل موقعهم الإلكتروني سهل الاستخدام الوصول إلى تقارير القطاع. نوصي بهم بشدة لخدمات بحثية موثوقة وعالية الجودة.
يوكيهيكو أداتشي المدير التنفيذي, ديب بلو، ذ.م.م.هذه أول مرة أشتري فيها تقرير سوق من The Insight Partners. رغم أنني كنت مترددًا في البداية، إلا أنني زرت موقعهم الإلكتروني وشعرت براحة أكبر للمخاطرة وشراء تقرير السوق. أنا راضٍ تمامًا عن جودة التقرير وخدمة العملاء. كانت لديّ عدة أسئلة وتعليقات حول التقرير الأولي، ولكن بعد بضع محادثات عبر البريد الإلكتروني مع محللهم، أعتقد أن لديّ تقريرًا يمكنني استخدامه كمدخل لعملية التخطيط الاستراتيجي لدينا. شكرًا جزيلاً لكم على تخصيص وقتكم الإضافي وجعل هذه التجربة إيجابية. سأوصي بخدماتكم للآخرين بالتأكيد، وستكونون أول من ألجأ إليه عندما نحتاج إلى المزيد من بيانات السوق.
جون سوزوكي الرئيس والرئيس التنفيذي وعضو مجلس الإدارة, بي كيه تكنولوجيزأود أن أقدّر دعمكم واحترافيتكم في الاستجابة لطلبي للحصول على معلومات بشأن سوق التشخيص المخبري للأمراض المعدية في نيجيريا. كما أُقدّر صبركم وتوجيهكم، واستعدادكم لتقديم خصم، مما مكّننا في النهاية من إتمام الصفقة. أتطلع إلى التعامل مع "ذا إنسايت بارتنرز" مستقبلًا، كل ذلك بفضل الانطباع الذي تركتموه لديّ نتيجةً لهذا اللقاء الأول.
الدكتور تشيجيوك أونيا المدير الإداري, شركة باينكريست للرعاية الصحية المحدودةسبب الشراء
- اتخاذ قرارات مدروسة
- فهم ديناميكيات السوق
- تحليل المنافسة
- رؤى العملاء
- توقعات السوق
- تخفيف المخاطر
- التخطيط الاستراتيجي
- مبررات الاستثمار
- تحديد الأسواق الناشئة
- تحسين استراتيجيات التسويق
- تعزيز الكفاءة التشغيلية
- مواكبة التوجهات التنظيمية


 احصل على عينة مجانية ل - سوق أجهزة تنظيف الأسنان