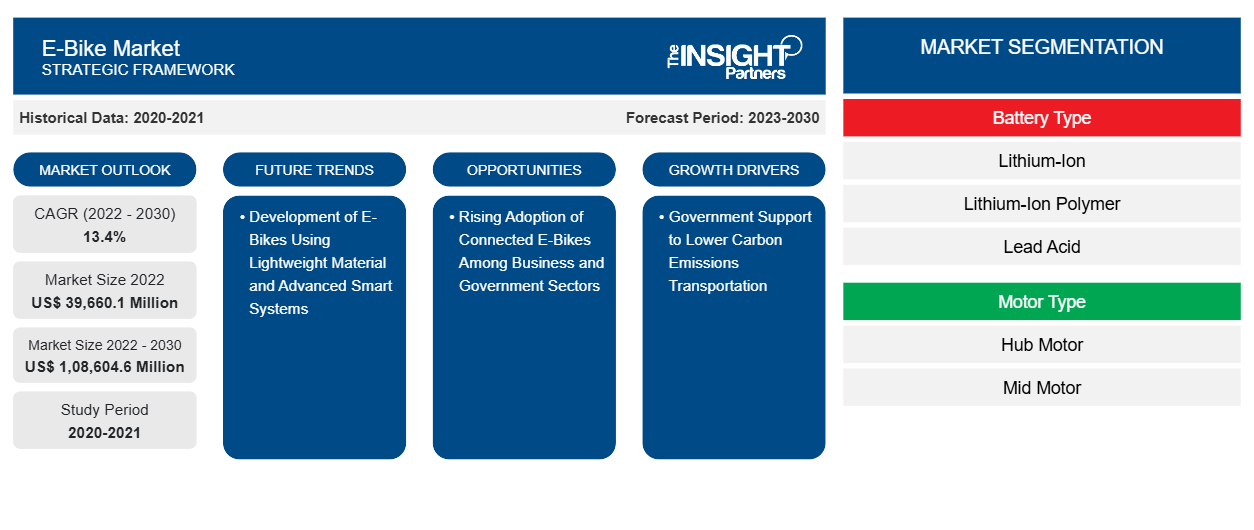
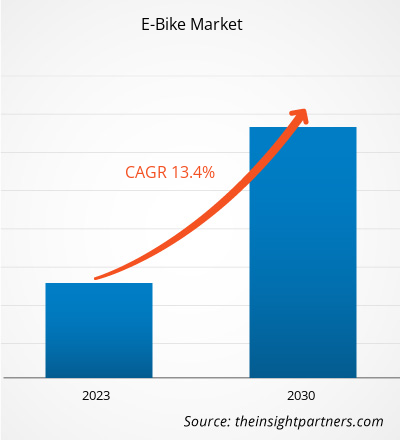
من المتوقع أن ينمو سوق الدراجات الإلكترونية من 39،660.1 مليون دولار أمريكي في عام 2022 إلى 1،08،604.6 مليون دولار أمريكي بحلول عام 2030. ومن المتوقع أن يسجل سوق الدراجات الإلكترونية معدل نمو سنوي مركب بنسبة 13.4٪ من عام 2022 إلى عام 2030.
ومن المرجح أن يظل التطوير المتزايد للدراجات الإلكترونية باستخدام مواد خفيفة الوزن وأنظمة ذكية متقدمة يمثل اتجاهًا رئيسيًا في السوق.
تحليل سوق الدراجات الإلكترونية
يشمل أصحاب المصلحة في النظام البيئي العالمي لسوق الدراجات الإلكترونية موردي المواد الخام ومصنعي مكونات الدراجات الإلكترونية والمستخدمين النهائيين. يلعب موردو المكونات دورًا حاسمًا في النظام البيئي لسوق الدراجات الإلكترونية من خلال توفير المواد والمعدات والتقنيات الأساسية اللازمة لتصميم وتصنيع وتثبيت أنظمة الدراجات الإلكترونية. يساهم هؤلاء الموردون في النمو الإجمالي لصناعة الدراجات الإلكترونية وكفاءتها وأدائها. يلعب مورد المواد الخام دورًا حاسمًا في تصنيع الدراجات الإلكترونية. تعد الصين مركزًا لتوريد المواد الخام وموردي المكونات من أجل تصنيع الدراجات الإلكترونية. تساهم الصين بأكثر من 50٪ من الحصة في الإنتاج الإجمالي وتوريد المواد الخام والمكونات المطلوبة لسوق الدراجات الإلكترونية. المكونات الرئيسية المطلوبة هي البطاريات والمحرك. يتم تصنيع هذه المكونات على نطاق واسع في الصين وألمانيا وإيطاليا واليابان والولايات المتحدة.
نظرة عامة على سوق الدراجات الإلكترونية
تشمل الجهات المعنية الرئيسية في النظام البيئي العالمي لسوق الدراجات الإلكترونية موردي المواد الخام وموردي المكونات والعملاء أو المستخدمين النهائيين. يعد مزود المواد الخام أحد الجهات المعنية الأساسية في النظام البيئي لسوق الدراجات الإلكترونية. تشمل الأجزاء الرئيسية للقارب الكهربائي البلاستيك والصلب والألمنيوم والخشب والمطاط وغيرها من الأجزاء. يشمل مزودو المكونات مصنعي أجزاء القوارب البحرية وموردي الشواحن. المستخدمون النهائيون الرئيسيون الذين يطلبون القوارب الكهربائية هم أصحاب القوارب ومقدمو خدمات تأجير القوارب. يشمل موردو المواد الخام الرئيسيون شركة Duffy Electric Boat Company وEvoy وRAND Boats وغيرها من اللاعبين.
يشمل المستخدمون النهائيون الرئيسيون لسوق الدراجات الإلكترونية الهواة ومستخدمي الرحلات والسكان الحضريين. ويعزى النمو في المقام الأول إلى الدعم الحكومي والمبادرات لتبني الدراجات الإلكترونية في مختلف البلدان. كما أن الاستثمارات المتزايدة من قبل اللاعبين الرئيسيين في السوق لتوسيع مصنع تصنيع الدراجات الإلكترونية تدفع نمو السوق. في أبريل 2023، خططت شركة EMotorad المصنعة للدراجات الإلكترونية لزيادة قدرتها الإنتاجية من الدراجات الإلكترونية في عام 2024. جمعت الشركة تمويلًا يزيد عن 30 مليون دولار أمريكي لهذا التوسع بهدف تعزيز النقل الأخضر.
قم بتخصيص هذا التقرير ليناسب متطلباتك
ستحصل على تخصيص لأي تقرير - مجانًا - بما في ذلك أجزاء من هذا التقرير، أو تحليل على مستوى الدولة، وحزمة بيانات Excel، بالإضافة إلى الاستفادة من العروض والخصومات الرائعة للشركات الناشئة والجامعات
سوق الدراجات الإلكترونية:
- احصل على أهم اتجاهات السوق الرئيسية لهذا التقرير.ستتضمن هذه العينة المجانية تحليلاً للبيانات، بدءًا من اتجاهات السوق وحتى التقديرات والتوقعات.
محركات وفرص سوق الدراجات الإلكترونية
دعم الحكومة لخفض انبعاثات الكربون في قطاع النقل
تعمل الحوافز والخطط التي تقودها الحكومة على تعزيز تبني الدراجات الإلكترونية في جميع أنحاء العالم. على سبيل المثال، توفر حكومة الهند شركة تابعة لمستخدمي الدراجات الإلكترونية. تعد Trek Bicycle Corporation وDerby Cycle AG وFuji Ta Bicycle Co.، Ltd. وAccell Group NV وRobert Bosch GmbH وGiant Manufacturing من الشركات المصنعة الرئيسية التي تركز على التكنولوجيا والتقدم المحرز في معدات الدراجات الإلكترونية التي تعمل بشكل صحيح. على سبيل المثال، في أغسطس 2023، أطلقت شركة Robert Bosch GmbH محرك Performance SX لأحدث طرازات الدراجات الإلكترونية. يتميز هذا المحرك بتصميم قوي ومضغوط وثوري للغاية لتصنيع الدراجات الإلكترونية خفيفة الوزن.
تزايد استخدام الدراجات الإلكترونية المتصلة بين قطاعي الأعمال والحكومة
من المتوقع أن يؤدي تزايد تبني وتطوير نماذج الدراجات الإلكترونية ومنصات مشاركة الدراجات الإلكترونية بين الأفراد في جميع أنحاء العالم إلى خلق فرص كبيرة لنمو السوق. تطلق العديد من الشركات منصات مشاركة الدراجات الإلكترونية لتجنب مشاكل الازدحام المروري في جميع أنحاء العالم، ومن المتوقع أن يخلق ذلك فرصًا هائلة في المستقبل القريب.
تحليل تجزئة تقرير سوق الدراجات الإلكترونية
إن القطاعات الرئيسية التي ساهمت في اشتقاق تحليل سوق الدراجات الإلكترونية هي نوع البطارية ونوع المحرك والفئة.
- وفقًا لنوع البطارية، يتم تقسيم سوق الدراجات الإلكترونية إلى بطاريات ليثيوم أيون، وبطاريات ليثيوم أيون بوليمر، وبطاريات الرصاص الحمضية، وبطاريات هيدريد النيكل المعدني. احتلت شريحة بطاريات ليثيوم أيون الحصة الأكبر في السوق في عام 2022.
- وفقًا لنوع المحرك، ينقسم سوق الدراجات الإلكترونية إلى محركات محورية ومحرك متوسط. احتلت شريحة المحركات المتوسطة حصة سوقية أكبر في عام 2022.
- بناءً على الفئة، يتم تقسيم السوق إلى الفئة الأولى والفئة الثانية والفئة الثانية. احتلت الفئة الأولى حصة سوقية أكبر في عام 2022.
تحليل حصة سوق الدراجات الإلكترونية حسب المنطقة الجغرافية
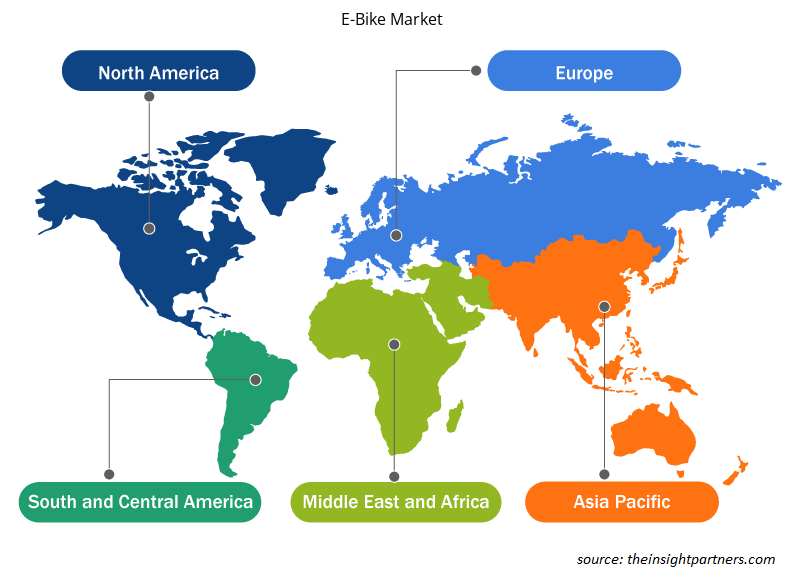
يتم تقسيم النطاق الجغرافي لتقرير سوق الدراجات الإلكترونية بشكل أساسي إلى خمس مناطق: أمريكا الشمالية، ومنطقة آسيا والمحيط الهادئ، وأوروبا، والشرق الأوسط وأفريقيا، وأمريكا الجنوبية والوسطى.
يشمل نطاق تقرير سوق الدراجات الإلكترونية أمريكا الشمالية (الولايات المتحدة وكندا والمكسيك) وأوروبا (روسيا والمملكة المتحدة وفرنسا وألمانيا وإيطاليا وبقية أوروبا) وآسيا والمحيط الهادئ (كوريا الجنوبية والهند وأستراليا واليابان والصين وبقية آسيا والمحيط الهادئ) والشرق الأوسط وأفريقيا (المملكة العربية السعودية وجنوب إفريقيا والإمارات العربية المتحدة وبقية الشرق الأوسط وأفريقيا) وأمريكا الجنوبية والوسطى (الأرجنتين والبرازيل وبقية أمريكا الجنوبية والوسطى). من حيث الإيرادات، سيطرت منطقة آسيا والمحيط الهادئ على حصة سوق الدراجات الإلكترونية في عام 2022. تعد أوروبا ثاني أكبر مساهم في سوق الدراجات الإلكترونية العالمية، تليها أمريكا الشمالية.
رؤى إقليمية حول سوق الدراجات الإلكترونية
لقد قام المحللون في Insight Partners بشرح الاتجاهات والعوامل الإقليمية المؤثرة على سوق الدراجات الإلكترونية طوال فترة التوقعات بشكل شامل. يناقش هذا القسم أيضًا قطاعات سوق الدراجات الإلكترونية والجغرافيا في جميع أنحاء أمريكا الشمالية وأوروبا ومنطقة آسيا والمحيط الهادئ والشرق الأوسط وأفريقيا وأمريكا الجنوبية والوسطى.
- احصل على البيانات الإقليمية المحددة لسوق الدراجات الإلكترونية
نطاق تقرير سوق الدراجات الإلكترونية
| سمة التقرير | تفاصيل |
|---|---|
| حجم السوق في عام 2022 | 39,660.1 مليون دولار أمريكي |
| حجم السوق بحلول عام 2030 | 1,08,604.6 مليون دولار أمريكي |
| معدل النمو السنوي المركب العالمي (2022 - 2030) | 13.4% |
| البيانات التاريخية | 2020-2021 |
| فترة التنبؤ | 2023-2030 |
| القطاعات المغطاة | حسب نوع البطارية
|
| المناطق والدول المغطاة | أمريكا الشمالية
|
| قادة السوق وملفات تعريف الشركات الرئيسية |
|
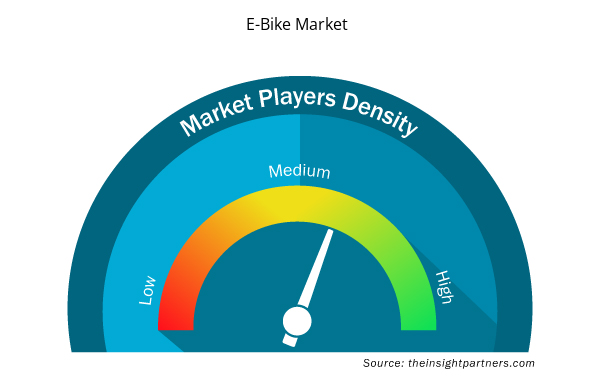
كثافة اللاعبين في سوق الدراجات الإلكترونية: فهم تأثيرها على ديناميكيات الأعمال
يشهد سوق الدراجات الإلكترونية نموًا سريعًا، مدفوعًا بالطلب المتزايد من جانب المستخدم النهائي بسبب عوامل مثل تفضيلات المستهلكين المتطورة والتقدم التكنولوجي والوعي المتزايد بفوائد المنتج. ومع ارتفاع الطلب، تعمل الشركات على توسيع عروضها والابتكار لتلبية احتياجات المستهلكين والاستفادة من الاتجاهات الناشئة، مما يؤدي إلى زيادة نمو السوق.
تشير كثافة اللاعبين في السوق إلى توزيع الشركات أو المؤسسات العاملة في سوق أو صناعة معينة. وهي تشير إلى عدد المنافسين (اللاعبين في السوق) الموجودين في مساحة سوق معينة نسبة إلى حجمها أو قيمتها السوقية الإجمالية.
الشركات الرئيسية العاملة في سوق الدراجات الإلكترونية هي:
- هايبايك
- دراجات أفينتون
- شركة جاينت مانوفاكتشرينج المحدودة
- شركة ميريدا الصناعية المحدودة
- دراجات بيديجو الكهربائية
- شركة روبرت بوش المحدودة
إخلاء المسؤولية : الشركات المذكورة أعلاه ليست مرتبة بأي ترتيب معين.
- احصل على نظرة عامة على أهم اللاعبين الرئيسيين في سوق الدراجات الإلكترونية
أخبار سوق الدراجات الإلكترونية والتطورات الأخيرة
يتم تقييم سوق الدراجات الإلكترونية من خلال جمع البيانات النوعية والكمية بعد البحث الأولي والثانوي، والتي تتضمن منشورات الشركات المهمة وبيانات الجمعيات وقواعد البيانات. فيما يلي بعض التطورات في سوق الدراجات الإلكترونية:
- تم إطلاق Aventon Abound كإضافة عالية الجودة للدراجات الكهربائية المتنامية. تم ربط دراجة الشحن الكهربائية بمحرك محور خلفي بقوة 750 واط. (المصدر: Aventon Abound، بيان صحفي، فبراير 2023)
- أطلقت شركة eBikeGo، وهي شركة هندية متخصصة في نقل الدراجات الكهربائية ذات العجلتين، منتجًا للدراجات الكهربائية باسم Transil e1. تهدف العلامة التجارية eBikeGo من Transil إلى إنتاج دراجات كهربائية فعالة وحديثة ومستدامة للمستهلكين. (المصدر: eBikeGo، بيان صحفي، يناير 2023)
تقرير سوق الدراجات الإلكترونية والتغطية والنتائج المتوقعة
يوفر تقرير "حجم سوق الدراجات الإلكترونية والتوقعات (2020-2030)" تحليلاً مفصلاً للسوق يغطي المجالات التالية:
- حجم سوق الدراجات الإلكترونية وتوقعاته على المستويات العالمية والإقليمية والوطنية لجميع قطاعات السوق الرئيسية التي يغطيها النطاق
- اتجاهات سوق الدراجات الإلكترونية بالإضافة إلى ديناميكيات السوق مثل السائقين والقيود والفرص الرئيسية
- تحليل مفصل لـ PEST و SWOT
- تحليل سوق الدراجات الإلكترونية الذي يغطي اتجاهات السوق الرئيسية والإطار العالمي والإقليمي والجهات الفاعلة الرئيسية واللوائح والتطورات الأخيرة في السوق
- تحليل المشهد الصناعي والمنافسة الذي يغطي تركيز السوق، وتحليل خريطة الحرارة، واللاعبين البارزين، والتطورات الأخيرة لسوق الدراجات الإلكترونية
- ملفات تعريف الشركة التفصيلية
- التحليل التاريخي (سنتان)، السنة الأساسية، التوقعات (7 سنوات) مع معدل النمو السنوي المركب
- تحليل PEST و SWOT
- حجم السوق والقيمة / الحجم - عالميًا وإقليميًا وقطريًا
- الصناعة والمنافسة
- مجموعة بيانات Excel


Report Coverage
Revenue forecast, Company Analysis, Industry landscape, Growth factors, and Trends

Segment Covered
This text is related
to segments covered.

Regional Scope
North America, Europe, Asia Pacific, Middle East & Africa, South & Central America

Country Scope
This text is related
to country scope.
الأسئلة الشائعة
US$ 1,08,604.6 million estimated value of the e-bike market by 2030.
13.4% is the expected CAGR of the e-bike market.
APAC dominated the e-bike market in 2022.
The increasing development of e-bikes using lightweight material and advanced smart systems is likely to remain a key trend in the market.
Haibike, Aventon Bikes, Giant Manufacturing Co Ltd, Merida Industry Co., Ltd., Pedego Electric Bikes, Robert Bosch GmbH, Specialized Bicycle Components, Inc., Shimano Inc., Trek Bicycle Corp., and Yamaha Motor Co Ltd are some of the leading players in the market.
The List of Companies - E-Bike Market
- Haibike
- Aventon Bikes
- Giant Manufacturing Co Ltd
- Merida Industry Co., Ltd.
- Pedego Electric Bikes
- Robert Bosch GmbH
- Specialized Bicycle Components, Inc.
- Shimano Inc.
- Trek Bicycle Corp
- Yamaha Motor Co Ltd
The Insight Partners performs research in 4 major stages: Data Collection & Secondary Research, Primary Research, Data Analysis and Data Triangulation & Final Review.
- Data Collection and Secondary Research:
As a market research and consulting firm operating from a decade, we have published and advised several client across the globe. First step for any study will start with an assessment of currently available data and insights from existing reports. Further, historical and current market information is collected from Investor Presentations, Annual Reports, SEC Filings, etc., and other information related to company’s performance and market positioning are gathered from Paid Databases (Factiva, Hoovers, and Reuters) and various other publications available in public domain.
Several associations trade associates, technical forums, institutes, societies and organization are accessed to gain technical as well as market related insights through their publications such as research papers, blogs and press releases related to the studies are referred to get cues about the market. Further, white papers, journals, magazines, and other news articles published in last 3 years are scrutinized and analyzed to understand the current market trends.
- Primary Research:
The primarily interview analysis comprise of data obtained from industry participants interview and answers to survey questions gathered by in-house primary team.
For primary research, interviews are conducted with industry experts/CEOs/Marketing Managers/VPs/Subject Matter Experts from both demand and supply side to get a 360-degree view of the market. The primary team conducts several interviews based on the complexity of the markets to understand the various market trends and dynamics which makes research more credible and precise.
A typical research interview fulfils the following functions:
- Provides first-hand information on the market size, market trends, growth trends, competitive landscape, and outlook
- Validates and strengthens in-house secondary research findings
- Develops the analysis team’s expertise and market understanding
Primary research involves email interactions and telephone interviews for each market, category, segment, and sub-segment across geographies. The participants who typically take part in such a process include, but are not limited to:
- Industry participants: VPs, business development managers, market intelligence managers and national sales managers
- Outside experts: Valuation experts, research analysts and key opinion leaders specializing in the electronics and semiconductor industry.
Below is the breakup of our primary respondents by company, designation, and region:

Once we receive the confirmation from primary research sources or primary respondents, we finalize the base year market estimation and forecast the data as per the macroeconomic and microeconomic factors assessed during data collection.
- Data Analysis:
Once data is validated through both secondary as well as primary respondents, we finalize the market estimations by hypothesis formulation and factor analysis at regional and country level.
- Macro-Economic Factor Analysis:
We analyse macroeconomic indicators such the gross domestic product (GDP), increase in the demand for goods and services across industries, technological advancement, regional economic growth, governmental policies, the influence of COVID-19, PEST analysis, and other aspects. This analysis aids in setting benchmarks for various nations/regions and approximating market splits. Additionally, the general trend of the aforementioned components aid in determining the market's development possibilities.
- Country Level Data:
Various factors that are especially aligned to the country are taken into account to determine the market size for a certain area and country, including the presence of vendors, such as headquarters and offices, the country's GDP, demand patterns, and industry growth. To comprehend the market dynamics for the nation, a number of growth variables, inhibitors, application areas, and current market trends are researched. The aforementioned elements aid in determining the country's overall market's growth potential.
- Company Profile:
The “Table of Contents” is formulated by listing and analyzing more than 25 - 30 companies operating in the market ecosystem across geographies. However, we profile only 10 companies as a standard practice in our syndicate reports. These 10 companies comprise leading, emerging, and regional players. Nonetheless, our analysis is not restricted to the 10 listed companies, we also analyze other companies present in the market to develop a holistic view and understand the prevailing trends. The “Company Profiles” section in the report covers key facts, business description, products & services, financial information, SWOT analysis, and key developments. The financial information presented is extracted from the annual reports and official documents of the publicly listed companies. Upon collecting the information for the sections of respective companies, we verify them via various primary sources and then compile the data in respective company profiles. The company level information helps us in deriving the base number as well as in forecasting the market size.
- Developing Base Number:
Aggregation of sales statistics (2020-2022) and macro-economic factor, and other secondary and primary research insights are utilized to arrive at base number and related market shares for 2022. The data gaps are identified in this step and relevant market data is analyzed, collected from paid primary interviews or databases. On finalizing the base year market size, forecasts are developed on the basis of macro-economic, industry and market growth factors and company level analysis.
- Data Triangulation and Final Review:
The market findings and base year market size calculations are validated from supply as well as demand side. Demand side validations are based on macro-economic factor analysis and benchmarks for respective regions and countries. In case of supply side validations, revenues of major companies are estimated (in case not available) based on industry benchmark, approximate number of employees, product portfolio, and primary interviews revenues are gathered. Further revenue from target product/service segment is assessed to avoid overshooting of market statistics. In case of heavy deviations between supply and demand side values, all thes steps are repeated to achieve synchronization.
We follow an iterative model, wherein we share our research findings with Subject Matter Experts (SME’s) and Key Opinion Leaders (KOLs) until consensus view of the market is not formulated – this model negates any drastic deviation in the opinions of experts. Only validated and universally acceptable research findings are quoted in our reports.
We have important check points that we use to validate our research findings – which we call – data triangulation, where we validate the information, we generate from secondary sources with primary interviews and then we re-validate with our internal data bases and Subject matter experts. This comprehensive model enables us to deliver high quality, reliable data in shortest possible time.
 احصل على عينة مجانية لهذا التقرير