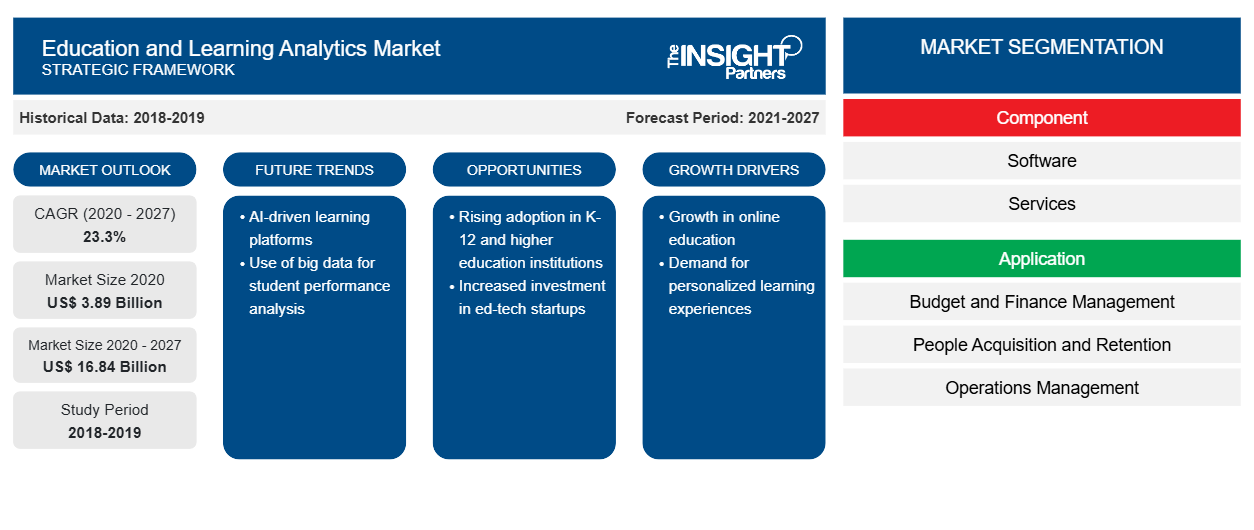
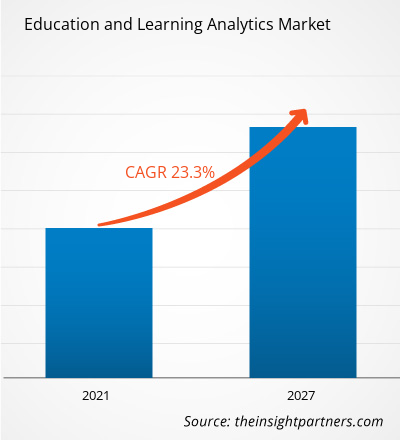
[تقرير بحثي] من المتوقع أن ينمو سوق تحليلات التعليم والتعلم من 3890.3 مليون دولار أمريكي في عام 2020 إلى 16835.9 مليون دولار أمريكي بحلول عام 2027؛ ومن المتوقع أن ينمو بمعدل نمو سنوي مركب قدره 23.3٪ من عام 2020 إلى عام 2027.
إن الطلب المتزايد على الدورات التدريبية عبر الإنترنت والشهادات المهنية يعزى إلى نمو السوق. إن الطلب المتزايد على الدورات التدريبية عبر الإنترنت والزيادة الكبيرة في عدد التسجيلات للبرامج عبر الإنترنت يخلقان فرصة هائلة للبائعين العاملين في سوق تحليلات التعليم والتعلم . إن سوق الدورات التدريبية عبر الإنترنت مجزأة للغاية بسبب وجود عدد كبير من اللاعبين العاملين في السوق عالميًا. يجب على بائعي تحليلات التعلم التركيز على الشراكات مع مقدمي الدورات التدريبية عبر الإنترنت لتوسيع بصماتهم عالميًا.
لقد أصبح التعلم عبر الإنترنت جزءًا أساسيًا من المشهد التعليمي. إن الالتحاق بالبرامج عبر الإنترنت مدفوع بشكل متزايد بعدد الطلاب المتزايد الذين يبحثون عن صيغ مرنة للشهادات والدورات وبرامج الدرجات العلمية لدعم التوظيف الوظيفي وكذلك متابعة الدراسات المتقدمة. يركز الطلاب المسجلون في البرامج داخل الحرم الجامعي أيضًا على التسجيل في الدورات الهجينة أو عبر الإنترنت بالكامل أثناء تسجيلهم. تزدهر درجات الماجستير عبر الإنترنت بين الطلاب حيث تتحول العديد من المؤسسات المرموقة والكبيرة نحو برامج الدرجات العلمية المختلفة عبر الإنترنت نظرًا للمساعدة الفنية عالية الجودة في تجربة التعلم. علاوة على ذلك، يركز المهنيون في الشركات أيضًا على متابعة دورات مختلفة لنموهم المهني. وبالتالي، من المتوقع أن يوفر الطلب المتزايد على الدورات عبر الإنترنت فرصة كبيرة لموردي تحليلات التعليم والتعلم على مستوى العالم.
قم بتخصيص هذا التقرير ليناسب متطلباتك
ستحصل على تخصيص لأي تقرير - مجانًا - بما في ذلك أجزاء من هذا التقرير، أو تحليل على مستوى الدولة، وحزمة بيانات Excel، بالإضافة إلى الاستفادة من العروض والخصومات الرائعة للشركات الناشئة والجامعات
سوق تحليلات التعليم والتعلم:
- احصل على أهم اتجاهات السوق الرئيسية لهذا التقرير.ستتضمن هذه العينة المجانية تحليلاً للبيانات، بدءًا من اتجاهات السوق وحتى التقديرات والتوقعات.
تأثير جائحة كوفيد-19 على سوق تحليلات التعليم والتعلم
في حين تتباين وجهات النظر بشأن الأضرار التي قد يسببها فيروس كورونا المستجد، تظل الحقيقة أن الفيروس ينتشر في جميع أنحاء العالم. وتتزايد الحالات الجديدة في أماكن مثل الولايات المتحدة وكندا وأوروبا وأفريقيا والشرق الأوسط والهند وأستراليا وكوريا الجنوبية واليابان، من بين العديد من البلدان الأخرى. ورغم أن التأثيرات على الشركات المتنوعة معروفة جيدًا، فإن قطاع التعليم يواجه أيضًا أكبر اضطراب في الآونة الأخيرة.
تستجيب المؤسسات التعليمية في جميع أنحاء العالم لحظر السفر وكذلك الحجر الصحي بالانتقال إلى التعلم عبر الإنترنت. قد تؤدي حالة الطوارئ إلى طفرة عبر الإنترنت للتعليم - أو قد تجعل البلدان على الأقل أكثر استعدادًا للتعامل مع حالة الطوارئ التالية
رؤى السوق - تحليلات التعليم والتعلم
تزايد استخدام التكنولوجيا المتقدمة بين المؤسسات التعليمية في البلدان النامية
تستثمر المؤسسات التعليمية بشكل كبير في التكنولوجيا المتقدمة للحصول على ميزة تنافسية وتبني أفضل نظام تعليمي ممكن. من ناحية أخرى، يرغب الطلاب أيضًا في الاستثمار من أجل الحصول على أفضل تعليم. تتمتع كل من المؤسسات التعليمية والطلاب بإمكانات عالية للاستثمار في نظام التعليم المدفوع بالتكنولوجيا، والذي له تأثير كبير على نمو السوق. تستثمر المدارس والجامعات في التكنولوجيا لتحسين عملياتها التعليمية مثل التخطيط المالي وتخطيط الدورات والاحتفاظ بالطلاب وعملية توصيل المعلومات للطلاب بشكل فعال.
لقد جرب قطاع التعليم التطورات التكنولوجية المتنوعة التي تتراوح بين البرامج الصفية والتعلم القائم على التطبيقات. وقد أصبحت بعض التكنولوجيات جزءًا دائمًا من نظام التعليم العالي. وتعمل التكنولوجيا سريعة التطور على تحويل قطاع التعليم.
تقدم التكنولوجيا المتقدمة، مثل تحليل البيانات الضخمة، فرصًا غير مسبوقة للمعلمين للوصول إلى طلابهم بطريقة جديدة. كما توفر فهمًا أعمق لتجربة الطلاب أثناء التعلم، كما تساعد أيضًا في تقييم حالة نظام التعليم. ومن بين المجالات الرئيسية التي تلعب فيها البيانات الضخمة دورًا رئيسيًا في قطاع التعليم البرامج المخصصة، وتحسين نتائج الطلاب، والحد من التسرب، وغيرها. وبالمثل، تمكن تحليلات التعلم من تحسين عملية تقديم الدورة، وإدارة الأداء، وإدارة العمليات، وإدارة التمويل، وغيرها. كل هذه المزايا المرتبطة بالتقنيات تمكن المؤسسات التعليمية من تبني حلول التكنولوجيا الذكية. ومن المتوقع أن يؤدي التبني المتزايد لحلول التكنولوجيا المتقدمة في القطاع التعليمي إلى دفع سوق تحليلات التعليم والتعلم العالمية خلال فترة التنبؤ.
رؤى قائمة على المكونات
استنادًا إلى المكون، يتم تقسيم سوق تحليلات التعليم والتعلم إلى برمجيات وخدمات. احتل قطاع البرمجيات الحصة الأكبر في السوق في عام 2019.
يركز اللاعبون العاملون في سوق تحليلات التعليم والتعلم بشكل أساسي على تطوير منتجات متقدمة وفعالة.
- في عام 2019، استثمرت مؤسسة SAS Institute Inc. في الأشخاص الذين يقفون وراء التحليلات، للمساعدة في تثقيف الجيل الجديد لتغيير ما هو ممكن، وتدريب القوى العاملة على اقتصاد متحول. تم تقديم العديد من البرامج والمبادرات الجديدة - كلها جزء من الالتزام الشامل الذي تلتزم به SAS بتعزيز تعليم التحليلات للجميع - خلال منتدى SAS® العالمي لعام 2019.
- في عام 2019، استحوذت شركة مايكروسوفت على DataSense، وهي منصة تكامل كخدمة (IPaaS) تستهدف مقدمي حلول التعليم والمناطق المدرسية في الولايات المتحدة، من شركة BrightBytes في سان فرانسيسكو. وسينضم فريق التطوير إلى قسم التعليم العالمي في مايكروسوفت كجزء من الصفقة.
تم تقسيم سوق تحليلات التعليم والتعلم على النحو التالي:
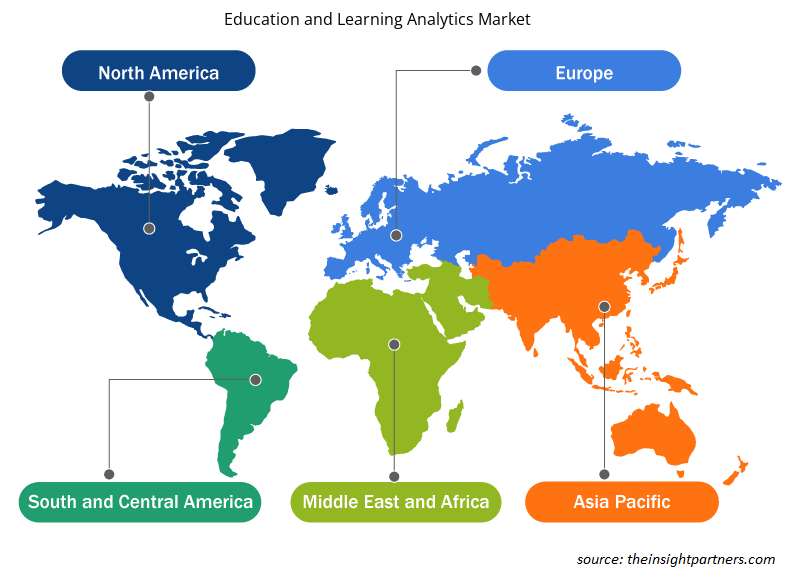
رؤى إقليمية حول سوق تحليلات التعليم والتعلم
لقد قام المحللون في Insight Partners بشرح الاتجاهات والعوامل الإقليمية المؤثرة على سوق تحليلات التعليم والتعلم طوال فترة التوقعات بشكل شامل. يناقش هذا القسم أيضًا قطاعات سوق تحليلات التعليم والتعلم والجغرافيا في جميع أنحاء أمريكا الشمالية وأوروبا ومنطقة آسيا والمحيط الهادئ والشرق الأوسط وأفريقيا وأمريكا الجنوبية والوسطى.
- احصل على البيانات الإقليمية المحددة لسوق تحليلات التعليم والتعلم
نطاق تقرير سوق تحليلات التعليم والتعلم
| سمة التقرير | تفاصيل |
|---|---|
| حجم السوق في عام 2020 | 3.89 مليار دولار أمريكي |
| حجم السوق بحلول عام 2027 | 16.84 مليار دولار أمريكي |
| معدل النمو السنوي المركب العالمي (2020 - 2027) | 23.3% |
| البيانات التاريخية | 2018-2019 |
| فترة التنبؤ | 2021-2027 |
| القطاعات المغطاة | حسب المكون
|
| المناطق والدول المغطاة | أمريكا الشمالية
|
| قادة السوق وملفات تعريف الشركات الرئيسية |
|
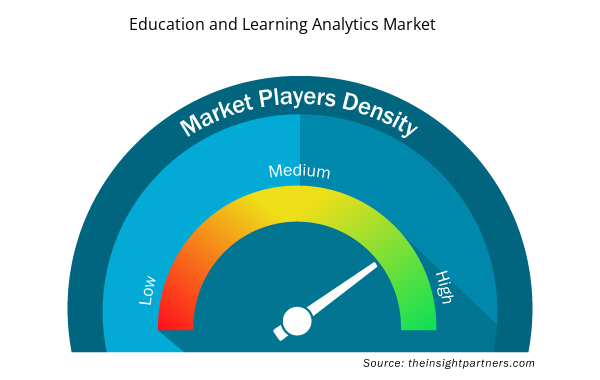
كثافة اللاعبين في سوق تحليلات التعليم والتعلم: فهم تأثيرها على ديناميكيات الأعمال
يشهد سوق تحليلات التعليم والتعلم نموًا سريعًا، مدفوعًا بالطلب المتزايد من المستخدم النهائي بسبب عوامل مثل تفضيلات المستهلكين المتطورة والتقدم التكنولوجي والوعي المتزايد بفوائد المنتج. ومع ارتفاع الطلب، تعمل الشركات على توسيع عروضها والابتكار لتلبية احتياجات المستهلكين والاستفادة من الاتجاهات الناشئة، مما يؤدي إلى زيادة نمو السوق.
تشير كثافة اللاعبين في السوق إلى توزيع الشركات أو المؤسسات العاملة في سوق أو صناعة معينة. وهي تشير إلى عدد المنافسين (اللاعبين في السوق) الموجودين في مساحة سوق معينة نسبة إلى حجمها أو قيمتها السوقية الإجمالية.
الشركات الرئيسية العاملة في سوق تحليلات التعليم والتعلم هي:
- شركة أنظمة مستجمعات المياه
- معهد SAS
- ساب اس اي
- شركة مايكروسوفت
- أسعد العقول
إخلاء المسؤولية : الشركات المذكورة أعلاه ليست مرتبة بأي ترتيب معين.
- احصل على نظرة عامة على أهم اللاعبين الرئيسيين في سوق تحليلات التعليم والتعلم
سوق تحليلات التعليم والتعلم – حسب المكون
- برمجة
- خدمات
سوق تحليلات التعليم والتعلم – حسب التطبيق
- إدارة الأداء
- إدارة العمليات
- إدارة الميزانية والمالية
- اكتساب الأشخاص والاحتفاظ بهم
- تطوير المناهج وإدارة التدخل
سوق تحليلات التعليم والتعلم – حسب المستخدم النهائي
- الأكاديميون
- شركة كبرى
سوق تحليلات التعليم والتعلم – حسب المنطقة الجغرافية
أمريكا الشمالية
- نحن
- كندا
- المكسيك
أوروبا
- فرنسا
- ألمانيا
- إيطاليا
- روسيا
- المملكة المتحدة
- بقية أوروبا
آسيا والمحيط الهادئ (APAC)
- اليابان
- الصين
- أستراليا
- الهند
- كوريا الجنوبية
- بقية منطقة آسيا والمحيط الهادئ
الشرق الأوسط وأفريقيا
- المملكة العربية السعودية
- الامارات العربية المتحدة
- جنوب أفريقيا
- باقي منطقة الشرق الأوسط وأفريقيا
أمريكا الجنوبية (SAM)
- البرازيل
- الأرجنتين
- بقية سام
سوق تحليلات التعليم والتعلم – نبذة عن الشركة
- شركة أنظمة مستجمعات المياه
- معهد SAS
- ساب اس اي
- شركة مايكروسوفت
- أسعد العقول
- شركة إيلوسيان
- شركة بلاك بورد
- شركة ألتريكس
- شركة اينيت سوفت للتكنولوجيا
- شركة سابا للبرمجيات
- التحليل التاريخي (سنتان)، السنة الأساسية، التوقعات (7 سنوات) مع معدل النمو السنوي المركب
- تحليل PEST و SWOT
- حجم السوق والقيمة / الحجم - عالميًا وإقليميًا وقطريًا
- الصناعة والمنافسة
- مجموعة بيانات Excel


Report Coverage
Revenue forecast, Company Analysis, Industry landscape, Growth factors, and Trends

Segment Covered
This text is related
to segments covered.

Regional Scope
North America, Europe, Asia Pacific, Middle East & Africa, South & Central America

Country Scope
This text is related
to country scope.
الأسئلة الشائعة
The education and learning analytics market was dominated by North America due to developed economies such as the US, Canada, and Mexico. The US and Canada are among the most advanced countries in the region, in terms of technology adoption in almost every sector, including education and training. Moreover, the presence of major education and learning analytics players, along with the widespread awareness regarding these solutions, is anticipated to further propel the market growth during the forecast period.
Increasing demand for quality assurance and quality improvement in education system is driving the demand for learning analytics. Many educational institutes are focusing on quality assurance and quality improvement in the education system to fulfill the demand from end-users. Teaching staffs are using various data to improve teaching practices. Most of the colleges and universities are using learning analytics tool as a diagnostic tool on an individual and systematic level. At the individual level, the learning analytics are used for identifying issues, and at a systematic level, it is used for the design of modules and degree programs.
Software segment by component in the education and learning analytics market led the market in 2019. Along with increasing digitalization, businesses of all sizes are focusing on adopting automated solutions to ease their business process. The advancements in applications of Information, Communication, and Technology (ICT) are paving the way for effective businesses. Education and learning analytics software helps to improve the quality of education is increasing with the growing volume of student’s data generated from different systems, such as Virtual Learning Environment (VLE), Learning Management System (LMS), student information system, or a variety of library systems. The software segment exceeds the services segment and is expected to witness the maturation in the future due to the higher adoption of education and learning analytics software solutions.
The List of Companies - Global Education and Learning Analytics Market
- Watershed Systems, Inc.
- SAS Institute Inc.
- SAP SE
- Microsoft Corporation
- Happiest Minds
- Ellucian Company L.P.
- Blackboard Inc.
- Alteryx Inc.
- InetSoft Technology Corp.
- Saba Software, Inc.
The Insight Partners performs research in 4 major stages: Data Collection & Secondary Research, Primary Research, Data Analysis and Data Triangulation & Final Review.
- Data Collection and Secondary Research:
As a market research and consulting firm operating from a decade, we have published and advised several client across the globe. First step for any study will start with an assessment of currently available data and insights from existing reports. Further, historical and current market information is collected from Investor Presentations, Annual Reports, SEC Filings, etc., and other information related to company’s performance and market positioning are gathered from Paid Databases (Factiva, Hoovers, and Reuters) and various other publications available in public domain.
Several associations trade associates, technical forums, institutes, societies and organization are accessed to gain technical as well as market related insights through their publications such as research papers, blogs and press releases related to the studies are referred to get cues about the market. Further, white papers, journals, magazines, and other news articles published in last 3 years are scrutinized and analyzed to understand the current market trends.
- Primary Research:
The primarily interview analysis comprise of data obtained from industry participants interview and answers to survey questions gathered by in-house primary team.
For primary research, interviews are conducted with industry experts/CEOs/Marketing Managers/VPs/Subject Matter Experts from both demand and supply side to get a 360-degree view of the market. The primary team conducts several interviews based on the complexity of the markets to understand the various market trends and dynamics which makes research more credible and precise.
A typical research interview fulfils the following functions:
- Provides first-hand information on the market size, market trends, growth trends, competitive landscape, and outlook
- Validates and strengthens in-house secondary research findings
- Develops the analysis team’s expertise and market understanding
Primary research involves email interactions and telephone interviews for each market, category, segment, and sub-segment across geographies. The participants who typically take part in such a process include, but are not limited to:
- Industry participants: VPs, business development managers, market intelligence managers and national sales managers
- Outside experts: Valuation experts, research analysts and key opinion leaders specializing in the electronics and semiconductor industry.
Below is the breakup of our primary respondents by company, designation, and region:

Once we receive the confirmation from primary research sources or primary respondents, we finalize the base year market estimation and forecast the data as per the macroeconomic and microeconomic factors assessed during data collection.
- Data Analysis:
Once data is validated through both secondary as well as primary respondents, we finalize the market estimations by hypothesis formulation and factor analysis at regional and country level.
- Macro-Economic Factor Analysis:
We analyse macroeconomic indicators such the gross domestic product (GDP), increase in the demand for goods and services across industries, technological advancement, regional economic growth, governmental policies, the influence of COVID-19, PEST analysis, and other aspects. This analysis aids in setting benchmarks for various nations/regions and approximating market splits. Additionally, the general trend of the aforementioned components aid in determining the market's development possibilities.
- Country Level Data:
Various factors that are especially aligned to the country are taken into account to determine the market size for a certain area and country, including the presence of vendors, such as headquarters and offices, the country's GDP, demand patterns, and industry growth. To comprehend the market dynamics for the nation, a number of growth variables, inhibitors, application areas, and current market trends are researched. The aforementioned elements aid in determining the country's overall market's growth potential.
- Company Profile:
The “Table of Contents” is formulated by listing and analyzing more than 25 - 30 companies operating in the market ecosystem across geographies. However, we profile only 10 companies as a standard practice in our syndicate reports. These 10 companies comprise leading, emerging, and regional players. Nonetheless, our analysis is not restricted to the 10 listed companies, we also analyze other companies present in the market to develop a holistic view and understand the prevailing trends. The “Company Profiles” section in the report covers key facts, business description, products & services, financial information, SWOT analysis, and key developments. The financial information presented is extracted from the annual reports and official documents of the publicly listed companies. Upon collecting the information for the sections of respective companies, we verify them via various primary sources and then compile the data in respective company profiles. The company level information helps us in deriving the base number as well as in forecasting the market size.
- Developing Base Number:
Aggregation of sales statistics (2020-2022) and macro-economic factor, and other secondary and primary research insights are utilized to arrive at base number and related market shares for 2022. The data gaps are identified in this step and relevant market data is analyzed, collected from paid primary interviews or databases. On finalizing the base year market size, forecasts are developed on the basis of macro-economic, industry and market growth factors and company level analysis.
- Data Triangulation and Final Review:
The market findings and base year market size calculations are validated from supply as well as demand side. Demand side validations are based on macro-economic factor analysis and benchmarks for respective regions and countries. In case of supply side validations, revenues of major companies are estimated (in case not available) based on industry benchmark, approximate number of employees, product portfolio, and primary interviews revenues are gathered. Further revenue from target product/service segment is assessed to avoid overshooting of market statistics. In case of heavy deviations between supply and demand side values, all thes steps are repeated to achieve synchronization.
We follow an iterative model, wherein we share our research findings with Subject Matter Experts (SME’s) and Key Opinion Leaders (KOLs) until consensus view of the market is not formulated – this model negates any drastic deviation in the opinions of experts. Only validated and universally acceptable research findings are quoted in our reports.
We have important check points that we use to validate our research findings – which we call – data triangulation, where we validate the information, we generate from secondary sources with primary interviews and then we re-validate with our internal data bases and Subject matter experts. This comprehensive model enables us to deliver high quality, reliable data in shortest possible time.
 احصل على عينة مجانية لهذا التقرير