تحليل سوق برمجيات وضع العلامات على المؤسسات والتنبؤ بها حسب الحجم والمشاركة والنمو والاتجاهات 2027
البيانات التاريخية : 2016-2017 | سنة الأساس : 2018 | فترة التنبؤ : 2019-2027سوق برامج وضع العلامات التجارية للمؤسسات حتى عام 2027 - تحليلات وتوقعات عالمية حسب نموذج النشر (السحابي والمحلي)؛ حجم المؤسسة (الشركات الصغيرة والمتوسطة، الشركات الكبيرة)؛ المستخدم النهائي (السلع الاستهلاكية سريعة التداول، التجزئة، الرعاية الصحية، التخزين والخدمات اللوجستية، وغيرها)
- تاريخ التقرير : Dec 2019
- رمز التقرير : TIPRE00007375
- الفئة : التكنولوجيا والإعلام والاتصالات
- الحالة : نُشرت
- تنسيقات التقارير المتاحة :


- عدد الصفحات : 149
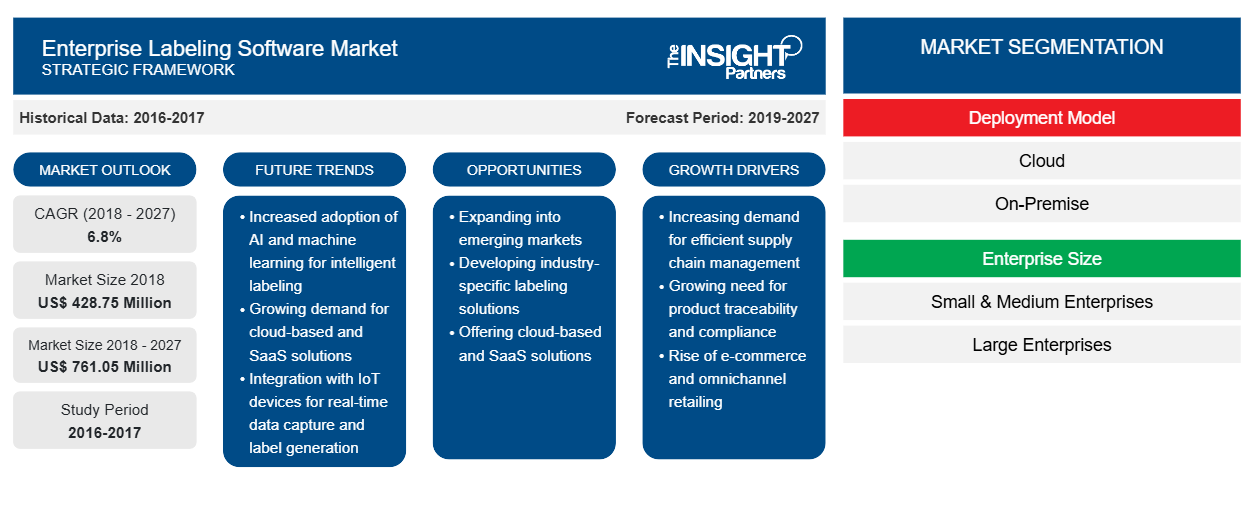
بلغت قيمة سوق برامج وضع العلامات التجارية 428.75 مليون دولار أمريكي في عام 2018 ومن المتوقع أن تصل إلى 761.05 مليون دولار أمريكي بحلول عام 2027 بمعدل نمو سنوي مركب قدره 6.8٪ خلال الفترة المتوقعة.
أدى التوسع في مختلف الصناعات ذات الاستخدام النهائي في جميع أنحاء العالم، وخاصة في منطقة آسيا والمحيط الهادئ والشرق الأوسط وأفريقيا، إلى جانب تطور إدارة البيانات والتخطيط في السنوات القليلة الماضية، إلى إدخال عملية وضع العلامات كعملية بالغة الأهمية بالنسبة للعديد من الشركات الصغيرة والمتوسطة الحجم. هناك حاجة متزايدة لوضع العلامات على مستوى المؤسسات في مختلف الصناعات ذات الاستخدام النهائي لتبسيط العمليات التجارية المتعددة. يساعد برنامج وضع العلامات على مستوى المؤسسات في الحفاظ على الدقة أثناء عملية الطباعة ويضمن امتثال الشركات للوائح الكشف عن معلومات المنتج. بالإضافة إلى ذلك، يوفر دمج هذا البرنامج فوائد مختلفة، بما في ذلك التعاون في البيانات على مستوى المؤسسة، وكفاءة سلسلة التوريد، ومرونة طباعة الملصقات وتناسقها. لذلك، من المتوقع أن يؤدي التبني المتزايد لوضع العلامات على مستوى المؤسسات إلى دفع نمو سوق برامج وضع العلامات على مستوى المؤسسات
يعمل برنامج وضع العلامات التجارية على تحسين السرعة والدقة والكفاءة وتوفير التكاليف ووقت التسليم، مع تمكين الشركات من معالجة تحديات وضع العلامات المعقدة. تساعد جودة وضع العلامات المحسنة في تحسين القدرة التنافسية للشركة في السوق العالمية.
قم بتخصيص هذا التقرير ليناسب متطلباتك
ستحصل على تخصيص لأي تقرير - مجانًا - بما في ذلك أجزاء من هذا التقرير، أو تحليل على مستوى الدولة، وحزمة بيانات Excel، بالإضافة إلى الاستفادة من العروض والخصومات الرائعة للشركات الناشئة والجامعات
سوق برامج وضع العلامات التجارية للمؤسسات: رؤى استراتيجية
- احصل على أهم اتجاهات السوق الرئيسية لهذا التقرير.ستتضمن هذه العينة المجانية تحليلاً للبيانات، بدءًا من اتجاهات السوق وحتى التقديرات والتوقعات.
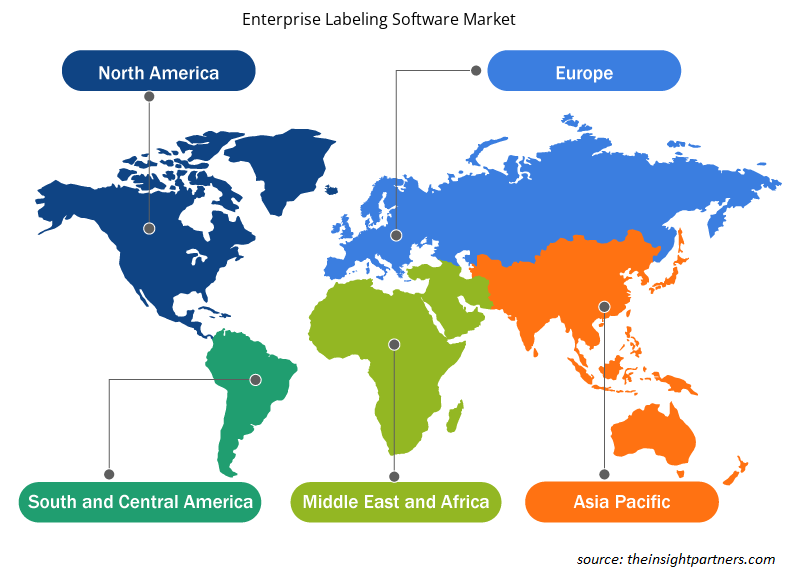
رؤى إقليمية حول سوق برامج وضع العلامات التجارية للمؤسسات
لقد قام المحللون في Insight Partners بشرح الاتجاهات والعوامل الإقليمية المؤثرة على سوق برامج وضع العلامات التجارية خلال فترة التوقعات بشكل شامل. يناقش هذا القسم أيضًا قطاعات سوق برامج وضع العلامات التجارية والجغرافيا في جميع أنحاء أمريكا الشمالية وأوروبا ومنطقة آسيا والمحيط الهادئ والشرق الأوسط وأفريقيا وأمريكا الجنوبية والوسطى.
- احصل على البيانات الإقليمية المحددة لسوق برامج وضع العلامات التجارية للمؤسسات
نطاق تقرير سوق برامج وضع العلامات التجارية
| سمة التقرير | تفاصيل |
|---|---|
| حجم السوق في عام 2018 | 428.75 مليون دولار أمريكي |
| حجم السوق بحلول عام 2027 | 761.05 مليون دولار أمريكي |
| معدل النمو السنوي المركب العالمي (2018 - 2027) | 6.8% |
| البيانات التاريخية | 2016-2017 |
| فترة التنبؤ | 2019-2027 |
| القطاعات المغطاة | حسب نموذج النشر
|
| المناطق والدول المغطاة | أمريكا الشمالية
|
| قادة السوق وملفات تعريف الشركات الرئيسية |
|
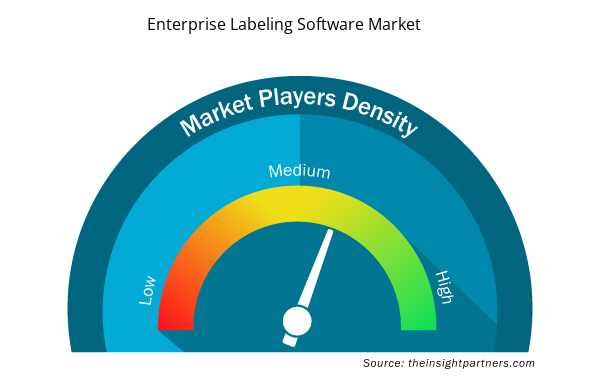
كثافة اللاعبين في سوق برامج وضع العلامات التجارية للمؤسسات: فهم تأثيرها على ديناميكيات الأعمال
يشهد سوق برامج وضع العلامات التجارية نموًا سريعًا، مدفوعًا بالطلب المتزايد من المستخدم النهائي بسبب عوامل مثل تفضيلات المستهلك المتطورة والتقدم التكنولوجي والوعي المتزايد بفوائد المنتج. ومع ارتفاع الطلب، تعمل الشركات على توسيع عروضها والابتكار لتلبية احتياجات المستهلكين والاستفادة من الاتجاهات الناشئة، مما يؤدي إلى زيادة نمو السوق.
تشير كثافة اللاعبين في السوق إلى توزيع الشركات أو المؤسسات العاملة في سوق أو صناعة معينة. وهي تشير إلى عدد المنافسين (اللاعبين في السوق) الموجودين في مساحة سوق معينة نسبة إلى حجمها أو قيمتها السوقية الإجمالية.
الشركات الرئيسية العاملة في سوق برمجيات وضع العلامات التجارية هي:
- بلو للبرمجيات، ذ.م.م
- شركة سيبرا
- شركة داتا سيستمز الدولية المحدودة (DSI)
- إنديسيا،
- شركة يورو بلس المحدودة
إخلاء المسؤولية : الشركات المذكورة أعلاه ليست مرتبة بأي ترتيب معين.
- احصل على نظرة عامة على أهم اللاعبين الرئيسيين في سوق برامج وضع العلامات التجارية للمؤسسات
يركز اللاعبون العاملون في سوق إدارة محتوى المؤسسات على استراتيجيات مثل عمليات الدمج والاستحواذ ومبادرات السوق للحفاظ على مواقعهم في السوق. فيما يلي قائمة ببعض التطورات التي قام بها اللاعبون الرئيسيون:
- في نوفمبر 2019، أطلقت NiceLabel الإصدار 2 من حزمة ABAP الخاصة بها، والتي تدعم كلًا من SAP ECC وSAP S/4HANA. يتيح هذا للمؤسسات رقمنة عملية ضمان جودة الملصقات بالكامل والحد من أخطاء الملصقات وتأخيرات الشحن.
- في أبريل 2018، أعلنت شركة Innovatum، Inc. عن حصولها على شهادة ISO 9001:2015 لنظام إدارة الجودة الخاص بتطوير البرامج وتسليمها ودعمها كمزود لبرامج العلوم الحياتية، من قبل هيئة معتمدة من ANAB.
أقسام سوق برامج وضع العلامات التجارية العالمية:
سوق برامج وضع العلامات التجارية للمؤسسات – حسب نموذج النشر
- في الموقع
- سحاب
سوق برامج وضع العلامات التجارية للمؤسسات – حسب حجم المؤسسة
- الشركات الصغيرة والمتوسطة
- الشركات الكبيرة
سوق برامج وضع العلامات التجارية للمؤسسات – حسب المستخدم النهائي
- السلع الاستهلاكية سريعة التداول
- بيع بالتجزئة
- الرعاية الصحية
- التخزين والخدمات اللوجستية
- آحرون
سوق برامج وضع العلامات التجارية للمؤسسات – حسب المنطقة الجغرافية
أمريكا الشمالية
- نحن
- كندا
- المكسيك
أوروبا
- فرنسا
- ألمانيا
- إيطاليا
- إسبانيا
- المملكة المتحدة
- بقية أوروبا
آسيا والمحيط الهادئ (APAC)
- أستراليا
- الصين
- الهند
- اليابان
- بقية منطقة آسيا والمحيط الهادئ
الشرق الأوسط وأفريقيا
- المملكة العربية السعودية
- الامارات العربية المتحدة
- جنوب أفريقيا
- باقي منطقة الشرق الأوسط وأفريقيا
أمريكا الجنوبية (SAM)
- البرازيل
- بقية سام
شركات
- شركة بلو للبرمجيات المحدودة (إيسكو)
- شركة سيبرا
- شركة داتا سيستمز الدولية المحدودة (DSI)
- إنديسيا
- يورو بلس المحدودة
- شركة إينوفاتوم
- شركة لوفتوير
- شركة بريسيم أي دي المحدودة
- شركة سيجال العلمية
- تيكلينكس نيوكو ساس

أنكيتا خبيرة ديناميكية في أبحاث السوق والاستشارات، تتمتع بخبرة تزيد عن 8 سنوات في قطاعات التكنولوجيا والإعلام وتكنولوجيا المعلومات والاتصالات والإلكترونيات وأشباه الموصلات. وقد قادت ونفذت بنجاح أكثر من 100 مهمة استشارية وبحثية لعملاء عالميين مثل مايكروسوفت وأوراكل وشركة NEC وSAP وKPMG وExpeditors International. تشمل كفاءاتها الأساسية تقييم السوق، وتحليل البيانات، والتنبؤ، وصياغة الاستراتيجيات، والاستخبارات التنافسية، وكتابة التقارير.
أنكيتا بارعة في إدارة دورات المشاريع الكاملة، بدءًا من تصميم عروض ما قبل البيع ومناقشات العملاء، وصولًا إلى تقديم رؤى عملية بعد البيع. كما أنها ماهرة في إدارة فرق متعددة الوظائف، وهيكلة وحدات بحثية معقدة، ومواءمة الحلول مع أهداف العمل الخاصة بالعملاء. وقد مكنتها مهاراتها الممتازة في التواصل والقيادة والعرض التقديمي من تحقيق نتائج قيّمة باستمرار في بيئات سوقية سريعة التطور.
- التحليل التاريخي (سنتان)، سنة الأساس، التوقعات (7 سنوات) مع معدل النمو السنوي المركب
- تحليل PEST و SWOT
- حجم السوق والقيمة / الحجم - عالمي، إقليمي، بلد
- الصناعة والمنافسة
- مجموعة بيانات إكسل
التقارير الحديثة
تقارير ذات صلة
شهادات العملاء
تقرير سوق أنظمة SCADA من Insight Partners شامل، ويقدم رؤى قيّمة حول الاتجاهات الحالية والتوقعات المستقبلية. تميّز الفريق باحترافية عالية وسرعة في الاستجابة ودعم مستمر طوال الوقت. نحن راضون جدًا ونوصي بشدة بخدماتهم.
ران كيديم شريك, شركة ريالي تكنولوجيز المحدودةطلبتُ تقريرًا عن سوق برمجيات محدد، وأعدّه الفريق في غضون أيام قليلة. كانت المعلومات ذات صلة وثيقة وعرضها جيد. ثم طلبتُ بعض التعديلات والإضافات على التقرير. وكان الفريق متجاوبًا للغاية، وحصلتُ على التقرير النهائي في أقل من أسبوع.
جان هيرفيه جين رئيس مجلس الإدارة, فيوتشر أناليتيكاعملنا مع شركة "إنسايت بارتنرز" لإجراء دراسة سوقية وتوقعات مهمة. زودونا برؤى واضحة حول الفرص والمخاطر، مما ساعدنا في صياغة خططنا. كانت أبحاثهم سهلة الاستخدام ومبنية على بيانات دقيقة، مما ساعدنا على اتخاذ قرارات ذكية وواثقة. نوصي بهم بشدة.
بيوش ناجبال نائب الرئيس الأول, شعاع عالي عالميقدّمت شركة Insight Partners أبحاثًا سوقية ثاقبة ومنظمة جيدًا بخبرة واسعة في هذا المجال. تميّز فريقهم بالاحترافية وسرعة الاستجابة طوال الوقت. وسهّل موقعهم الإلكتروني سهل الاستخدام الوصول إلى تقارير القطاع. نوصي بهم بشدة لخدمات بحثية موثوقة وعالية الجودة.
يوكيهيكو أداتشي المدير التنفيذي, ديب بلو، ذ.م.م.هذه أول مرة أشتري فيها تقرير سوق من The Insight Partners. رغم أنني كنت مترددًا في البداية، إلا أنني زرت موقعهم الإلكتروني وشعرت براحة أكبر للمخاطرة وشراء تقرير السوق. أنا راضٍ تمامًا عن جودة التقرير وخدمة العملاء. كانت لديّ عدة أسئلة وتعليقات حول التقرير الأولي، ولكن بعد بضع محادثات عبر البريد الإلكتروني مع محللهم، أعتقد أن لديّ تقريرًا يمكنني استخدامه كمدخل لعملية التخطيط الاستراتيجي لدينا. شكرًا جزيلاً لكم على تخصيص وقتكم الإضافي وجعل هذه التجربة إيجابية. سأوصي بخدماتكم للآخرين بالتأكيد، وستكونون أول من ألجأ إليه عندما نحتاج إلى المزيد من بيانات السوق.
جون سوزوكي الرئيس والرئيس التنفيذي وعضو مجلس الإدارة, بي كيه تكنولوجيزأود أن أقدّر دعمكم واحترافيتكم في الاستجابة لطلبي للحصول على معلومات بشأن سوق التشخيص المخبري للأمراض المعدية في نيجيريا. كما أُقدّر صبركم وتوجيهكم، واستعدادكم لتقديم خصم، مما مكّننا في النهاية من إتمام الصفقة. أتطلع إلى التعامل مع "ذا إنسايت بارتنرز" مستقبلًا، كل ذلك بفضل الانطباع الذي تركتموه لديّ نتيجةً لهذا اللقاء الأول.
الدكتور تشيجيوك أونيا المدير الإداري, شركة باينكريست للرعاية الصحية المحدودةسبب الشراء
- اتخاذ قرارات مدروسة
- فهم ديناميكيات السوق
- تحليل المنافسة
- رؤى العملاء
- توقعات السوق
- تخفيف المخاطر
- التخطيط الاستراتيجي
- مبررات الاستثمار
- تحديد الأسواق الناشئة
- تحسين استراتيجيات التسويق
- تعزيز الكفاءة التشغيلية
- مواكبة التوجهات التنظيمية


 احصل على عينة مجانية ل - سوق برامج وضع العلامات التجارية للمؤسسات