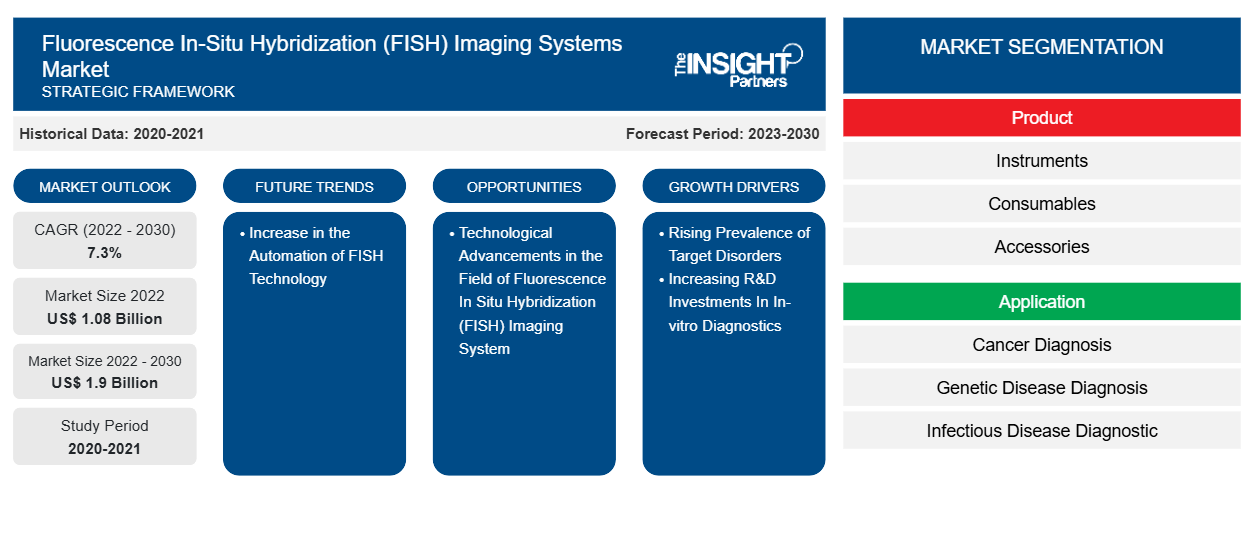
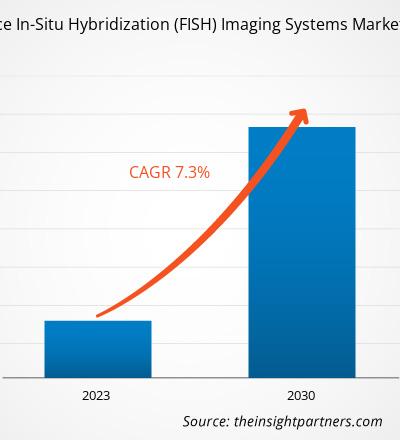
[تقرير بحثي] من المتوقع أن ينمو سوق أنظمة التصوير بالتهجين الموضعي الفلوري (FISH) من 1،084.0 مليون دولار أمريكي في عام 2022 ومن المتوقع أن يصل إلى قيمة 1،901.4 مليون دولار أمريكي بحلول عام 2030؛ ومن المتوقع أن يسجل معدل نمو سنوي مركب بنسبة 7.3٪ من عام 2022 إلى عام 2030.
رؤى السوق ووجهة نظر المحلل:
التهجين الموضعي الفلوري (FISH) هو تقنية جزيئية للتحليل الخلوي الوراثي. تستخدم هذه التقنية مجسات فلورية ترتبط فقط بأجزاء معينة من تسلسل الحمض النووي بدرجة عالية من التكامل التسلسلي. يكتشف FISH وجود أو غياب تسلسلات DNA محددة على الكروموسومات. غالبًا ما يستخدم FISH للعثور على سمات محددة في أهداف DNA / RNA للطب والاستشارة الوراثية وتحديد الأنواع. تشمل العوامل الرئيسية التي تدفع نمو سوق أنظمة التصوير بالتهجين الموضعي الفلوري (FISH) الانتشار المتزايد لاضطرابات الهدف وزيادة استثمارات البحث والتطوير في التشخيص المختبري. ومع ذلك، فإن التكلفة العالية لأنظمة التصوير وإجراءات FISH تعيق نمو السوق.
محركات النمو ومعوقاته:
FISH هي تقنية جزيئية قوية تسمح بتصور وتحديد موقع تسلسلات DNA محددة داخل الخلايا أو الأنسجة. أحدثت هذه التقنية ثورة في مجال علم الوراثة والتشخيص، حيث زودت الباحثين والأطباء برؤى قيمة حول التشوهات الجينية وإعادة ترتيب الكروموسومات والأمراض المختلفة. إن الانتشار المتزايد للاضطرابات المستهدفة مثل المتلازمات الوراثية والسرطان وغيرها من التشوهات الجينية يدفع الطلب على أنظمة التصوير FISH. وفقًا للمكتبة الوطنية للطب، من المتوقع أن تسجل الولايات المتحدة 1.96 حالة سرطان جديدة و609820 حالة وفاة بالسرطان في عام 2023. يزداد الطلب على أدوات التشخيص الدقيقة والموثوقة مع الارتفاع المستمر في انتشار هذه الاضطرابات المستهدفة. توفر أنظمة التصوير FISH صورًا عالية الدقة للمساعدة في اكتشاف التغيرات الجينية الدقيقة، مما يتيح التشخيص المبكر للمرض وأساليب العلاج الشخصية. غالبًا ما تنطوي هذه الاضطرابات على طفرات أو اختلافات جينية يمكن تحديدها ووصفها بدقة باستخدام أنظمة التصوير FISH. لقد أثبتت القدرة على رسم خريطة دقيقة لموقع الجينات المحددة أو تسلسلات الحمض النووي داخل الخلايا أنها ضرورية لفهم آليات المرض وتطوير علاجات مستهدفة واتخاذ قرارات سريرية مستنيرة.
تتمثل إحدى المزايا البارزة لتقنية FISH في قدرتها على العمل مع أنواع مختلفة من العينات، بما في ذلك الأنسجة المضمنة بالبارافين والمثبتة بالفورمالين، والمستحضرات الخلوية، والأنسجة الطازجة. وقد جعلت هذه المرونة من تقنية FISH أداة أساسية في كل من البيئات البحثية والسريرية، مما يسمح بتحديد العلامات الجينية المرتبطة بأمراض مثل سرطان الدم، والليمفوما، والأورام الصلبة، والاضطرابات الخلقية.
قم بتخصيص هذا التقرير ليناسب متطلباتك
ستحصل على تخصيص لأي تقرير - مجانًا - بما في ذلك أجزاء من هذا التقرير، أو تحليل على مستوى الدولة، وحزمة بيانات Excel، بالإضافة إلى الاستفادة من العروض والخصومات الرائعة للشركات الناشئة والجامعات
سوق أنظمة التصوير بالتهجين الفلوري الموضعي (FISH):
- احصل على أهم اتجاهات السوق الرئيسية لهذا التقرير.ستتضمن هذه العينة المجانية تحليلاً للبيانات، بدءًا من اتجاهات السوق وحتى التقديرات والتوقعات.
إن سوق أنظمة التصوير بالتهجين الموضعي الفلوري (FISH) مدفوع أيضًا بالاستثمارات المستمرة في أنشطة البحث والتطوير المتعلقة بالتشخيص المخبري (IVD). بفضل قدرتها الفريدة على تصور تسلسلات الحمض النووي المحددة داخل البيئات الخلوية، ظهرت تقنية FISH كإجراء رئيسي في التشخيص الحديث، وخاصة في الكشف عن الاضطرابات الوراثية والأمراض النادرة. وقد أدى الارتفاع المفاجئ في تمويل البحث والتطوير في IVD إلى تحفيز التقدم التحويلي في أنظمة التصوير FISH من خلال السماح للباحثين بإنشاء منصات متطورة توفر جودة صورة محسنة مع ميزات تدعم الأتمتة المبسطة، مما أدى إلى عمليات تشخيص أكثر دقة وسرعة. PNA FISH هي طريقة تشخيصية جديدة تستخدم FISH مع مجسات حمض الببتيد النووي (PNA)، تجمع بين سهولة إجراءات التلوين التقليدية والأداء الاستثنائي لمجسات PNA لتوفير تشخيص سريع ودقيق للأمراض المعدية، مما يجعل PNA FISH مناسبًا للتطبيق الروتيني وتمكن مختبرات علم الأحياء الدقيقة السريرية من الإبلاغ عن معلومات مهمة لعلاج المريض في إطار زمني غير ممكن باستخدام الطرق الكيميائية الحيوية الكلاسيكية.
ومع ذلك، فإن تحليل التصوير باستخدام تقنية FISH هو طريقة أقل استخدامًا في الكشف عن السرطان نظرًا لتكلفته الأعلى نسبيًا مقارنة بالطرق الأخرى. بالإضافة إلى تكلفة المعدات، فإن النفقات المرتبطة بالكواشف والمواد الاستهلاكية الأخرى وتعيينات الموظفين المتخصصين يمكن أن تزيد من التكلفة الإجمالية للتقييم بناءً على التصوير باستخدام تقنية FISH. على سبيل المثال، يكلف الكشف عن سرطان الرئة ذو الخلايا غير الصغيرة لجين ALK بواسطة تقنية IHC 90.07 دولارًا أمريكيًا في الولايات المتحدة و68.69 دولارًا أمريكيًا في أوروبا لكل اختبار، وهو أقل من الاختبارات المستقلة أو الموازية بواسطة تقنية FISH وIHC (تكلف حوالي 441.85 دولارًا أمريكيًا في الولايات المتحدة و279.46 دولارًا أمريكيًا في أوروبا لكل اختبار). وبالتالي، فإن التكلفة العالية للإجراءات والأنظمة تحد من نمو سوق أنظمة التصوير باستخدام تقنية التهجين الموضعي الفلوري (FISH).
تقسيم التقرير ونطاقه:
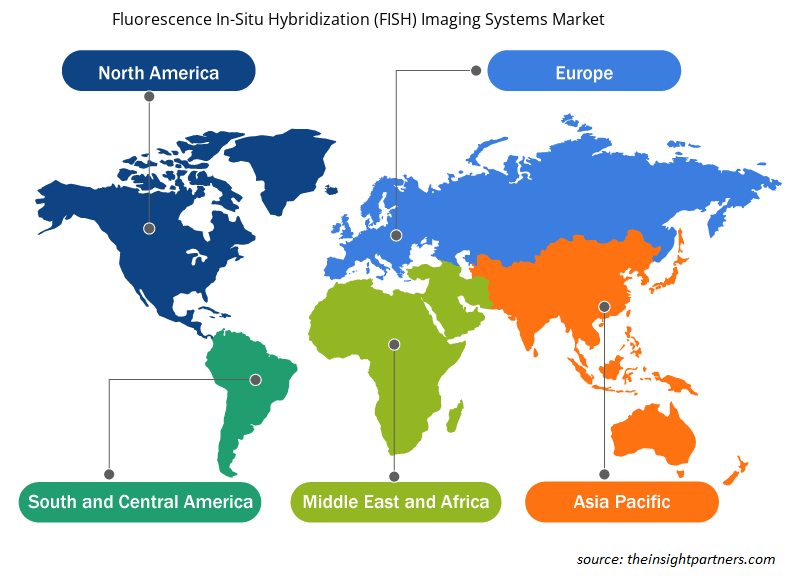
يتم تقسيم "سوق أنظمة التصوير بالتهجين الموضعي الفلوري العالمي (FISH)" على أساس المنتج والتطبيق والمستخدم النهائي. بناءً على المنتج، يتم تقسيم السوق إلى أدوات ومواد استهلاكية وملحقات وبرامج. من حيث التطبيق، يتم تقسيم سوق أنظمة التصوير بالتهجين الموضعي الفلوري (FISH) إلى تشخيص السرطان وتشخيص الأمراض الوراثية وتشخيص الأمراض المعدية وغيرها. بناءً على المستخدم النهائي، يتم تقسيم السوق إلى مختبرات التشخيص ومنظمات الأبحاث التعاقدية والشركات الصيدلانية والتكنولوجية الحيوية وغيرها. يتم تقسيم سوق أنظمة التصوير بالتهجين الموضعي الفلوري (FISH)، على أساس الجغرافيا، إلى أمريكا الشمالية (الولايات المتحدة وكندا والمكسيك)، وأوروبا (ألمانيا وفرنسا وإيطاليا والمملكة المتحدة وروسيا وبقية أوروبا)، وآسيا والمحيط الهادئ (أستراليا والصين واليابان والهند وكوريا الجنوبية وبقية آسيا والمحيط الهادئ)، والشرق الأوسط وأفريقيا (جنوب أفريقيا والمملكة العربية السعودية والإمارات العربية المتحدة وبقية الشرق الأوسط وأفريقيا)، وأمريكا الجنوبية والوسطى (البرازيل والأرجنتين وبقية أمريكا الجنوبية والوسطى).
التحليل القطاعي:
يتم تقسيم سوق أنظمة التصوير بالتهجين الموضعي الفلوري (FISH)، حسب المنتج، إلى أدوات ومواد استهلاكية وملحقات وبرامج. احتل قطاع المواد الاستهلاكية أكبر حصة سوقية في عام 2022 ومن المتوقع أن يسجل أعلى معدل نمو سنوي مركب خلال الفترة 2022-2030. المواد الاستهلاكية هي القطاع الأكثر وعدًا في سوق نظام التصوير بالتهجين الموضعي الفلوري (FISH) والذي سيساهم في نمو هائل في السنوات القادمة. تشمل المواد الاستهلاكية FISH مخازن التهجين والمجسات ومجموعات الكشف عن العلامات ومجموعات الكشف عن تضخيم الإشارة وغيرها. إن وجود شركات مصنعة مثل Abbott و F. Abnova و Thermo Fisher Scientific يعزز سوق قطاع المواد الاستهلاكية. تُستخدم هذه المنتجات بشكل متكرر في عمليات تشخيص الأبحاث المختلفة، ومن المتوقع أن يؤدي ذلك إلى دفع الاستهلاك. وبالتالي، من المرجح أن يؤدي وجود العديد من اللاعبين في السوق الذين يقدمون المجسات والمجموعات والتقدم التكنولوجي من قبل اللاعبين في السوق إلى دفع سوق القطاع في السنوات القادمة.
بناءً على التطبيق، يتم تقسيم سوق أنظمة التصوير بالتهجين الموضعي الفلوري (FISH) إلى تشخيص السرطان وتشخيص الأمراض الوراثية وتشخيص الأمراض المعدية وغيرها. احتل قطاع تشخيص السرطان أكبر حصة سوقية في عام 2022 ومن المتوقع أن يسجل أعلى معدل نمو سنوي مركب خلال الفترة 2022-2030. لقد استفادت تقنية FISH بشكل كبير من تشخيص السرطان. يمكن لأنظمة التصوير FISH البحث عن التغيرات الجينية والمساعدة في اكتشاف التشوهات. وفقًا لأبحاث السرطان في المملكة المتحدة، يتم استخدام اختبار FISH لتشخيص العديد من أنواع السرطان، بما في ذلك سرطان الثدي والليمفوما وسرطان الرئة وسرطان البروستاتا وسرطان الدم الليمفاوي المزمن (CLL) وسرطان الدم الليمفاوي الحاد (ALL) وسرطان الدم النقوي الحاد (AML) وسرطان الدم النقوي المزمن (CML) والورم النقوي وساركوما يوينغ وسرطان الجلد الميلانيني.
بناءً على المستخدم النهائي، يتم تقسيم سوق أنظمة التصوير بالتهجين الموضعي الفلوري (FISH) إلى مختبرات التشخيص، ومنظمة أبحاث العقود ، والشركات الصيدلانية والتكنولوجية الحيوية، وغيرها. احتل قطاع المختبرات التشخيصية أكبر حصة في السوق في عام 2022 ومن المتوقع أن يسجل أعلى معدل نمو سنوي مركب خلال الفترة 2022-2030. تشارك المختبرات التشخيصية في مشاريع بحثية مختلفة لتطوير العديد من التقنيات والمنتجات لعمليات التصوير بالتهجين الموضعي الفلوري (FISH). خلقت التطورات غير المسبوقة في البحث والتكنولوجيات إمكانية التحول في قطاعي الرعاية الصحية وعلوم الحياة. التطبيقات السريرية لأنظمة التصوير بالتهجين الموضعي الفلوري (FISH) واسعة وتوفر فرصًا لتعزيز قدرات التشخيص والعلاج للأمراض المزمنة. إنها توفر إمكانات هائلة في اكتشاف الجينات وتشخيص الاضطرابات الوراثية النادرة. تُستخدم التقنيات بشكل متزايد لتحليل العوامل الوراثية النادرة والشائعة التي تؤثر على تطور الأمراض الشائعة، مثل السرطان وارتفاع ضغط الدم والسكري وأمراض الكلى.
التحليل الإقليمي:
استنادًا إلى الجغرافيا، يتم تقسيم سوق أنظمة التصوير بالتهجين الموضعي الفلوري العالمي (FISH) إلى خمس مناطق رئيسية: أمريكا الشمالية وأوروبا وآسيا والمحيط الهادئ وأمريكا الجنوبية والوسطى والشرق الأوسط وأفريقيا. في عام 2022، استحوذت أمريكا الشمالية على أكبر حصة من حجم سوق أنظمة التصوير بالتهجين الموضعي الفلوري العالمي (FISH). ومن المتوقع أن تسجل منطقة آسيا والمحيط الهادئ أعلى معدل نمو سنوي مركب خلال الفترة 2022-2030.
من المتوقع أن تمتلك الولايات المتحدة أكبر حصة في سوق أنظمة التصوير بالتهجين الموضعي الفلوري (FISH) خلال فترة التنبؤ. تمتلك الولايات المتحدة حصة كبيرة من سوق أنظمة التصوير بالتهجين الموضعي الفلوري (FISH) في أمريكا الشمالية. الطلب المتزايد على أدوات التشخيص المتقدمة في علم الوراثة الجزيئي وعلم الوراثة الخلوية والانتشار المتزايد للاضطرابات الوراثية والسرطان يغذي اعتماد أنظمة التصوير بالتهجين الموضعي الفلوري (FISH) في الولايات المتحدة. وفقًا للبيانات التي نشرتها الجمعية الأمريكية للسرطان في عام 2022، تم تشخيص ما يقرب من 1.9 مليون حالة سرطان وتم الإبلاغ عن 609360 حالة وفاة بالسرطان في الولايات المتحدة. توفر هذه الأنظمة تصويرًا عالي الدقة للمواد الوراثية، مما يتيح للباحثين والأطباء اكتشاف التشوهات الصبغية والطفرات الجينية بدقة أكبر. علاوة على ذلك، أدى التركيز المتزايد على الطب الشخصي والعلاجات المستهدفة إلى زيادة في أنشطة البحث التي تنطوي على التحليل الجيني، مما عزز الطلب على أنظمة التصوير بالتهجين الموضعي الفلوري. لقد أثبتت قدرة هذه الأنظمة على توفير معلومات مكانية مفصلة عن تسلسلات الجينات مباشرة داخل الخلايا أنها لا تقدر بثمن في كل من التطبيقات البحثية والسريرية. اكتسبت أنظمة التصوير FISH مؤخرًا شعبية هائلة بسبب تقدمها التكنولوجي مثل الأتمتة المحسنة والإنتاجية العالية وبرامج تحليل الصور المحسنة. ونتيجة لذلك، أصبحت المختبرات والمؤسسات الطبية مجهزة بشكل أفضل للتعامل مع أحجام أكبر من العينات وتوليد نتائج دقيقة بكفاءة. وبالتالي، فإن الطلب المتزايد على أدوات التشخيص المتقدمة في علم الوراثة الجزيئي وعلم الوراثة الخلوية والانتشار المتزايد للاضطرابات الوراثية والسرطان يعزز سوق أنظمة التصوير بالتهجين الموضعي الفلوري (FISH) في الولايات المتحدة.
تطورات الصناعة والفرص المستقبلية:
يرد أدناه قائمة بالمبادرات المختلفة التي اتخذها اللاعبون الرئيسيون العاملون في سوق أنظمة التصوير بالتهجين الموضعي الفلوري العالمي (FISH):
- في مايو 2023، تعاونت شركة فايزر وشركة ثيرمو فيشر ساينتيفيك للمساعدة في زيادة الوصول المحلي إلى الاختبارات القائمة على تسلسل الجيل التالي (NGS) لمرضى سرطان الرئة والثدي في أكثر من 30 دولة في أمريكا اللاتينية وأفريقيا والشرق الأوسط وآسيا حيث كانت الاختبارات الجينومية المتقدمة محدودة أو غير متاحة في السابق. يمكن أن يساعد الوصول إلى اختبارات تسلسل الجيل التالي المحلية في تمكين التحليل الأسرع للجينات ذات الصلة، مما يسمح لمقدمي الرعاية الصحية باختيار أفضل دواء لهذا المريض المحدد.
- في أبريل 2023، وقعت شركة Agilent Technologies Inc مذكرة تفاهم مع شركة Theragen Bio في كوريا الجنوبية. وكجزء من اتفاقية الشراكة، جمعت شركة Agilent وشركة Theragen Bio نقاط قوتهما في تصميم ملف تعريف الجينوم السرطاني والمعرفة الهندسية والخبرة في مجال البرمجيات لتعزيز قدرات التحليل المحلية وتسريع قرارات العلاج.
- في أبريل 2023، أطلقت شركة MetaSystems Probes GmbH أربعة أجهزة XCyting New MetaSystems Probes جديدة—XL t(11;14) CCND1/IGH DF، وXL CCND3/IGH DF، وXL CUX1/EZH2/7cen، وXL DiGeorge TBX1.
- في مايو 2022، أطلقت شركة MetaSystems Probes GmbH ثلاثة مجسات جديدة لتفكيك موضع XCyting - XL TCL1 BA وXL SPI1 BA وXL CSF1R BA - إلى مجموعة أمراض الدم والأورام الخاصة بها. تم تصميم XL TCL1 BA للكشف عن موضع مجموعة جين TCL1 الذي يتضمن عمليات إعادة ترتيب موصوفة في العديد من حالات سرطان الدم الليمفاوي الحاد في الخلايا التائية (T-PLL). يعد XL SPI1 BA مناسبًا للكشف عن موضع جين SPI1 الذي يتضمن عمليات إعادة ترتيب في حالات سرطان الدم الليمفاوي الحاد في الخلايا التائية (T-ALL) عند الأطفال. يعد XL CSF1R BA أحد الجينات البارزة المشاركة في عمليات إعادة ترتيب متعددة موصوفة في مجموعة فرعية عالية الخطورة من اضطرابات سرطان الدم الليمفاوي الحاد، والتي تمثل سرطان الدم الليمفاوي الحاد السلفي للخلايا البائية.
- في ديسمبر 2021، أطلقت شركة BioGenex Laboratories Inc ثلاثة أجسام مضادة جديدة للمناعة الكيميائية الأولية (IHC) لتشخيص السرطان - CD8A وCD56 وCD163.
رؤى إقليمية حول سوق أنظمة التصوير بالتهجين الفلوري الموضعي (FISH)
لقد قام المحللون في Insight Partners بشرح الاتجاهات والعوامل الإقليمية المؤثرة على سوق أنظمة التصوير بالتهجين الموضعي الفلوري (FISH) طوال فترة التوقعات بشكل شامل. يناقش هذا القسم أيضًا قطاعات سوق أنظمة التصوير بالتهجين الموضعي الفلوري (FISH) والجغرافيا في جميع أنحاء أمريكا الشمالية وأوروبا ومنطقة آسيا والمحيط الهادئ والشرق الأوسط وأفريقيا وأمريكا الجنوبية والوسطى.
- احصل على البيانات الإقليمية المحددة لسوق أنظمة التصوير بالتهجين الموضعي الفلوري (FISH)
نطاق تقرير سوق أنظمة التصوير بالتهجين الموضعي الفلوري (FISH)
| سمة التقرير | تفاصيل |
|---|---|
| حجم السوق في عام 2022 | 1.08 مليار دولار أمريكي |
| حجم السوق بحلول عام 2030 | 1.9 مليار دولار أمريكي |
| معدل النمو السنوي المركب العالمي (2022 - 2030) | 7.3% |
| البيانات التاريخية | 2020-2021 |
| فترة التنبؤ | 2023-2030 |
| القطاعات المغطاة | حسب المنتج
|
| المناطق والدول المغطاة | أمريكا الشمالية
|
| قادة السوق وملفات تعريف الشركات الرئيسية |
|
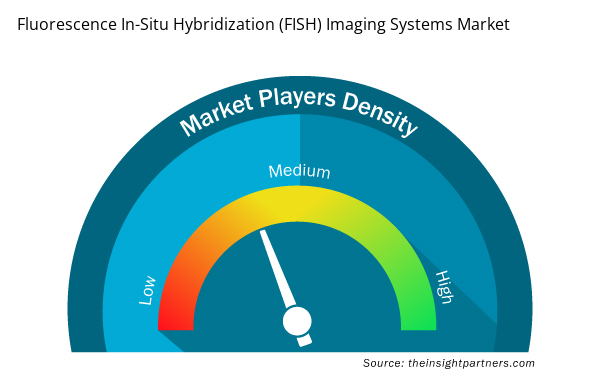
كثافة اللاعبين في سوق أنظمة التصوير بالتهجين الموضعي الفلوري (FISH): فهم تأثيرها على ديناميكيات الأعمال
يشهد سوق أنظمة التصوير بالتهجين الموضعي الفلوري (FISH) نموًا سريعًا، مدفوعًا بالطلب المتزايد من المستخدم النهائي بسبب عوامل مثل تفضيلات المستهلك المتطورة والتقدم التكنولوجي والوعي الأكبر بفوائد المنتج. ومع ارتفاع الطلب، تعمل الشركات على توسيع عروضها والابتكار لتلبية احتياجات المستهلكين والاستفادة من الاتجاهات الناشئة، مما يؤدي إلى زيادة نمو السوق.
تشير كثافة اللاعبين في السوق إلى توزيع الشركات أو المؤسسات العاملة في سوق أو صناعة معينة. وهي تشير إلى عدد المنافسين (اللاعبين في السوق) الموجودين في مساحة سوق معينة نسبة إلى حجمها أو قيمتها السوقية الإجمالية.
الشركات الرئيسية العاملة في سوق أنظمة التصوير بالتهجين الموضعي الفلوري (FISH) هي:
- يوروكلون سبا
- شركة تيوسيجنوستيكس المحدودة
- شركة اجيلنت للتكنولوجيا
- شركة أبنوفا تايوان
- مختبرات بيوجينكس
إخلاء المسؤولية : الشركات المذكورة أعلاه ليست مرتبة بأي ترتيب معين.
- احصل على نظرة عامة على أهم اللاعبين الرئيسيين في سوق أنظمة التصوير بالتهجين الموضعي الفلوري (FISH)
المنافسة والشركات الرئيسية:
تعد Euroclone SpA وTissueGnostics GmbH وAgilent Technologies Inc وAbnova Taiwan Corp وBioGenex Laboratories Inc وLeica Biosystems Nussloch GmbH وMetaSystems Probes GmbH وBio-View Ltd وThermo Fisher Scientific Inc وApplied Spectral Imaging وPerkinElmer Inc من بين اللاعبين البارزين الذين يعملون في سوق أنظمة التصوير بالتهجين الموضعي الفلوري (FISH). تركز هذه الشركات على التقنيات الجديدة والتقدم في المنتجات الحالية والتوسع الجغرافي لتلبية الطلب المتزايد من المستهلكين في جميع أنحاء العالم وزيادة نطاق منتجاتها في محافظ المنتجات المتخصصة.
- التحليل التاريخي (سنتان)، السنة الأساسية، التوقعات (7 سنوات) مع معدل النمو السنوي المركب
- تحليل PEST و SWOT
- حجم السوق والقيمة / الحجم - عالميًا وإقليميًا وقطريًا
- الصناعة والمنافسة
- مجموعة بيانات Excel


Report Coverage
Revenue forecast, Company Analysis, Industry landscape, Growth factors, and Trends

Segment Covered
This text is related
to segments covered.

Regional Scope
North America, Europe, Asia Pacific, Middle East & Africa, South & Central America

Country Scope
This text is related
to country scope.
الأسئلة الشائعة
Fluorescence in situ hybridization (FISH) is a molecular technique for cytogenetic analysis. This technique uses fluorescent probes that bind to only particular parts of a nucleic acid sequence with a high degree of sequence complementarity. FISH detects the presence or absence of specific DNA sequences on chromosomes. FISH is often used to find specific features in DNA/RNA targets for medicine, genetic counseling, and species identification.
The fluorescence in-situ hybridization (FISH) imaging systems market majorly consists of the players, including Euroclone SpA, TissueGnostics GmbH, Agilent Technologies Inc, Abnova Taiwan Corp, BioGenex Laboratories Inc, Leica Biosystems Nussloch GmbH, MetaSystems Probes GmbH, Bio-View Ltd, Thermo Fisher Scientific Inc, Applied Spectral Imaging, and PerkinElmer Inc.
Factors such as the rising prevalence of target disorders and the increasing R&D investments in in-vitro diagnostics propel market growth.
The fluorescence in-situ hybridization (FISH) imaging systems market was valued at US$ 1,084.02 million in 2022.
The fluorescence in-situ hybridization (FISH) imaging systems market, by end user, is segmented into diagnostic laboratories, contract research organizations, pharmaceutical and biotechnological companies, and others. The diagnostic laboratories segment held a larger market share in 2022, and the same segment is anticipated to register a higher CAGR.
The fluorescence in-situ hybridization (FISH) imaging systems market is expected to be valued at US$ 1,901.38 million in 2030.
The global fluorescence in-situ hybridization (FISH) imaging systems market, by application, is segmented into cancer diagnosis, genetic disease diagnosis, infectious disease diagnosis, and others. The cancer diagnosis segment held a larger market share in 2022, and the same segment is anticipated to register a higher CAGR.
The fluorescence in-situ hybridization (FISH) imaging systems market, by services, is segmented into pharmacokinetics, biomarkers, immunogenicity, virology testing, cell-based assays, and others. The cell-based assays segment held a larger market share in 2022. Also, the same segment is anticipated to register a higher CAGR.
The List of Companies - Fluorescence In-Situ Hybridization (FISH) Imaging Systems Market
- Euroclone SpA
- TissueGnostics GmbH
- Agilent Technologies Inc
- Abnova Taiwan Corp
- BioGenex Laboratories Inc
- Leica Biosystems Nussloch GmbH
- MetaSystems Probes GmbH
- Bio-View Ltd
- Thermo Fisher Scientific Inc
- Applied Spectral Imaging
- PerkinElmer Inc
The Insight Partners performs research in 4 major stages: Data Collection & Secondary Research, Primary Research, Data Analysis and Data Triangulation & Final Review.
- Data Collection and Secondary Research:
As a market research and consulting firm operating from a decade, we have published and advised several client across the globe. First step for any study will start with an assessment of currently available data and insights from existing reports. Further, historical and current market information is collected from Investor Presentations, Annual Reports, SEC Filings, etc., and other information related to company’s performance and market positioning are gathered from Paid Databases (Factiva, Hoovers, and Reuters) and various other publications available in public domain.
Several associations trade associates, technical forums, institutes, societies and organization are accessed to gain technical as well as market related insights through their publications such as research papers, blogs and press releases related to the studies are referred to get cues about the market. Further, white papers, journals, magazines, and other news articles published in last 3 years are scrutinized and analyzed to understand the current market trends.
- Primary Research:
The primarily interview analysis comprise of data obtained from industry participants interview and answers to survey questions gathered by in-house primary team.
For primary research, interviews are conducted with industry experts/CEOs/Marketing Managers/VPs/Subject Matter Experts from both demand and supply side to get a 360-degree view of the market. The primary team conducts several interviews based on the complexity of the markets to understand the various market trends and dynamics which makes research more credible and precise.
A typical research interview fulfils the following functions:
- Provides first-hand information on the market size, market trends, growth trends, competitive landscape, and outlook
- Validates and strengthens in-house secondary research findings
- Develops the analysis team’s expertise and market understanding
Primary research involves email interactions and telephone interviews for each market, category, segment, and sub-segment across geographies. The participants who typically take part in such a process include, but are not limited to:
- Industry participants: VPs, business development managers, market intelligence managers and national sales managers
- Outside experts: Valuation experts, research analysts and key opinion leaders specializing in the electronics and semiconductor industry.
Below is the breakup of our primary respondents by company, designation, and region:

Once we receive the confirmation from primary research sources or primary respondents, we finalize the base year market estimation and forecast the data as per the macroeconomic and microeconomic factors assessed during data collection.
- Data Analysis:
Once data is validated through both secondary as well as primary respondents, we finalize the market estimations by hypothesis formulation and factor analysis at regional and country level.
- Macro-Economic Factor Analysis:
We analyse macroeconomic indicators such the gross domestic product (GDP), increase in the demand for goods and services across industries, technological advancement, regional economic growth, governmental policies, the influence of COVID-19, PEST analysis, and other aspects. This analysis aids in setting benchmarks for various nations/regions and approximating market splits. Additionally, the general trend of the aforementioned components aid in determining the market's development possibilities.
- Country Level Data:
Various factors that are especially aligned to the country are taken into account to determine the market size for a certain area and country, including the presence of vendors, such as headquarters and offices, the country's GDP, demand patterns, and industry growth. To comprehend the market dynamics for the nation, a number of growth variables, inhibitors, application areas, and current market trends are researched. The aforementioned elements aid in determining the country's overall market's growth potential.
- Company Profile:
The “Table of Contents” is formulated by listing and analyzing more than 25 - 30 companies operating in the market ecosystem across geographies. However, we profile only 10 companies as a standard practice in our syndicate reports. These 10 companies comprise leading, emerging, and regional players. Nonetheless, our analysis is not restricted to the 10 listed companies, we also analyze other companies present in the market to develop a holistic view and understand the prevailing trends. The “Company Profiles” section in the report covers key facts, business description, products & services, financial information, SWOT analysis, and key developments. The financial information presented is extracted from the annual reports and official documents of the publicly listed companies. Upon collecting the information for the sections of respective companies, we verify them via various primary sources and then compile the data in respective company profiles. The company level information helps us in deriving the base number as well as in forecasting the market size.
- Developing Base Number:
Aggregation of sales statistics (2020-2022) and macro-economic factor, and other secondary and primary research insights are utilized to arrive at base number and related market shares for 2022. The data gaps are identified in this step and relevant market data is analyzed, collected from paid primary interviews or databases. On finalizing the base year market size, forecasts are developed on the basis of macro-economic, industry and market growth factors and company level analysis.
- Data Triangulation and Final Review:
The market findings and base year market size calculations are validated from supply as well as demand side. Demand side validations are based on macro-economic factor analysis and benchmarks for respective regions and countries. In case of supply side validations, revenues of major companies are estimated (in case not available) based on industry benchmark, approximate number of employees, product portfolio, and primary interviews revenues are gathered. Further revenue from target product/service segment is assessed to avoid overshooting of market statistics. In case of heavy deviations between supply and demand side values, all thes steps are repeated to achieve synchronization.
We follow an iterative model, wherein we share our research findings with Subject Matter Experts (SME’s) and Key Opinion Leaders (KOLs) until consensus view of the market is not formulated – this model negates any drastic deviation in the opinions of experts. Only validated and universally acceptable research findings are quoted in our reports.
We have important check points that we use to validate our research findings – which we call – data triangulation, where we validate the information, we generate from secondary sources with primary interviews and then we re-validate with our internal data bases and Subject matter experts. This comprehensive model enables us to deliver high quality, reliable data in shortest possible time.
 احصل على عينة مجانية لهذا التقرير