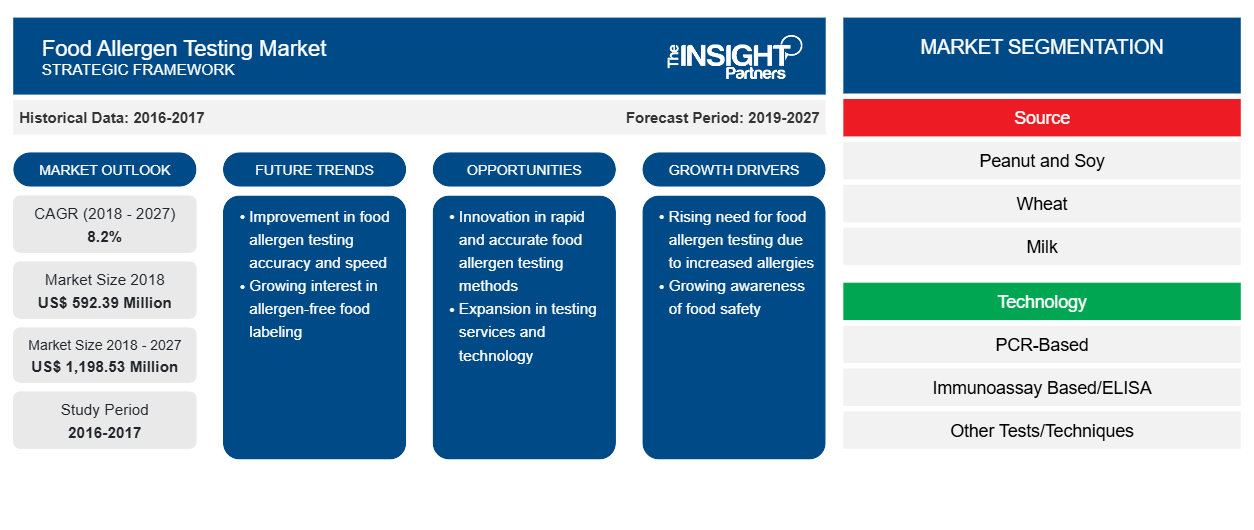
بلغت قيمة سوق اختبار المواد المسببة للحساسية الغذائية 592.39 مليون دولار أمريكي في عام 2018 ومن المتوقع أن تصل إلى 1،198.53 مليون دولار أمريكي بحلول عام 2027؛ ومن المتوقع أن ينمو بمعدل نمو سنوي مركب قدره 8.2٪ من عام 2019 إلى عام 2027.
إن مسببات الحساسية الغذائية هي بروتينات موجودة بشكل طبيعي في الأطعمة أو المكونات التي تسبب استجابة مناعية غير طبيعية. ويحدث ذلك عندما يتعرف الجهاز المناعي البشري بشكل خاطئ على هذه البروتينات الموجودة في الطعام على أنها ضارة. وتشمل مسببات الحساسية الغذائية الأكثر شيوعًا في جميع أنحاء العالم البيض والمأكولات البحرية والحليب والفول السوداني والمحار وفول الصويا والقمح والمكسرات الشجرية وجوز البرازيل وجوز الصنوبر والكاجو والفستق والجوز. ونظرًا لأن مسببات الحساسية الغذائية تمثل خطرًا متزايدًا على الأشخاص الذين يعانون من الحساسية، فمن الأهمية بمكان أن يقوم منتجو الأغذية بإجراء اختبارات روتينية للوجود المحتمل لمسببات الحساسية في منتجاتهم الغذائية. يساعد اختبار مسببات الحساسية الغذائية في التحقق مما إذا كانت المواد الخام والمنتج الغذائي النهائي خاليين من مسببات الحساسية الغذائية غير المرغوب فيها. تستخدم صناعات الأغذية عادةً اختبار الممتص المناعي المرتبط بالإنزيم (ELISA) للكشف عن مسببات الحساسية في المنتجات الغذائية لأنه تقنية سهلة وأقل استهلاكًا للوقت؛ علاوة على ذلك، فإن الاختبار حساس للغاية وفعال من حيث التكلفة وموثوق ودقيق. يتم استخدام اختبار ELISA بنجاح للكشف عن المواد المسببة للحساسية في الحليب ومنتجات الألبان، واللحوم ومنتجات اللحوم، والأسماك ومنتجات الأسماك، والمكسرات، وفول الصويا والمنتجات القائمة على المكسرات، وعصائر الفاكهة ومكوناتها، وغيرها.
نشأ وباء كوفيد-19 في مدينة ووهان (الصين) في ديسمبر 2019، ومنذ ذلك الحين انتشر في جميع أنحاء العالم بوتيرة سريعة. تعد الولايات المتحدة وروسيا والهند وإيطاليا والصين وإسبانيا وفرنسا وألمانيا من بين الدول الأكثر تضررًا من حيث الحالات المؤكدة والوفيات المبلغ عنها، اعتبارًا من يونيو 2020. أثر الوباء على الاقتصادات والصناعات بسبب عمليات الإغلاق المفروضة وحظر السفر وإغلاق الشركات. تعد الأغذية والمشروبات واحدة من الصناعات الرئيسية في العالم التي تعاني من اضطرابات خطيرة مثل انقطاع سلسلة التوريد وإلغاء الأحداث التكنولوجية وإغلاق المكاتب نتيجة لهذا الوباء. كما أن الانهيار الاقتصادي لسوق اختبار مسببات الحساسية الغذائية العالمية بسبب كوفيد-19 يحد أيضًا من الطلب على اختبار مسببات الحساسية الغذائية بسبب إغلاق المصانع وتعليق الإنتاج بسبب العقبات في سلاسل التوريد.
قم بتخصيص هذا التقرير ليناسب متطلباتك
ستحصل على تخصيص لأي تقرير - مجانًا - بما في ذلك أجزاء من هذا التقرير، أو تحليل على مستوى الدولة، وحزمة بيانات Excel، بالإضافة إلى الاستفادة من العروض والخصومات الرائعة للشركات الناشئة والجامعات
سوق اختبار المواد المسببة للحساسية الغذائية:
- احصل على أهم اتجاهات السوق الرئيسية لهذا التقرير.ستتضمن هذه العينة المجانية تحليلاً للبيانات، بدءًا من اتجاهات السوق وحتى التقديرات والتوقعات.
رؤى السوق
نمو التجارة الدولية في الأغذية ومكوناتها
إن النمو السريع في صناعة الأغذية والمشروبات بالإضافة إلى زيادة التجارة الدولية للأغذية ومكونات الأغذية يوفر فرصًا لنمو اللاعبين الرئيسيين العاملين في سوق اختبار مسببات الحساسية الغذائية. يتم فحص الأغذية ومكونات الأغذية المستوردة في أمريكا الشمالية وأوروبا والشرق الأوسط بدقة وفقًا لمعايير الجودة والوسم. لذلك، يحتاج مصنعو الأغذية والمشروبات الذين يصدرون منتجاتهم في بلدان في هذه المناطق إلى اتباع لوائح صارمة لسلامة الأغذية والوسم، مما يزيد من ضرورة اختبار مسببات الحساسية الغذائية. لقد شهد العالم زيادة إجمالية في الطلب على الغذاء بسبب الزيادة في عدد السكان والتحضر والقوة الشرائية الأعلى، إلى جانب التحول في التفضيلات الغذائية. تمتلك دول مثل الهند واليابان وأستراليا والبرازيل والمكسيك صناعات غذائية راسخة، ويتم تصدير الأغذية المنتجة في هذه البلدان بشكل أساسي إلى دول مثل الولايات المتحدة وألمانيا وفرنسا والمملكة العربية السعودية والإمارات العربية المتحدة. يركز منتجو الأغذية على زيادة الصادرات الإجمالية لتحقيق أرباح أكبر. يتم تصدير أنواع مختلفة من الأغذية ومكوناتها مثل منتجات الألبان والمأكولات البحرية والبيض والفواكه والخضروات والأطعمة الفاخرة والأغذية العضوية واللحوم والأغذية المعبأة والتوابل ومنتجات الحبوب إلى جميع أنحاء العالم.
رؤى المصدر
يتم تقسيم سوق اختبار مسببات الحساسية الغذائية، بناءً على المصدر، إلى الفول السوداني وفول الصويا والقمح والحليب والبيض والمكسرات والمأكولات البحرية وغيرها. في عام 2018، شكل قطاع الحليب الحصة الأكبر من السوق. تعزى الحصة الأكبر من قطاع الحليب في المقام الأول إلى زيادة حالات الحساسية الغذائية الناجمة عن الحليب في مناطق مثل أمريكا الشمالية وأوروبا ومنطقة آسيا والمحيط الهادئ. عدم تحمل اللاكتوز هو اضطراب هضمي ناتج عن عدم القدرة على هضم اللاكتوز، وهو الكربوهيدرات الرئيسية الموجودة في منتجات الألبان. لذلك، يتجنب الأشخاص الذين يعانون من عدم تحمل اللاكتوز الحليب ومنتجات الألبان. حساسية حليب البقر هي أكثر أنواع الحساسية الغذائية شيوعًا عند الرضع والأطفال الصغار. ~2.5٪ من الأطفال دون سن 3 سنوات يعانون من حساسية الحليب. إن العدد المتزايد من الأشخاص الذين يعانون من عدم تحمل اللاكتوز في جميع أنحاء العالم يعزز نمو سوق اختبار مسببات الحساسية الغذائية لقطاع الحليب.
رؤى التكنولوجيا
إن سوق اختبارات مسببات الحساسية الغذائية، استنادًا إلى التكنولوجيا، مقسمة إلى اختبارات تعتمد على تفاعل البوليميراز المتسلسل، واختبارات تعتمد على التحليل المناعي/اختبار الإليزا، واختبارات/تقنيات أخرى. إن تفاعل البوليميراز المتسلسل هو تقنية تستخدم على نطاق واسع لعمل ملايين إلى مليارات النسخ من عينة DNA محددة بسرعة، مما يسمح للعلماء بأخذ عينة صغيرة جدًا من DNA وتكثيفها إلى كمية كبيرة بما يكفي لدراستها بالتفصيل. تم اختراع تفاعل البوليميراز المتسلسل في عام 1984 من قبل الكيميائي الحيوي الأمريكي كاري موليس في شركة Cetus Corporation. إنه مهم لكثير من الاختبارات الجينية، بما في ذلك فحص العينات القديمة من DNA وتحديد العوامل المعدية. من بين أمور أخرى، فإن اختبار المناعة/اختبار الإليزا هو المنهجية الأكثر استخدامًا وشعبية للمراقبة الروتينية لمسببات الحساسية نظرًا لدقتها العالية وحساسيتها وإمكاناتها الجيدة للتوحيد القياسي. كما أن اختبار الإليزا هو البروتوكول الرائد لمعظم الأدوات التجارية المخصصة لقياس مستويات منخفضة من مسببات الحساسية الغذائية في مكونات الطعام جنبًا إلى جنب مع الأطعمة والمشروبات المصنعة والمحضرة. ونتيجة لذلك، هناك طلب متزايد على الاستراتيجيات التحليلية التي تستخدم خارج بيئة المختبر لتقييم جودة وسلامة الأغذية في الموقع.
رؤى حول اختبار الأغذية
تعتبر منتجات المخابز والحلويات، وأغذية الأطفال، والأغذية المصنعة، ومنتجات الألبان والبدائل، والمأكولات البحرية ومنتجات اللحوم، وغيرها من الأطعمة عرضة للتسبب في الحساسية. بالإضافة إلى ذلك، فإن تدهور جودة الأعلاف الحيوانية يؤدي إلى احتمالية تسبب اللحوم في الحساسية لدى البشر. وعلى الرغم من أن صناعة الأغذية والمشروبات تشهد ارتفاعًا في الطلب على إضافات الأعلاف الحيوانية القادرة على تحسين جودة الأعلاف، إلا أن سوق اختبار عدم تحمل الطعام لا يزال يتمتع بمكانة قوية بسبب تخفيف الحساسية الناجمة عن اللحوم.
تعد شركات Dicentra و Eurofins Scientific SE و Intertek Group plc و Mérieux NutriSciences و Microbac Laboratories Inc و Neogen Corporation و ALS Limited و Romer Labs Diagnostic Gmbh و SGS SA و UV SUD SPB PTE. LTD من بين اللاعبين الرئيسيين في سوق اختبار المواد المسببة للحساسية الغذائية العالمية من خلال تنفيذ هذه الاستراتيجيات لتوسيع قاعدة العملاء والحصول على حصة كبيرة، مما يسمح لهم بدوره بالحفاظ على اسم علامتهم التجارية عالميًا.
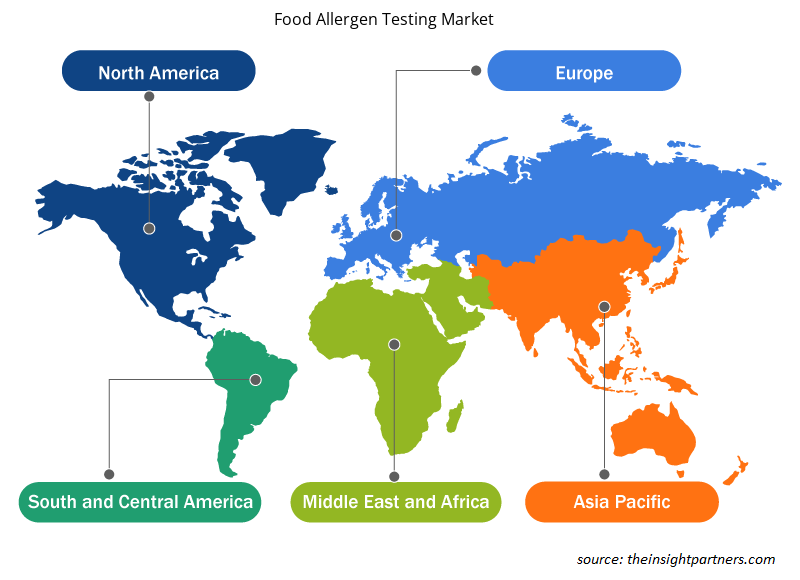
رؤى إقليمية حول سوق اختبار المواد المسببة للحساسية الغذائية
لقد قام المحللون في Insight Partners بشرح الاتجاهات والعوامل الإقليمية المؤثرة على سوق اختبار مسببات الحساسية الغذائية طوال فترة التوقعات بشكل شامل. يناقش هذا القسم أيضًا قطاعات سوق اختبار مسببات الحساسية الغذائية والجغرافيا في جميع أنحاء أمريكا الشمالية وأوروبا ومنطقة آسيا والمحيط الهادئ والشرق الأوسط وأفريقيا وأمريكا الجنوبية والوسطى.
- احصل على البيانات الإقليمية المحددة لسوق اختبار المواد المسببة للحساسية الغذائية
نطاق تقرير سوق اختبار المواد المسببة للحساسية الغذائية
| سمة التقرير | تفاصيل |
|---|---|
| حجم السوق في عام 2018 | 592.39 مليون دولار أمريكي |
| حجم السوق بحلول عام 2027 | 1,198.53 مليون دولار أمريكي |
| معدل النمو السنوي المركب العالمي (2018 - 2027) | 8.2% |
| البيانات التاريخية | 2016-2017 |
| فترة التنبؤ | 2019-2027 |
| القطاعات المغطاة | حسب المصدر
|
| المناطق والدول المغطاة | أمريكا الشمالية
|
| قادة السوق وملفات تعريف الشركات الرئيسية |
|
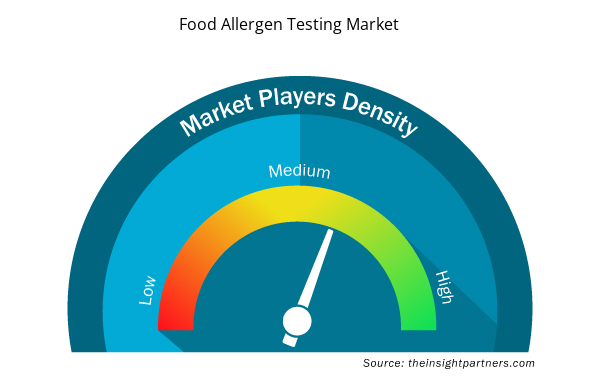
كثافة اللاعبين في السوق: فهم تأثيرها على ديناميكيات الأعمال
يشهد سوق اختبار المواد المسببة للحساسية الغذائية نموًا سريعًا، مدفوعًا بالطلب المتزايد من المستخدم النهائي بسبب عوامل مثل تفضيلات المستهلك المتطورة والتقدم التكنولوجي والوعي المتزايد بفوائد المنتج. ومع ارتفاع الطلب، تعمل الشركات على توسيع عروضها والابتكار لتلبية احتياجات المستهلكين والاستفادة من الاتجاهات الناشئة، مما يؤدي إلى زيادة نمو السوق.
تشير كثافة اللاعبين في السوق إلى توزيع الشركات أو المؤسسات العاملة في سوق أو صناعة معينة. وهي تشير إلى عدد المنافسين (اللاعبين في السوق) الموجودين في مساحة سوق معينة نسبة إلى حجمها أو قيمتها السوقية الإجمالية.
الشركات الرئيسية العاملة في سوق اختبار مسببات الحساسية الغذائية هي:
- ديسينترا
- يوروفينز ساينتيفيك إس إي
- مجموعة إنترتك المحدودة
- ميريو نوتري ساينسز
- مختبرات ميكروباك المحدودة
إخلاء المسؤولية : الشركات المذكورة أعلاه ليست مرتبة بأي ترتيب معين.
- احصل على نظرة عامة على أهم اللاعبين الرئيسيين في سوق اختبار مسببات الحساسية الغذائية
السوق العالمية لاختبارات مسببات الحساسية الغذائية – حسب المصدر
- الفول السوداني والصويا
- قمح
- لبن
- بيضة
- المكسرات الشجرية
- المأكولات البحرية
- آحرون
السوق العالمية لاختبار المواد المسببة للحساسية الغذائية – حسب التكنولوجيا
- يعتمد على تفاعل البوليميراز المتسلسل
- اختبار المناعة القائم على المقايسة/ELISA
- اختبارات/تقنيات أخرى
السوق العالمية لاختبار المواد المسببة للحساسية الغذائية – بواسطة Food Tested
- المخابز والحلويات
- أغذية الأطفال
- الأغذية المصنعة
- منتجات الألبان والبدائل
- المأكولات البحرية ومنتجات اللحوم
- أطعمة أخرى
نبذة عن الشركة
- ديسينترا
- يوروفينز ساينتيفيك إس إي
- مجموعة إنترتك المحدودة
- ميريو نوتريساينسز
- مختبرات ميكروباك المحدودة
- شركة نيوجين
- شركة ALS المحدودة
- مختبرات رومر للتشخيص المحدودة
- شركة اس جي اس اس ايه
- شركة UV SUD SPB PTE المحدودة.
- التحليل التاريخي (سنتان)، السنة الأساسية، التوقعات (7 سنوات) مع معدل النمو السنوي المركب
- تحليل PEST و SWOT
- حجم السوق والقيمة / الحجم - عالميًا وإقليميًا وقطريًا
- الصناعة والمنافسة
- مجموعة بيانات Excel


- GNSS Chip Market
- Vision Guided Robotics Software Market
- Quantitative Structure-Activity Relationship (QSAR) Market
- Maritime Analytics Market
- Pharmacovigilance and Drug Safety Software Market
- Biopharmaceutical Contract Manufacturing Market
- EMC Testing Market
- Precast Concrete Market
- Digital Pathology Market
- Medical Enzyme Technology Market

Report Coverage
Revenue forecast, Company Analysis, Industry landscape, Growth factors, and Trends

Segment Covered
This text is related
to segments covered.

Regional Scope
North America, Europe, Asia Pacific, Middle East & Africa, South & Central America

Country Scope
This text is related
to country scope.
الأسئلة الشائعة
The growth of the milk segment is primarily attributed to the increasing incidence of food allergens caused due to milk in the developed and developing regions such as North America, Europe, and the Asia Pacific. Food allergy to cow’s milk is the most common food allergy in infants and young children. About 2.5% of children under three years old are allergic to milk. Additionally, an increasing number of people suffering from lactose intolerance across the globe is boosting the growth of the food allergen testing market.
The major players operating in the globalfood allergen testing market areDicentra, Eurofins Scientific SE, Intertek Group Plc, Mérieux NutriSciences, Microbac Laboratories Inc., Neogen Corporation, ALS Limited, Romer Labs Diagnostic Gmbh, SGS S.A., TUV SUD SPB PTE. LTD., and R-Biopharm AG, among others.
In 2018,the food allergen testing marketwas predominantinNorth Americaat theglobal level.An increasing number of food allergy incidences in the US and Canada and stringent labeling regulations pertaining to food allergen are the key factors boosting the growth of the food allergen testing market in North America.
The List of Companies - Global Food Allergen Testing Market
- Dicentra
- Eurofins Scientific SE
- Intertek Group plc
- MérieuxNutriSciences
- Microbac Laboratories Inc
- Neogen Corporation
- ALS Limited
- Romer Labs Diagnostic Gmbh
- SGS S.A.
- UV SUD SPB PTE. LTD.


The Insight Partners performs research in 4 major stages: Data Collection & Secondary Research, Primary Research, Data Analysis and Data Triangulation & Final Review.
- Data Collection and Secondary Research:
As a market research and consulting firm operating from a decade, we have published and advised several client across the globe. First step for any study will start with an assessment of currently available data and insights from existing reports. Further, historical and current market information is collected from Investor Presentations, Annual Reports, SEC Filings, etc., and other information related to company’s performance and market positioning are gathered from Paid Databases (Factiva, Hoovers, and Reuters) and various other publications available in public domain.
Several associations trade associates, technical forums, institutes, societies and organization are accessed to gain technical as well as market related insights through their publications such as research papers, blogs and press releases related to the studies are referred to get cues about the market. Further, white papers, journals, magazines, and other news articles published in last 3 years are scrutinized and analyzed to understand the current market trends.
- Primary Research:
The primarily interview analysis comprise of data obtained from industry participants interview and answers to survey questions gathered by in-house primary team.
For primary research, interviews are conducted with industry experts/CEOs/Marketing Managers/VPs/Subject Matter Experts from both demand and supply side to get a 360-degree view of the market. The primary team conducts several interviews based on the complexity of the markets to understand the various market trends and dynamics which makes research more credible and precise.
A typical research interview fulfils the following functions:
- Provides first-hand information on the market size, market trends, growth trends, competitive landscape, and outlook
- Validates and strengthens in-house secondary research findings
- Develops the analysis team’s expertise and market understanding
Primary research involves email interactions and telephone interviews for each market, category, segment, and sub-segment across geographies. The participants who typically take part in such a process include, but are not limited to:
- Industry participants: VPs, business development managers, market intelligence managers and national sales managers
- Outside experts: Valuation experts, research analysts and key opinion leaders specializing in the electronics and semiconductor industry.
Below is the breakup of our primary respondents by company, designation, and region:

Once we receive the confirmation from primary research sources or primary respondents, we finalize the base year market estimation and forecast the data as per the macroeconomic and microeconomic factors assessed during data collection.
- Data Analysis:
Once data is validated through both secondary as well as primary respondents, we finalize the market estimations by hypothesis formulation and factor analysis at regional and country level.
- Macro-Economic Factor Analysis:
We analyse macroeconomic indicators such the gross domestic product (GDP), increase in the demand for goods and services across industries, technological advancement, regional economic growth, governmental policies, the influence of COVID-19, PEST analysis, and other aspects. This analysis aids in setting benchmarks for various nations/regions and approximating market splits. Additionally, the general trend of the aforementioned components aid in determining the market's development possibilities.
- Country Level Data:
Various factors that are especially aligned to the country are taken into account to determine the market size for a certain area and country, including the presence of vendors, such as headquarters and offices, the country's GDP, demand patterns, and industry growth. To comprehend the market dynamics for the nation, a number of growth variables, inhibitors, application areas, and current market trends are researched. The aforementioned elements aid in determining the country's overall market's growth potential.
- Company Profile:
The “Table of Contents” is formulated by listing and analyzing more than 25 - 30 companies operating in the market ecosystem across geographies. However, we profile only 10 companies as a standard practice in our syndicate reports. These 10 companies comprise leading, emerging, and regional players. Nonetheless, our analysis is not restricted to the 10 listed companies, we also analyze other companies present in the market to develop a holistic view and understand the prevailing trends. The “Company Profiles” section in the report covers key facts, business description, products & services, financial information, SWOT analysis, and key developments. The financial information presented is extracted from the annual reports and official documents of the publicly listed companies. Upon collecting the information for the sections of respective companies, we verify them via various primary sources and then compile the data in respective company profiles. The company level information helps us in deriving the base number as well as in forecasting the market size.
- Developing Base Number:
Aggregation of sales statistics (2020-2022) and macro-economic factor, and other secondary and primary research insights are utilized to arrive at base number and related market shares for 2022. The data gaps are identified in this step and relevant market data is analyzed, collected from paid primary interviews or databases. On finalizing the base year market size, forecasts are developed on the basis of macro-economic, industry and market growth factors and company level analysis.
- Data Triangulation and Final Review:
The market findings and base year market size calculations are validated from supply as well as demand side. Demand side validations are based on macro-economic factor analysis and benchmarks for respective regions and countries. In case of supply side validations, revenues of major companies are estimated (in case not available) based on industry benchmark, approximate number of employees, product portfolio, and primary interviews revenues are gathered. Further revenue from target product/service segment is assessed to avoid overshooting of market statistics. In case of heavy deviations between supply and demand side values, all thes steps are repeated to achieve synchronization.
We follow an iterative model, wherein we share our research findings with Subject Matter Experts (SME’s) and Key Opinion Leaders (KOLs) until consensus view of the market is not formulated – this model negates any drastic deviation in the opinions of experts. Only validated and universally acceptable research findings are quoted in our reports.
We have important check points that we use to validate our research findings – which we call – data triangulation, where we validate the information, we generate from secondary sources with primary interviews and then we re-validate with our internal data bases and Subject matter experts. This comprehensive model enables us to deliver high quality, reliable data in shortest possible time.
 احصل على عينة مجانية لهذا التقرير