نمو سوق أقطاب الجرافيت والحجم والمشاركة والاتجاهات وتحليل اللاعبين الرئيسيين والتوقعات حتى عام 2027
البيانات التاريخية : 2017-2018 | سنة الأساس : 2019 | فترة التنبؤ : 2020-2027توقعات سوق أقطاب الجرافيت حتى عام ٢٠٢٧ - تأثير كوفيد-١٩ والتحليل العالمي حسب نوع المنتج (عالي الطاقة، فائق الطاقة، عادي الطاقة)؛ والتطبيق (فرن القوس الكهربائي، فرن المغرفة، وغيرها)، والجغرافيا.
- تاريخ التقرير : Sep 2020
- رمز التقرير : TIPRE00014019
- الفئة : المواد الكيميائية والمواد
- الحالة : نُشرت
- تنسيقات التقارير المتاحة :


- عدد الصفحات : 142
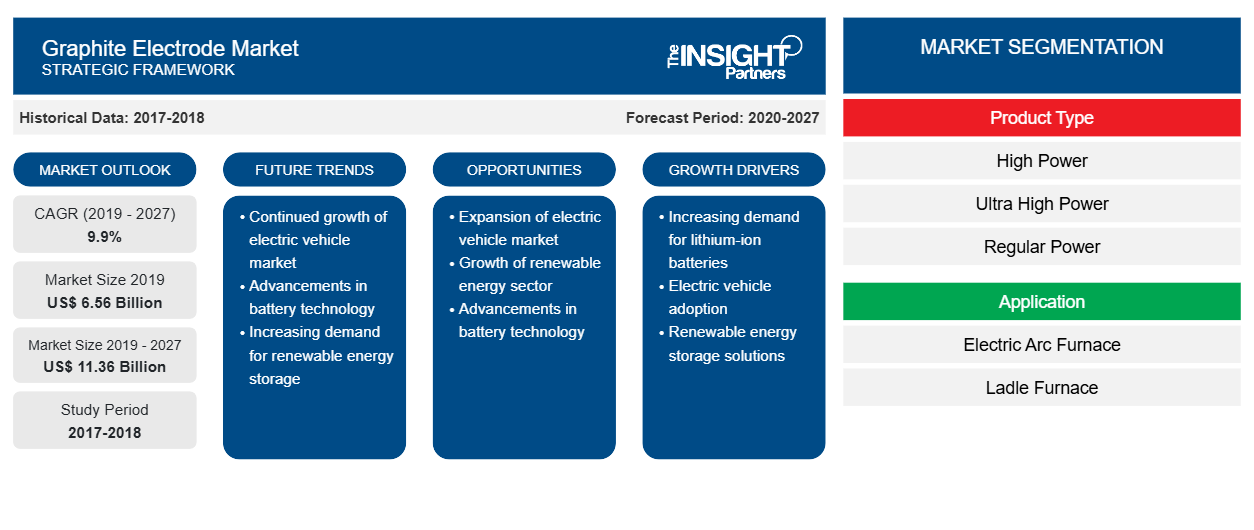
[تقرير بحثي] من حيث الإيرادات، بلغت قيمة سوق أقطاب الجرافيت 6,564.2 مليون دولار أمريكي في عام 2019 ومن المتوقع أن تصل إلى 11,356.4 مليون دولار أمريكي بحلول عام 2027 بمعدل نمو سنوي مركب قدره 9.9٪ من عام 2020 إلى عام 2027.
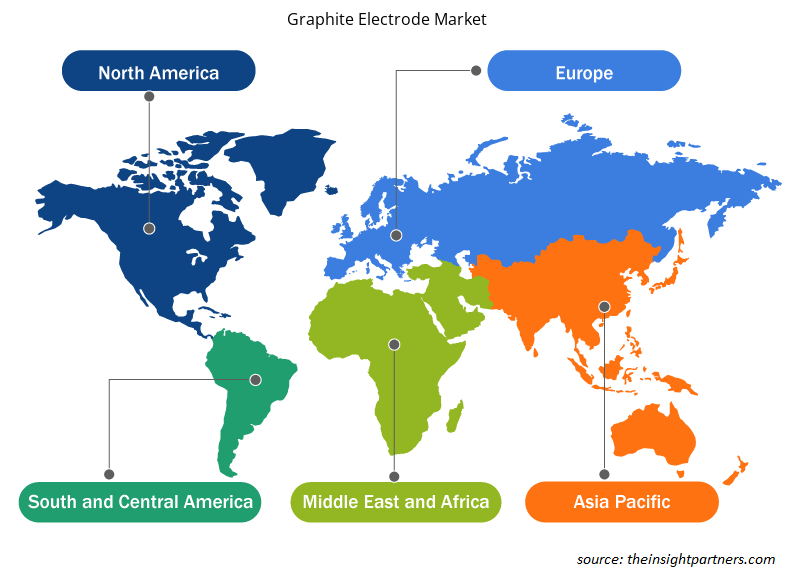
تهيمن منطقة آسيا والمحيط الهادئ على سوق أقطاب الجرافيت العالمية حيث تمثل حوالي 58٪ من سوق أقطاب الجرافيت العالمية مجتمعة. ويعزى الطلب المرتفع على أقطاب الجرافيت من هذه البلدان إلى الارتفاع الحاد في إنتاج الصلب الخام. وفقًا لاتحاد الصلب العالمي، في عام 2018، أنتجت الصين واليابان 928.3 و 104.3 مليون طن من الصلب الخام على التوالي. في منطقة آسيا والمحيط الهادئ، تحظى أفران القوس الكهربائي بطلب كبير بسبب ارتفاع خردة الصلب وزيادة إمدادات الطاقة الكهربائية في الصين. تشجع استراتيجيات السوق المتنامية من قبل العديد من الشركات في منطقة آسيا والمحيط الهادئ النمو في سوق أقطاب الجرافيت في المنطقة. على سبيل المثال، استحوذت شركة Tokai Carbon Co.، Ltd.، وهي شركة يابانية، على أعمال أقطاب الجرافيت لشركة SGL GE Holding GmbH (SGL GE)، بتكلفة 150 مليون دولار أمريكي.
لقد اتخذت حكومات الدول الأوروبية الكبرى مبادرات مختلفة للنهوض بقطاعات التصنيع والإلكترونيات وأشباه الموصلات، من بين أمور أخرى. وقد قامت أوروبا بتحديث حلولها الصناعية بشكل كبير من خلال مبادرات الصناعة 4.0. وتركز المفوضية الأوروبية على زيادة التمويل للبحث والتطوير لتعزيز القدرة التنافسية لقطاع التصنيع والقطاعات الأخرى في المنطقة في العالم. يرتبط الطلب على أقطاب الجرافيت بشكل مباشر بإنتاج الصلب في أفران القوس الكهربائي، والمنطقة هي واحدة من منتجي الصلب الأساسيين في العالم، حيث تعد روسيا أكبر المنتجين.
قم بتخصيص هذا التقرير ليناسب متطلباتك
ستحصل على تخصيص لأي تقرير - مجانًا - بما في ذلك أجزاء من هذا التقرير، أو تحليل على مستوى الدولة، وحزمة بيانات Excel، بالإضافة إلى الاستفادة من العروض والخصومات الرائعة للشركات الناشئة والجامعات
سوق أقطاب الجرافيت: رؤى استراتيجية
-
احصل على أهم اتجاهات السوق الرئيسية لهذا التقرير.ستتضمن هذه العينة المجانية تحليلاً للبيانات، بدءًا من اتجاهات السوق وحتى التقديرات والتوقعات.
تأثير جائحة كوفيد-19 على سوق أقطاب الجرافيت
وفقًا لأحدث تقرير حالة من منظمة الصحة العالمية، فإن الولايات المتحدة والهند وإسبانيا وإيطاليا وفرنسا وألمانيا والمملكة المتحدة وروسيا وتركيا والبرازيل وإيران والصين من بين الدول الأكثر تضررًا بسبب تفشي فيروس كورونا المستجد. بدأ تفشي المرض لأول مرة في ووهان (الصين) خلال ديسمبر 2019، ومنذ ذلك الحين انتشر بسرعة في جميع أنحاء العالم. تؤثر أزمة فيروس كورونا المستجد على الصناعات في جميع أنحاء العالم، ومن المتوقع أن يتضرر الاقتصاد العالمي بشدة في عام 2020 وربما في عام 2021. تسبب تفشي المرض في حدوث اضطرابات كبيرة في صناعة الصلب. يؤثر الانخفاض الحاد في التجارة الدولية سلبًا على نمو قطب الجرافيت. أثرت عمليات إغلاق الإنتاج والقيود المفروضة على سلسلة التوريد وإدارة المشتريات وندرة العمالة وإغلاق الحدود لمكافحة واحتواء تفشي المرض سلبًا على قطاع البناء. يؤثر تباطؤ الإنتاج في صناعة البناء بشكل مباشر على اعتماد منتجات الصلب المختلفة، وبالتالي يؤثر على سوق قطب الجرافيت.
رؤى السوق
التحول في صناعة الصلب الصينية يدعم نمو سوق أقطاب الجرافيت
في عامي 2016 و2017، تشكل مشهد صناعة الصلب في الصين من خلال الرفض السياسي لإمكانات IF حيث سعت الحكومة إلى تسجيل فائض في العرض المحلي. وفقًا لموقع worldsteel.org، وصل استهلاك خردة الصلب في مصانع الصلب EAF وBOF إلى مستوى قياسي أعلى من 200 مليون طن متري سنويًا. في غضون ذلك، تخلت قدرة EAF في الصين عن ذروة جديدة بلغت 130 مليون طن متري سنويًا حيث تقيد اللوائح الحكومية الإنتاج بواسطة المطاحن المتكاملة في المناطق الرئيسية وتعزز استبدالها بقوة بقدرة EAF. وقد أدى هذا إلى زيادة إنتاج فولاذ EAF، وبالتالي تسهيل نمو سوق أقطاب الجرافيت.
رؤى تعتمد على نوع المنتج
من حيث نوع المنتج، استحوذ قطاع الطاقة الفائقة على أكبر حصة من سوق أقطاب الجرافيت العالمية في عام 2019. يتم استخدام أقطاب الجرافيت الفائقة الطاقة لإعادة تدوير الفولاذ في صناعة فرن القوس الكهربائي (EAF). المكون الرئيسي لها هو فحم الكوك عالي القيمة، والذي يتم إنتاجه إما من البترول أو قطران الفحم. يتم إتقان أقطاب الجرافيت بشكل أسطواني وتصنيعها بمساحات ملولبة في كل طرف. بهذه الطريقة، يمكن تجميع أقطاب الجرافيت في عمود قطب كهربائي باستخدام حلمات القطب. لتلبية متطلبات التكلفة المنخفضة وكفاءة العمل العالية، أصبحت أفران القوس ذات الطاقة الفائقة ذات السعة الكبيرة أكثر شيوعًا. وبالتالي، من المتوقع أن تحتفظ أقطاب الجرافيت الفائقة الطاقة بالحصة الرئيسية في سوق أقطاب الجرافيت. كما من المتوقع أن يشهد القطاع أعلى معدل نمو سنوي مركب في سوق أقطاب الجرافيت.
رؤى قائمة على التطبيق
بناءً على التطبيق، يتم تقسيم سوق أقطاب الجرافيت إلى فرن القوس الكهربائي وفرن المغرفة وغيرها. ومن المتوقع أن ينمو قطاع فرن القوس الكهربائي بأعلى معدل نمو سنوي مركب خلال فترة التنبؤ. يعد قطب الجرافيت مكونًا لا غنى عنه لإنتاج الصلب من خلال طريقة فرن القوس الكهربائي (EAF) وتنقية الفولاذ بفرن المغرفة. تُستخدم أقطاب الجرافيت أيضًا لإنتاج المعادن الحديدية غير الفولاذية وسبائك الحديد والمعادن السليكونية والفوسفور الأصفر. يعد قطب الجرافيت مادة استهلاكية لا غنى عنها في إنتاج فولاذ فرن القوس الكهربائي، ولكنه مطلوب بكميات صغيرة جدًا؛ يحتاج طن واحد من إنتاج الصلب إلى حوالي 1.7 كجم فقط من قطب الجرافيت. يمتلك القطاع أكثر من 80٪ من إجمالي سوق أقطاب الجرافيت.
سوق أقطاب الجرافيت متماسكة للغاية مع وجود عدد معين فقط من اللاعبين الذين يهيمنون على سوق أقطاب الجرافيت. فيما يلي بعض التطورات الأخيرة في سوق أقطاب الجرافيت:
2020: أكملت شركتا توكاي كاربون وتوكاي كوبكس الاستحواذ على شركة كاربون سافوي إنترناشيونال إس إيه إس، وهي شركة مصنعة للكربون والجرافيت.
2020: وافق مجلس إدارة شركة جرافتيك إنترناشيونال المحدودة على إعادة شراء ما يصل إلى 100 مليون دولار من الأسهم العادية للشركة في عمليات شراء السوق المفتوحة.
2019: أكملت شركة شوا دينكو (SDK) الاستحواذ على جميع الأسهم في شركة إس جي إل جي إي القابضة المحدودة، وهي شركة لإنتاج أقطاب الجرافيت. بعد الاستحواذ، تغير اسم الشركة إلى شركة شوا دينكو كاربون القابضة المحدودة.
رؤى إقليمية حول سوق أقطاب الجرافيت
لقد قام المحللون في Insight Partners بشرح الاتجاهات والعوامل الإقليمية المؤثرة على سوق أقطاب الجرافيت طوال فترة التوقعات بشكل شامل. يناقش هذا القسم أيضًا قطاعات سوق أقطاب الجرافيت والجغرافيا في جميع أنحاء أمريكا الشمالية وأوروبا ومنطقة آسيا والمحيط الهادئ والشرق الأوسط وأفريقيا وأمريكا الجنوبية والوسطى.
- احصل على البيانات الإقليمية المحددة لسوق أقطاب الجرافيت
نطاق تقرير سوق أقطاب الجرافيت
| سمة التقرير | تفاصيل |
|---|---|
| حجم السوق في عام 2019 | 6.56 مليار دولار أمريكي |
| حجم السوق بحلول عام 2027 | 11.36 مليار دولار أمريكي |
| معدل النمو السنوي المركب العالمي (2019 - 2027) | 9.9% |
| البيانات التاريخية | 2017-2018 |
| فترة التنبؤ | 2020-2027 |
| القطاعات المغطاة |
حسب نوع المنتج
|
| المناطق والدول المغطاة |
أمريكا الشمالية
|
| قادة السوق وملفات تعريف الشركات الرئيسية |
|
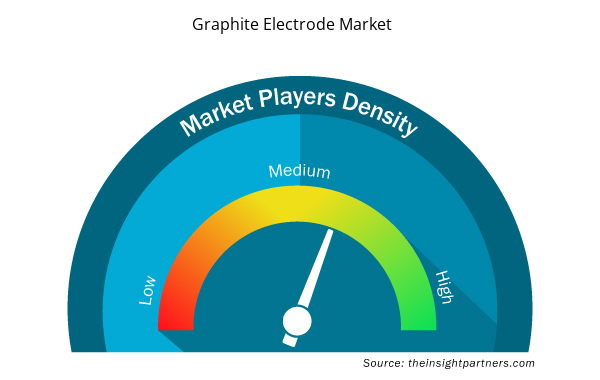
كثافة اللاعبين في سوق أقطاب الجرافيت: فهم تأثيرها على ديناميكيات الأعمال
يشهد سوق أقطاب الجرافيت نموًا سريعًا، مدفوعًا بالطلب المتزايد من المستخدم النهائي بسبب عوامل مثل تفضيلات المستهلكين المتطورة والتقدم التكنولوجي والوعي المتزايد بفوائد المنتج. ومع ارتفاع الطلب، تعمل الشركات على توسيع عروضها والابتكار لتلبية احتياجات المستهلكين والاستفادة من الاتجاهات الناشئة، مما يؤدي إلى زيادة نمو السوق.
تشير كثافة اللاعبين في السوق إلى توزيع الشركات أو المؤسسات العاملة في سوق أو صناعة معينة. وهي تشير إلى عدد المنافسين (اللاعبين في السوق) الموجودين في مساحة سوق معينة نسبة إلى حجمها أو قيمتها السوقية الإجمالية.
الشركات الرئيسية العاملة في سوق أقطاب الجرافيت هي:
- مجموعة إي بي إم
- شركة جرافتك الدولية المحدودة
- شركة جرافيت الهندية المحدودة
- شركة HEG المحدودة
- شركة كايفينج للكربون المحدودة
إخلاء المسؤولية : الشركات المذكورة أعلاه ليست مرتبة بأي ترتيب معين.
- احصل على نظرة عامة على أهم اللاعبين الرئيسيين في سوق أقطاب الجرافيت
تقسيم السوق
سوق أقطاب الجرافيت – حسب نوع المنتج
- قوة عالية
- طاقة عالية جدًا
- الطاقة العادية
سوق أقطاب الجرافيت – حسب التطبيق
- فرن القوس الكهربائي
- فرن المغرفة
- آحرون
سوق أقطاب الجرافيت حسب المنطقة
-
أمريكا الشمالية
- نحن
- كندا
- المكسيك
-
أوروبا
- فرنسا
- ألمانيا
- إيطاليا
- المملكة المتحدة
- روسيا
- بقية أوروبا
-
آسيا والمحيط الهادئ (APAC)
- الصين
- الهند
- كوريا الجنوبية
- اليابان
- أستراليا
- بقية منطقة آسيا والمحيط الهادئ
-
الشرق الأوسط وأفريقيا
- جنوب أفريقيا
- المملكة العربية السعودية
- الامارات العربية المتحدة
- باقي منطقة الشرق الأوسط وأفريقيا
-
أمريكا الجنوبية (SAM)
- البرازيل
- الأرجنتين
- بقية سام
الشركات المدرجة في سوق أقطاب الجرافيت هي كما يلي:
- مجموعة إي بي إم
- شركة جرافتيك الدولية المحدودة
- شركة جرافيت الهندية المحدودة
- شركة هيج المحدودة
- شركة كايفنغ للكربون المحدودة، مجموعة تشونج بينج للطاقة والمواد الكيميائية (KFCC)
- شركة نانتونغ يانغزي للكربون المحدودة
- شركة نيبون كاربون المحدودة
- سانجراف الدولية
- شووا دينكو كيه كيه
- شركة توكاي كاربون المحدودة

حابي محلل أبحاث سوق متمرس، يتمتع بخبرة 8 سنوات في قطاع الكيماويات والمواد، بالإضافة إلى خبرته في قطاعي الأغذية والمشروبات والسلع الاستهلاكية. وهو مهندس كيميائي من معهد فيشواكارما للتكنولوجيا (VIT)، وقد اكتسب معرفةً عميقةً في مجالات الكيماويات الصناعية والتخصصية، والدهانات والطلاءات، والورق والتغليف، ومواد التشحيم، والمنتجات الاستهلاكية.
تشمل كفاءات حابي الأساسية تقدير حجم السوق والتنبؤ به، ووضع معايير تنافسية، وتحليل الاتجاهات، والتفاعل مع العملاء، وكتابة التقارير، وتنسيق الفريق، مما يجعله بارعًا في تقديم رؤى عملية ودعم اتخاذ القرارات الاستراتيجية.
- التحليل التاريخي (سنتان)، سنة الأساس، التوقعات (7 سنوات) مع معدل النمو السنوي المركب
- تحليل PEST و SWOT
- حجم السوق والقيمة / الحجم - عالمي، إقليمي، بلد
- الصناعة والمنافسة
- مجموعة بيانات إكسل
التقارير الحديثة
شهادات العملاء
تقرير سوق أنظمة SCADA من Insight Partners شامل، ويقدم رؤى قيّمة حول الاتجاهات الحالية والتوقعات المستقبلية. تميّز الفريق باحترافية عالية وسرعة في الاستجابة ودعم مستمر طوال الوقت. نحن راضون جدًا ونوصي بشدة بخدماتهم.
ران كيديم شريك, شركة ريالي تكنولوجيز المحدودةطلبتُ تقريرًا عن سوق برمجيات محدد، وأعدّه الفريق في غضون أيام قليلة. كانت المعلومات ذات صلة وثيقة وعرضها جيد. ثم طلبتُ بعض التعديلات والإضافات على التقرير. وكان الفريق متجاوبًا للغاية، وحصلتُ على التقرير النهائي في أقل من أسبوع.
جان هيرفيه جين رئيس مجلس الإدارة, فيوتشر أناليتيكاعملنا مع شركة "إنسايت بارتنرز" لإجراء دراسة سوقية وتوقعات مهمة. زودونا برؤى واضحة حول الفرص والمخاطر، مما ساعدنا في صياغة خططنا. كانت أبحاثهم سهلة الاستخدام ومبنية على بيانات دقيقة، مما ساعدنا على اتخاذ قرارات ذكية وواثقة. نوصي بهم بشدة.
بيوش ناجبال نائب الرئيس الأول, شعاع عالي عالميقدّمت شركة Insight Partners أبحاثًا سوقية ثاقبة ومنظمة جيدًا بخبرة واسعة في هذا المجال. تميّز فريقهم بالاحترافية وسرعة الاستجابة طوال الوقت. وسهّل موقعهم الإلكتروني سهل الاستخدام الوصول إلى تقارير القطاع. نوصي بهم بشدة لخدمات بحثية موثوقة وعالية الجودة.
يوكيهيكو أداتشي المدير التنفيذي, ديب بلو، ذ.م.م.هذه أول مرة أشتري فيها تقرير سوق من The Insight Partners. رغم أنني كنت مترددًا في البداية، إلا أنني زرت موقعهم الإلكتروني وشعرت براحة أكبر للمخاطرة وشراء تقرير السوق. أنا راضٍ تمامًا عن جودة التقرير وخدمة العملاء. كانت لديّ عدة أسئلة وتعليقات حول التقرير الأولي، ولكن بعد بضع محادثات عبر البريد الإلكتروني مع محللهم، أعتقد أن لديّ تقريرًا يمكنني استخدامه كمدخل لعملية التخطيط الاستراتيجي لدينا. شكرًا جزيلاً لكم على تخصيص وقتكم الإضافي وجعل هذه التجربة إيجابية. سأوصي بخدماتكم للآخرين بالتأكيد، وستكونون أول من ألجأ إليه عندما نحتاج إلى المزيد من بيانات السوق.
جون سوزوكي الرئيس والرئيس التنفيذي وعضو مجلس الإدارة, بي كيه تكنولوجيزأود أن أقدّر دعمكم واحترافيتكم في الاستجابة لطلبي للحصول على معلومات بشأن سوق التشخيص المخبري للأمراض المعدية في نيجيريا. كما أُقدّر صبركم وتوجيهكم، واستعدادكم لتقديم خصم، مما مكّننا في النهاية من إتمام الصفقة. أتطلع إلى التعامل مع "ذا إنسايت بارتنرز" مستقبلًا، كل ذلك بفضل الانطباع الذي تركتموه لديّ نتيجةً لهذا اللقاء الأول.
الدكتور تشيجيوك أونيا المدير الإداري, شركة باينكريست للرعاية الصحية المحدودةسبب الشراء
- اتخاذ قرارات مدروسة
- فهم ديناميكيات السوق
- تحليل المنافسة
- رؤى العملاء
- توقعات السوق
- تخفيف المخاطر
- التخطيط الاستراتيجي
- مبررات الاستثمار
- تحديد الأسواق الناشئة
- تحسين استراتيجيات التسويق
- تعزيز الكفاءة التشغيلية
- مواكبة التوجهات التنظيمية


 احصل على عينة مجانية ل - سوق أقطاب الجرافيت