Marktstrategien für Graphitelektroden, Top-Player, Wachstumschancen, Analyse und Prognose bis 2027
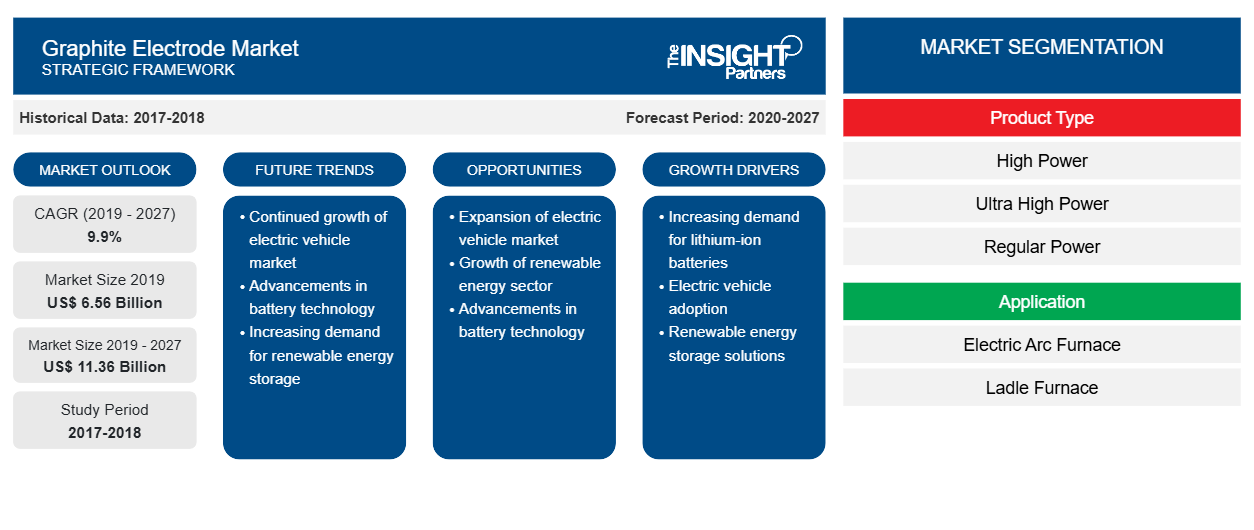
Historische Daten : 2017-2018 | Basisjahr : 2019 | Prognosezeitraum : 2020-2027Marktprognose für Graphitelektroden bis 2027 – Auswirkungen von COVID-19 und globale Analyse nach Produkttyp (Hochleistung, Ultrahochleistung, Normalleistung); Anwendung (Lichtbogenofen, Pfannenofen, Sonstige) und Geografie
- Status : Veröffentlicht
- Berichtscode : TIPRE00014019
- Kategorie : Chemikalien und Materialien
- Anzahl der Seiten : 142
- Verfügbare Berichtsformate :


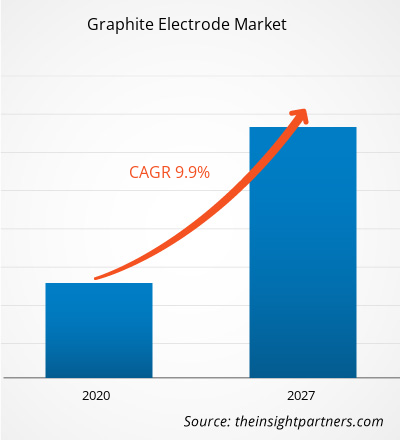
[Forschungsbericht] In Bezug auf den Umsatz wurde der Markt für Graphitelektroden im Jahr 2019 auf 6.564,2 Millionen US-Dollar geschätzt und soll bis 2027 11.356,4 Millionen US-Dollar erreichen, mit einer CAGR von 9,9 % von 2020 bis 2027.
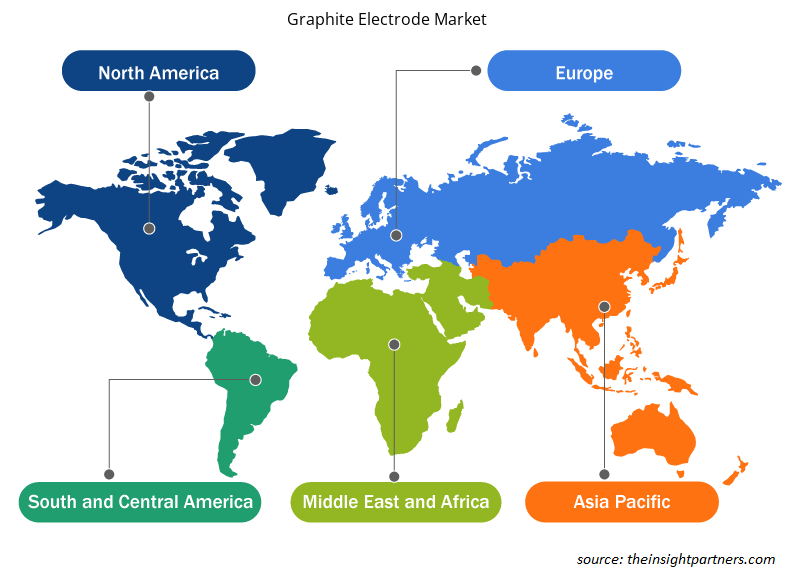
Der globale Markt für Graphitelektroden wird von der Region Asien-Pazifik dominiert, die zusammen etwa 58 % des globalen Marktes für Graphitelektroden ausmacht. Die hohe Nachfrage nach Graphitelektroden aus diesen Ländern ist auf den starken Anstieg der Rohstahlproduktion zurückzuführen. Laut der World Steel Association produzierten China und Japan im Jahr 2018 928,3 bzw. 104,3 Millionen Tonnen Rohstahl. In der Region Asien-Pazifik besteht aufgrund des steigenden Stahlschrottaufkommens und der Verbesserung der Stromversorgung in China eine erhebliche Nachfrage nach Lichtbogenöfen. Die wachsenden Marktstrategien verschiedener Unternehmen in der Region Asien-Pazifik fördern das Wachstum des Graphitelektrodenmarktes in der Region. So hat beispielsweise das japanische Unternehmen Tokai Carbon Co., Ltd. das Graphitelektrodengeschäft der SGL GE Holding GmbH (SGL GE) für 150 Millionen US-Dollar übernommen.
Die Regierungen wichtiger europäischer Länder haben verschiedene Initiativen ergriffen, um unter anderem ihre Fertigungsindustrie sowie die Elektronik- und Halbleiterindustrie voranzubringen. Europa hat seine industriellen Lösungen durch die Initiativen zur Industrie 4.0 deutlich verbessert. Die Europäische Kommission konzentriert sich auf die Erhöhung der Mittel für Forschung und Entwicklung, um die Wettbewerbsfähigkeit der Fertigungsindustrie und anderer Branchen der Region weltweit zu stärken. Die Nachfrage nach Graphitelektroden ist direkt mit der Stahlproduktion in Lichtbogenöfen verbunden, und die Region ist einer der wichtigsten Stahlproduzenten der Welt, wobei Russland der größte Produzent ist.
Passen Sie diesen Bericht Ihren Anforderungen an
Sie erhalten kostenlos individuelle Anpassungen an jedem Bericht, einschließlich Teilen dieses Berichts oder einer Analyse auf Länderebene, eines Excel-Datenpakets sowie tolle Angebote und Rabatte für Start-ups und Universitäten.
Graphitelektrodenmarkt: Strategische Einblicke
-
Holen Sie sich die wichtigsten Markttrends aus diesem Bericht.Dieses KOSTENLOSE Beispiel umfasst eine Datenanalyse von Markttrends bis hin zu Schätzungen und Prognosen.
Auswirkungen der COVID-19-Pandemie auf den Graphitelektrodenmarkt
Laut dem jüngsten Lagebericht der Weltgesundheitsorganisation (WHO) gehören die USA, Indien, Spanien, Italien, Frankreich, Deutschland, Großbritannien, Russland, die Türkei, Brasilien, der Iran und China zu den am schlimmsten vom COVID-19-Ausbruch betroffenen Ländern. Der Ausbruch begann im Dezember 2019 in Wuhan (China) und hat sich seitdem rasant über den Globus ausgebreitet. Die COVID-19-Krise wirkt sich auf die Industrie weltweit aus, und die Weltwirtschaft wird voraussichtlich im Jahr 2020 und wahrscheinlich auch im Jahr 2021 am stärksten betroffen sein. Der Ausbruch hat zu erheblichen Störungen in der Stahlindustrie geführt. Der starke Rückgang des internationalen Handels wirkt sich negativ auf das Wachstum der Graphitelektrode aus. Die Produktionsstillstände, Einschränkungen der Lieferkette, des Beschaffungsmanagements, der Arbeitskräftemangel und die Grenzschließungen zur Bekämpfung und Eindämmung des Ausbruchs haben sich negativ auf den Bausektor ausgewirkt. Der Produktionsrückgang in der Bauindustrie wirkt sich direkt auf die Einführung verschiedener Stahlprodukte aus und wirkt sich somit auf den Graphitelektrodenmarkt aus.
Markteinblicke
Der Wandel in der chinesischen Stahlindustrie unterstützt das Wachstum des Graphitelektrodenmarktes
In den Jahren 2016 und 2017 war die chinesische Stahlindustrie geprägt von einer politisch motivierten Zurückweisung des IF-Potenzials, da die Regierung versuchte, ein Überangebot im Inland zu erreichen. Laut worldsteel.org erreichte der Verbrauch von Stahlschrott in EAF- und Sauerstoffblasstahlwerken (BOF) einen Rekordwert von über 200 Millionen Tonnen pro Jahr. In der Zwischenzeit hat Chinas EAF-Kapazität einen neuen Höchststand von 130 Millionen Tonnen pro Jahr überschritten, da staatliche Vorschriften die Erzeugung durch integrierte Werke in Schlüsselbereichen einschränken und ihren energischen Ersatz durch EAF-Kapazitäten fördern. Dies hat zur Produktion von EAF-Stahl geführt und damit das Wachstum des Marktes für Graphitelektroden gefördert.
Produkttypbasierte Einblicke
In Bezug auf den Produkttyp eroberte das Ultrahochleistungssegment 2019 den größten Anteil des globalen Graphitelektrodenmarktes. Ultrahochleistungsgraphitelektroden werden zum Recycling von Stahl in der Elektrolichtbogenofenindustrie (EAF) verwendet. Ihr Hauptbestandteil ist hochwertiger Nadelkoks, der entweder aus Erdöl oder Kohlenteer hergestellt wird. Graphitelektroden werden in Zylinderform gefertigt und mit Gewinden an jedem Ende versehen. Auf diese Weise können die Graphitelektroden mithilfe von Elektrodennippeln zu einer Elektrodensäule zusammengebaut werden. Um den Anforderungen an niedrigere Kosten und höhere Arbeitseffizienz gerecht zu werden, werden Ultrahochleistungslichtbogenöfen mit großer Kapazität immer beliebter. Daher wird erwartet, dass Ultrahochleistungsgraphitelektroden den größten Anteil des Graphitelektrodenmarktes halten werden. Außerdem wird erwartet, dass das Segment das höchste CAGR-Wachstum auf dem Graphitelektrodenmarkt verzeichnen wird.
Anwendungsbasierte Erkenntnisse
Basierend auf der Anwendung ist der Graphitelektrodenmarkt in Lichtbogenöfen, Pfannenöfen und andere unterteilt. Das Segment der Lichtbogenöfen wird im Prognosezeitraum voraussichtlich die höchste durchschnittliche jährliche Wachstumsrate aufweisen. Graphitelektroden sind ein unverzichtbarer Bestandteil der Stahlproduktion im Lichtbogenofenverfahren (EAF) und der Stahlreinigung im Pfannenofen. Graphitelektroden werden auch für die Produktion von nicht stählernen Eisenmetallen, Ferrolegierungen, Siliziummetallen und gelbem Phosphor verwendet. Graphitelektroden sind ein unverzichtbares Verbrauchsmaterial bei der EAF-Stahlproduktion, werden jedoch in sehr geringen Mengen benötigt; für eine Tonne Stahlproduktion werden nur ca. 1,7 kg Graphitelektroden benötigt. Das Segment hält einen Anteil von über 80 % am gesamten Graphitelektrodenmarkt.
Der Markt für Graphitelektroden ist stark konsolidiert, wobei nur eine bestimmte Anzahl von Akteuren den Graphitelektrodenmarkt dominiert. Nachfolgend sind einige der jüngsten Entwicklungen auf dem Graphitelektrodenmarkt aufgeführt:
2020: Tokai Carbon und Tokai COBEX haben die Übernahme von Carbone Savoie International SAS, einem Kohlenstoff- und Graphithersteller, abgeschlossen.
2020: Der Vorstand von GrafTech International Ltd. genehmigte den Rückkauf von bis zu 100 Millionen US-Dollar der Stammaktien des Unternehmens im Rahmen von Käufen am freien Markt.
2019: Showa Denko (SDK) hat die Übernahme aller Anteile an SGL GE Holding GmbH, einem Unternehmen zur Herstellung von Graphitelektroden, abgeschlossen. Nach der Übernahme wurde der Name des Unternehmens in SHOWA DENKO CARBON Holding GmbH geändert.
Regionale Einblicke in den Graphitelektrodenmarkt
Die regionalen Trends und Faktoren, die den Graphitelektrodenmarkt während des Prognosezeitraums beeinflussen, wurden von den Analysten von Insight Partners ausführlich erläutert. In diesem Abschnitt werden auch Graphitelektrodenmarktsegmente und -geografie in Nordamerika, Europa, im asiatisch-pazifischen Raum, im Nahen Osten und Afrika sowie in Süd- und Mittelamerika erörtert.
- Erhalten Sie regionale Daten zum Graphitelektrodenmarkt
Umfang des Marktberichts über Graphitelektroden
| Berichtsattribut | Details |
|---|---|
| Marktgröße im Jahr 2019 | 6,56 Milliarden US-Dollar |
| Marktgröße bis 2027 | 11,36 Milliarden US-Dollar |
| Globale CAGR (2019 - 2027) | 9,9 % |
| Historische Daten | 2017-2018 |
| Prognosezeitraum | 2020–2027 |
| Abgedeckte Segmente |
Nach Produkttyp
|
| Abgedeckte Regionen und Länder |
Nordamerika
|
| Marktführer und wichtige Unternehmensprofile |
|
Marktteilnehmerdichte für Graphitelektroden: Auswirkungen auf die Geschäftsdynamik verstehen
Der Markt für Graphitelektroden wächst rasant, angetrieben durch die steigende Nachfrage der Endverbraucher aufgrund von Faktoren wie sich entwickelnden Verbraucherpräferenzen, technologischen Fortschritten und einem größeren Bewusstsein für die Vorteile des Produkts. Mit steigender Nachfrage erweitern Unternehmen ihr Angebot, entwickeln Innovationen, um die Bedürfnisse der Verbraucher zu erfüllen, und nutzen neue Trends, was das Marktwachstum weiter ankurbelt.
Die Marktteilnehmerdichte bezieht sich auf die Verteilung der Firmen oder Unternehmen, die in einem bestimmten Markt oder einer bestimmten Branche tätig sind. Sie gibt an, wie viele Wettbewerber (Marktteilnehmer) in einem bestimmten Marktraum im Verhältnis zu seiner Größe oder seinem gesamten Marktwert präsent sind.
Die wichtigsten auf dem Graphitelektrodenmarkt tätigen Unternehmen sind:
- EPM-Gruppe
- GRAFTECH INTERNATIONAL LTD
- Graphite India Limited
- HEG Limited
- Kaifeng Carbon Co., Ltd
Haftungsausschluss : Die oben aufgeführten Unternehmen sind nicht in einer bestimmten Reihenfolge aufgeführt.
- Überblick über die wichtigsten Akteure auf dem Graphitelektrodenmarkt
Marktsegmentierung
Graphitelektrodenmarkt – nach Produkttyp
- Hohe Leistung
- Ultrahohe Leistung
- Normale Leistung
Graphitelektrodenmarkt – nach Anwendung
- Lichtbogenofen
- Pfannenofen
- Sonstiges
Graphitelektrodenmarkt nach Regionen
-
Nordamerika
- UNS
- Kanada
- Mexiko
-
Europa
- Frankreich
- Deutschland
- Italien
- Vereinigtes Königreich
- Russland
- Restliches Europa
-
Asien-Pazifik (APAC)
- China
- Indien
- Südkorea
- Japan
- Australien
- Restlicher Asien-Pazifik-Raum
-
Naher Osten und Afrika (MEA)
- Südafrika
- Saudi-Arabien
- Vereinigte Arabische Emirate
- Rest von MEA
-
Südamerika (SAM)
- Brasilien
- Argentinien
- Rest von SAM
Auf dem Markt für Graphitelektroden werden folgende Unternehmen profiliert:
- EPM-Gruppe
- GrafTech International Ltd
- Graphite India Limited
- HEG GmbH
- Kaifeng Carbon Co., Ltd., Zhongping Energie- und Chemiegruppe (KFCC)
- Nantong Yangzi Carbon Co., Ltd.
- Nippon Carbon Co Ltd.
- Sangraf International
- SHOWA DENKO KK
- Tokai Carbon Co., Ltd.

- Historische Analyse (2 Jahre), Basisjahr, Prognose (7 Jahre) mit CAGR
- PEST- und SWOT-Analyse
- Marktgröße Wert/Volumen – Global, Regional, Land
- Branchen- und Wettbewerbslandschaft
- Excel-Datensatz
Erfahrungsberichte
Der SCADA-Systemmarktbericht von Insight Partners ist umfassend und bietet wertvolle Einblicke in aktuelle Trends und Zukunftsprognosen. Das Team war durchweg hochprofessionell, reaktionsschnell und hilfsbereit. Wir sind sehr zufrieden und können die Dienstleistungen wärmstens empfehlen.
RAN KEDEM Partner, Reali Technologies LTDsIch habe einen Bericht über einen sehr spezifischen Softwaremarkt angefordert, und das Team hat ihn innerhalb weniger Tage erstellt. Die Informationen waren sehr relevant und gut präsentiert. Anschließend habe ich einige Änderungen und Ergänzungen zum Bericht angefordert. Das Team reagierte erneut sehr schnell, und ich erhielt den Abschlussbericht in weniger als einer Woche.
JEAN-HERVE JENN Vorsitzende, Future AnalyticaWir haben mit The Insight Partners für eine wichtige Marktstudie und Prognose zusammengearbeitet. Sie gaben uns klare Einblicke in Chancen und Risiken, die uns bei der Gestaltung unserer Pläne halfen. Ihre Recherchen waren benutzerfreundlich und basierten auf soliden Daten. Sie halfen uns, kluge und sichere Entscheidungen zu treffen. Wir können sie wärmstens empfehlen.
PIYUSH NAGPAL Sr. Vizepräsident, Fernlicht GlobalDie Insight Partners lieferten aufschlussreiche, gut strukturierte Marktforschung mit fundierter Fachkompetenz. Ihr Team war durchweg professionell und reaktionsschnell. Die benutzerfreundliche Website ermöglichte den Zugriff auf Branchenberichte. Wir empfehlen sie wärmstens für zuverlässige und hochwertige Forschungsdienstleistungen.
YUKIHIKO ADACHI Geschäftsführer, Deep Blue, LLC.Dies ist das erste Mal, dass ich einen Marktbericht von The Insight Partners erworben habe. Obwohl ich zunächst unsicher war, besuchte ich die Website und fühlte mich dann sicherer, das Risiko einzugehen und einen Marktbericht zu kaufen. Ich bin mit der Qualität des Berichts und dem Kundenservice rundum zufrieden. Ich hatte einige Fragen und Anmerkungen zum ersten Bericht, aber nach einigen E-Mail-Gesprächen mit dem Analysten bin ich überzeugt, dass ich einen Bericht habe, den ich als Input für unseren strategischen Planungsprozess verwenden kann. Vielen Dank, dass Sie sich die Zeit genommen und dies zu einer positiven Erfahrung gemacht haben. Ich werde Ihren Service auf jeden Fall weiterempfehlen und Sie werden meine erste Anlaufstelle sein, wenn wir weitere Marktdaten benötigen.
JOHN SUZUKI Präsident und Chief Executive Officer, Vorstandsmitglied, BK TechnologiesIch möchte mich für Ihre Unterstützung und die Professionalität bedanken, die Sie bei der Bearbeitung meiner Informationsanfrage zum IVD-Markt für Infektionskrankheiten in Nigeria gezeigt haben. Ich schätze Ihre Geduld, Ihre Beratung und die Tatsache, dass Sie bereit waren, einen Rabatt anzubieten, der uns schließlich den Abschluss eines Geschäfts ermöglichte. Ich freue mich darauf, The Insight Partners in Zukunft wieder zu beauftragen, dank des Eindrucks, den Sie bei dieser ersten Begegnung bei mir hinterlassen haben.
DR. CHIJIOKE ONYIA GESCHÄFTSFÜHRERIN, PineCrest Healthcare Ltd.Grund zum Kauf
- Fundierte Entscheidungsfindung
- Marktdynamik verstehen
- Wettbewerbsanalyse
- Kundeneinblicke
- Marktprognosen
- Risikominimierung
- Strategische Planung
- Investitionsbegründung
- Identifizierung neuer Märkte
- Verbesserung von Marketingstrategien
- Steigerung der Betriebseffizienz
- Anpassung an regulatorische Trends


Exklusive Berichtsrabatte freischalten
Jetzt anfragen


 Kostenlose Probe anfordern für - Markt für Graphitelektroden