استراتيجيات سوق التصوير الشعاعي الصناعي، وأفضل اللاعبين، وفرص النمو، والتحليل والتنبؤ بحلول عام 2031
البيانات التاريخية : 2021-2022 | سنة الأساس : 2023 | فترة التنبؤ : 2024-2031حجم سوق التصوير بالأشعة الصناعية وتوقعاته (2021-2031)، والحصة العالمية والإقليمية، والاتجاهات، وفرص النمو. يغطي التقرير: حسب التقنية (التصوير بالأشعة السينية والتصوير بالأشعة السينية الرقمي)؛ وقطاعات المستخدمين النهائيين (التصنيع، والفضاء، والسيارات والنقل، وتوليد الطاقة، والبتروكيماويات والغاز، وغيرها)، والجغرافيا.
- تاريخ التقرير : Feb 2026
- رمز التقرير : TIPRE00003160
- الفئة : الإلكترونيات وأشباه الموصلات
- الحالة : البيانات الصادرة
- تنسيقات التقارير المتاحة :


- عدد الصفحات : 150
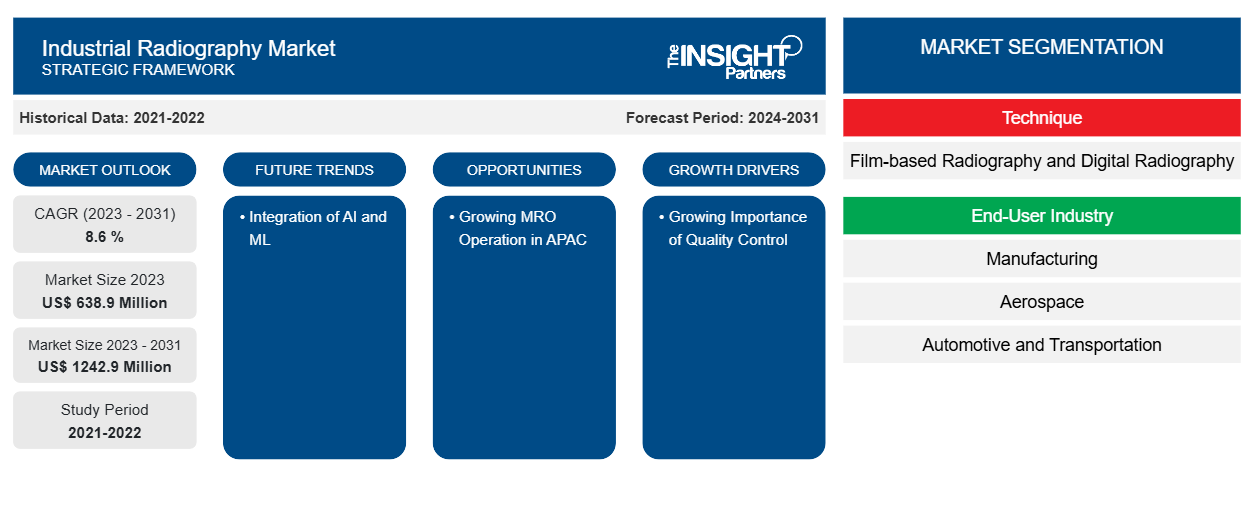
من المتوقع أن يصل حجم سوق التصوير الشعاعي الصناعي إلى 1242.9 مليون دولار أمريكي بحلول عام 2031 من 638.9 مليون دولار أمريكي في عام 2023. ومن المتوقع أن يسجل السوق معدل نمو سنوي مركب بنسبة 8.6٪ خلال الفترة 2023-2031. ومن المرجح أن يظل دمج الذكاء الاصطناعي والتعلم الآلي اتجاهًا رئيسيًا في السوق.
تحليل سوق التصوير بالأشعة الصناعية
في التصوير بالأشعة الصناعية، يقوم المفتشون بتحليل البنية الداخلية للمواد والمكونات باستخدام الإشعاع المؤين مثل الأشعة السينية أو أشعة جاما. وهذا يسمح للمرء بالكشف عن العيوب الخفية وقياس السُمك والتحقق من سلامة الإنشاءات المختلفة دون التسبب في أي ضرر. علاوة على ذلك، فإن زيادة الصيانة والإصلاح والعمليات تدفع نمو السوق.
نظرة عامة على سوق التصوير بالأشعة الصناعية
التصوير الصناعي بالأشعة السينية هو أحد أساليب الاختبار غير المدمرة التي تستخدم الإشعاع المؤين لفحص المواد والمكونات بغرض اكتشاف وقياس العيوب والتدهور في جودة المواد التي قد تتسبب في انهيار الهياكل الهندسية. يستخدم المصنعون التصوير الصناعي بالأشعة السينية للكشف عن الكسور أو العيوب في المواد. يستخدم التصوير الصناعي في الغالب الأشعة السينية وأشعة جاما للكشف عن العيوب التي لا يمكن ملاحظتها بالعين المجردة. التصوير الصناعي بالأشعة السينية هو نوع غير مدمر من الاختبارات الفيزيائية. يستخدم هذا الشكل من التصوير بالأشعة السينية الإشعاع المؤين المنبعث من مصدر مشع في ظل ظروف منظمة للكشف عن أو تحديد البنية الداخلية لجسم ما دون التسبب في أي ضرر لمورفولوجيته الخارجية. ونتيجة لذلك، يمكن استخدامه للحصول على فهم واضح لمكونات أو مكونات الشيء أو المنتج قيد الدراسة.
قم بتخصيص هذا التقرير ليناسب متطلباتك
ستحصل على تخصيص لأي تقرير - مجانًا - بما في ذلك أجزاء من هذا التقرير، أو تحليل على مستوى الدولة، وحزمة بيانات Excel، بالإضافة إلى الاستفادة من العروض والخصومات الرائعة للشركات الناشئة والجامعات
سوق التصوير بالأشعة الصناعية: رؤى استراتيجية
-
احصل على أهم اتجاهات السوق الرئيسية لهذا التقرير.ستتضمن هذه العينة المجانية تحليلاً للبيانات، بدءًا من اتجاهات السوق وحتى التقديرات والتوقعات.
محركات وفرص سوق التصوير بالأشعة الصناعية
الأهمية المتزايدة لمراقبة الجودة لصالح السوق
يقوم مفتشو مراقبة الجودة في التصوير الصناعي بتقييم الجودة الشاملة للصور الشعاعية وطرق التفتيش. وهم يضمنون أن عمليات التفتيش تلبي معايير الصناعة وأن المعدات تعمل بشكل صحيح. يستخدم التصوير الصناعي في المقام الأول للكشف عن العيوب الداخلية في المواد والهياكل، مثل الشقوق والفراغات والشوائب وانقطاعات الاستمرارية. وهو يضمن سلامة وسلامة العديد من مكونات النظام. يستخدم التصوير الصناعي لتقييم المواد مثل المعادن والبوليمرات والمركبات والسيراميك. يتم فحص اللحامات وخطوط الأنابيب والمسبوكات والمطروقات ومكونات الطيران وغيرها من العناصر بشكل شائع.
تزايد عمليات الصيانة والإصلاح والعمرة في منطقة آسيا والمحيط الهادئ
من المتوقع أن يتوسع الطلب على الصيانة والإصلاح والعمرة في الهند بشكل أسرع من المتوسط العالمي، مما يخلق فرصًا للمستثمرين المحليين والأجانب ومصنعي المعدات الأصلية وكبرى شركات الصيانة والإصلاح والعمرة. قد يشارك المستثمرون المحليون والأجانب. علاوة على ذلك، فإن موطن أكبر قاعدة للصيانة والإصلاح والعمرة في آسيا والتركيز العالي لصناعة الطيران ووجود لاعبين كبار في الصناعة مثل رولز رويس وإيرباص هي أسباب نمو عمليات الصيانة والإصلاح والعمرة في آسيا. تعد الصيانة والإصلاح والعمرة مكونًا حيويًا للعديد من الصناعات. تستخدم الصناعات التالية بشكل كبير ممارسات الصيانة والإصلاح والعمرة: تعتمد شركات التصنيع بشكل كبير على أنشطة الصيانة والإصلاح لمعدات التصنيع والآلات والأدوات. ويشمل ذلك السيارات والطائرات والإلكترونيات والسلع الاستهلاكية وغيرها من الصناعات. تعتمد أعمال النقل، التي تشمل شركات الطيران والقطارات والشحن والخدمات اللوجستية، على تقنيات الصيانة والإصلاح والعمرة للحفاظ على أساطيل السيارات والطائرات والقاطرات وحاويات الشحن.
تقرير تحليل تجزئة سوق التصوير بالأشعة الصناعية
إن القطاعات الرئيسية التي ساهمت في اشتقاق تحليل سوق التصوير الشعاعي الصناعي هي صناعة التقنية والمستخدم النهائي.
- اعتمادًا على التقنية، يتم تقسيم سوق التصوير الشعاعي الصناعي إلى التصوير الشعاعي المعتمد على الفيلم والتصوير الشعاعي الرقمي.
- استنادًا إلى صناعة المستخدم النهائي، يتم تقسيم سوق التصوير الشعاعي الصناعي إلى التصنيع، والفضاء، والسيارات والنقل، وتوليد الطاقة، والبتروكيماويات والغاز، وغيرها.
تحليل حصة سوق التصوير بالأشعة الصناعية حسب المنطقة الجغرافية
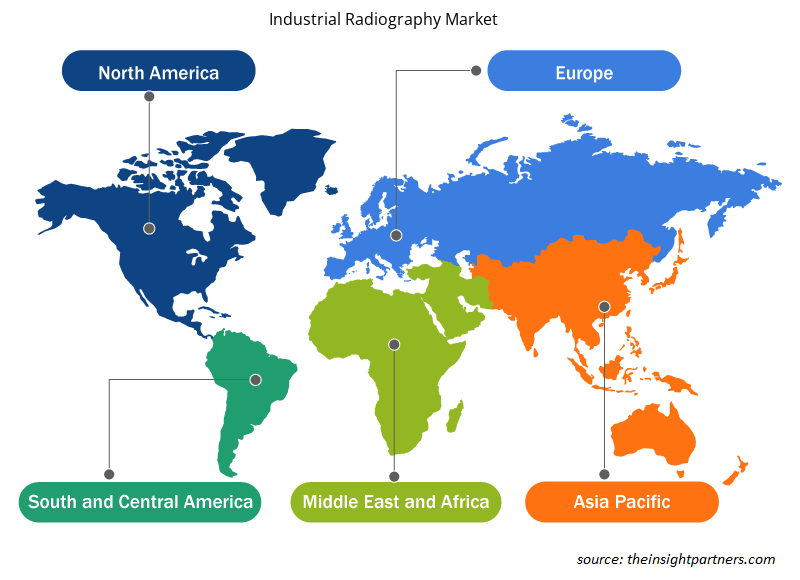
ينقسم النطاق الجغرافي لتقرير سوق التصوير الشعاعي الصناعي بشكل أساسي إلى خمس مناطق: أمريكا الشمالية، ومنطقة آسيا والمحيط الهادئ، وأوروبا، والشرق الأوسط وأفريقيا، وأمريكا الجنوبية والوسطى. ينقسم سوق التصوير الشعاعي الصناعي في أمريكا الشمالية إلى الولايات المتحدة وكندا والمكسيك. طورت أمريكا الشمالية صناعة الطيران والدفاع والأرصاد الجوية وإنتاج المركبات الآلية. تضم المنطقة العديد من شركات تصنيع السيارات الشهيرة مثل فورد وهونا وتويوتا وتيسلا وغيرها. الهدف الأساسي للتصوير الشعاعي الصناعي هو الكشف عن العيوب الداخلية في المواد والهياكل مثل الشقوق والفراغات والشوائب وانقطاعات الاستمرارية. يستخدمه المصنعون للكشف عن الشقوق أو العيوب في المنتجات.
رؤى إقليمية حول سوق التصوير بالأشعة الصناعية
لقد قام المحللون في Insight Partners بشرح الاتجاهات والعوامل الإقليمية المؤثرة على سوق التصوير بالأشعة الصناعية طوال فترة التوقعات بشكل شامل. يناقش هذا القسم أيضًا قطاعات سوق التصوير بالأشعة الصناعية والجغرافيا في جميع أنحاء أمريكا الشمالية وأوروبا ومنطقة آسيا والمحيط الهادئ والشرق الأوسط وأفريقيا وأمريكا الجنوبية والوسطى.
- احصل على البيانات الإقليمية المحددة لسوق التصوير بالأشعة الصناعية
نطاق تقرير سوق التصوير بالأشعة الصناعية
| سمة التقرير | تفاصيل |
|---|---|
| حجم السوق في عام 2023 | 638.9 مليون دولار أمريكي |
| حجم السوق بحلول عام 2031 | 1242.9 مليون دولار أمريكي |
| معدل النمو السنوي المركب العالمي (2023 - 2031) | 8.6% |
| البيانات التاريخية | 2021-2022 |
| فترة التنبؤ | 2024-2031 |
| القطاعات المغطاة |
حسب التقنية
|
| المناطق والدول المغطاة |
أمريكا الشمالية
|
| قادة السوق وملفات تعريف الشركات الرئيسية |
|
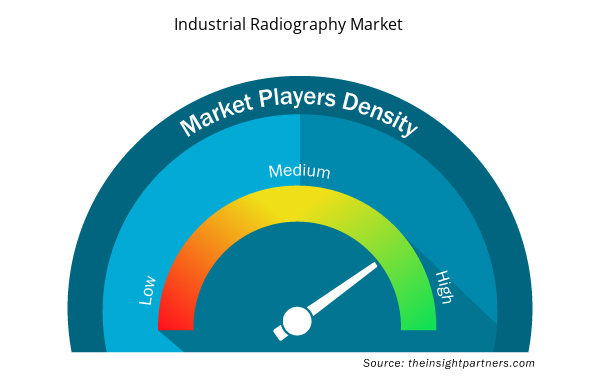
كثافة اللاعبين في السوق: فهم تأثيرها على ديناميكيات الأعمال
يشهد سوق التصوير بالأشعة الصناعية نموًا سريعًا، مدفوعًا بالطلب المتزايد من المستخدم النهائي بسبب عوامل مثل تفضيلات المستهلكين المتطورة والتقدم التكنولوجي والوعي المتزايد بفوائد المنتج. ومع ارتفاع الطلب، تعمل الشركات على توسيع عروضها والابتكار لتلبية احتياجات المستهلكين والاستفادة من الاتجاهات الناشئة، مما يؤدي إلى زيادة نمو السوق.
تشير كثافة اللاعبين في السوق إلى توزيع الشركات أو المؤسسات العاملة في سوق أو صناعة معينة. وهي تشير إلى عدد المنافسين (اللاعبين في السوق) الموجودين في مساحة سوق معينة نسبة إلى حجمها أو قيمتها السوقية الإجمالية.
الشركات الرئيسية العاملة في سوق التصوير الإشعاعي الصناعي هي:
- الأشعة السينية ثلاثية الأبعاد
- أنريتسو
- مجموعة المذنب
- شركة فوجي فيلم
- جنرال اليكتريك
- ميتلر توليدو
إخلاء المسؤولية : الشركات المذكورة أعلاه ليست مرتبة بأي ترتيب معين.
- احصل على نظرة عامة على أهم اللاعبين الرئيسيين في سوق التصوير بالأشعة الصناعية
أخبار سوق التصوير بالأشعة الصناعية والتطورات الأخيرة
يتم تقييم سوق التصوير الصناعي بالأشعة من خلال جمع البيانات النوعية والكمية بعد البحث الأولي والثانوي، والذي يتضمن منشورات الشركات المهمة وبيانات الجمعيات وقواعد البيانات. فيما يلي بعض التطورات في سوق التصوير الصناعي بالأشعة:
- منحت القوات الجوية الملكية البريطانية شركة 3DX-Ray عقدًا لتوريد ثلاثة أنظمة مسح بالأشعة السينية المحمولة ThreatScan-LSC. ستحل أنظمة ThreatScan-LSC محل الأنظمة الحالية، وهذا هو أول عقد تبرمه شركة 3DX-Ray مع القوات الجوية الملكية البريطانية.
(المصدر: 3DX-RAY، يناير 2021)
- قدمت شركة Teledyne Industrial X-Ray Solutions، وهي شركة تقدم خدمات التصوير بالأشعة السينية عالية الأداء، خط إنتاج جديد من أجهزة الكشف الديناميكية الصناعية عالية السرعة وعالية الأداء استنادًا إلى تقنية مستشعر IGZO المبتكرة المقاومة للإشعاع. تم تصميم أجهزة الكشف Rad-Xcam 1717 و1723 و3030 لتلبية الاحتياجات الصعبة للتطبيقات الطبية الحيوية والعلمية والتفتيش الصناعي، مما يوفر مزايا تكلفة تكامل مقنعة. (المصدر: Teledyne، يوليو 2023)
تغطية تقرير سوق التصوير بالأشعة الصناعية والمنتجات النهائية
يوفر تقرير "حجم سوق التصوير بالأشعة الصناعية والتوقعات (2021-2031)" تحليلاً مفصلاً للسوق يغطي المجالات التالية:
- حجم سوق التصوير الشعاعي الصناعي وتوقعاته على المستويات العالمية والإقليمية والوطنية لجميع قطاعات السوق الرئيسية التي يغطيها النطاق
- اتجاهات سوق التصوير الشعاعي الصناعي، بالإضافة إلى ديناميكيات السوق مثل المحركات والقيود والفرص الرئيسية
- تحليل مفصل لقوى PEST/Porter الخمس وSWOT
- تحليل سوق التصوير الشعاعي الصناعي الذي يغطي اتجاهات السوق الرئيسية والإطار العالمي والإقليمي والجهات الفاعلة الرئيسية واللوائح والتطورات الأخيرة في السوق
- تحليل المشهد الصناعي والمنافسة الذي يغطي تركيز السوق، وتحليل خريطة الحرارة، واللاعبين البارزين، والتطورات الأخيرة في سوق التصوير الشعاعي الصناعي
- ملفات تعريف الشركة التفصيلية

نافين خبيرٌ متمرسٌ في أبحاث السوق والاستشارات، يتمتع بخبرةٍ تزيد عن 9 سنوات في مشاريع مُخصصة ومُشتركة واستشارية. يشغل حاليًا منصب نائب الرئيس المساعد، وقد نجح في إدارة أصحاب المصلحة عبر سلسلة قيمة المشاريع، وألّف أكثر من 100 تقرير بحثي وأكثر من 30 مهمة استشارية. يمتد نطاق عمله ليشمل مشاريع صناعية وحكومية، مساهمًا بشكل كبير في نجاح العملاء واتخاذ القرارات القائمة على البيانات.
نافين حاصلٌ على شهادة في هندسة الإلكترونيات والاتصالات من جامعة فرجينيا التقنية، كارناتاكا، وشهادة ماجستير في إدارة الأعمال في التسويق والعمليات من جامعة مانيبال. وهو عضوٌ نشطٌ في معهد مهندسي الكهرباء والإلكترونيات (IEEE) لمدة 9 سنوات، حيث شارك في مؤتمراتٍ وندواتٍ تقنية، وتطوّع على مستوى الأقسام والمناطق. قبل منصبه الحالي، عمل مستشارًا استراتيجيًا مساعدًا في IndustryARC، ومستشارًا للخوادم الصناعية في شركة هيوليت باكارد (HP Global).
- التحليل التاريخي (سنتان)، سنة الأساس، التوقعات (7 سنوات) مع معدل النمو السنوي المركب
- تحليل PEST و SWOT
- حجم السوق والقيمة / الحجم - عالمي، إقليمي، بلد
- الصناعة والمنافسة
- مجموعة بيانات إكسل
التقارير الحديثة
شهادات العملاء
تقرير سوق أنظمة SCADA من Insight Partners شامل، ويقدم رؤى قيّمة حول الاتجاهات الحالية والتوقعات المستقبلية. تميّز الفريق باحترافية عالية وسرعة في الاستجابة ودعم مستمر طوال الوقت. نحن راضون جدًا ونوصي بشدة بخدماتهم.
ران كيديم شريك, شركة ريالي تكنولوجيز المحدودةطلبتُ تقريرًا عن سوق برمجيات محدد، وأعدّه الفريق في غضون أيام قليلة. كانت المعلومات ذات صلة وثيقة وعرضها جيد. ثم طلبتُ بعض التعديلات والإضافات على التقرير. وكان الفريق متجاوبًا للغاية، وحصلتُ على التقرير النهائي في أقل من أسبوع.
جان هيرفيه جين رئيس مجلس الإدارة, فيوتشر أناليتيكاعملنا مع شركة "إنسايت بارتنرز" لإجراء دراسة سوقية وتوقعات مهمة. زودونا برؤى واضحة حول الفرص والمخاطر، مما ساعدنا في صياغة خططنا. كانت أبحاثهم سهلة الاستخدام ومبنية على بيانات دقيقة، مما ساعدنا على اتخاذ قرارات ذكية وواثقة. نوصي بهم بشدة.
بيوش ناجبال نائب الرئيس الأول, شعاع عالي عالميقدّمت شركة Insight Partners أبحاثًا سوقية ثاقبة ومنظمة جيدًا بخبرة واسعة في هذا المجال. تميّز فريقهم بالاحترافية وسرعة الاستجابة طوال الوقت. وسهّل موقعهم الإلكتروني سهل الاستخدام الوصول إلى تقارير القطاع. نوصي بهم بشدة لخدمات بحثية موثوقة وعالية الجودة.
يوكيهيكو أداتشي المدير التنفيذي, ديب بلو، ذ.م.م.هذه أول مرة أشتري فيها تقرير سوق من The Insight Partners. رغم أنني كنت مترددًا في البداية، إلا أنني زرت موقعهم الإلكتروني وشعرت براحة أكبر للمخاطرة وشراء تقرير السوق. أنا راضٍ تمامًا عن جودة التقرير وخدمة العملاء. كانت لديّ عدة أسئلة وتعليقات حول التقرير الأولي، ولكن بعد بضع محادثات عبر البريد الإلكتروني مع محللهم، أعتقد أن لديّ تقريرًا يمكنني استخدامه كمدخل لعملية التخطيط الاستراتيجي لدينا. شكرًا جزيلاً لكم على تخصيص وقتكم الإضافي وجعل هذه التجربة إيجابية. سأوصي بخدماتكم للآخرين بالتأكيد، وستكونون أول من ألجأ إليه عندما نحتاج إلى المزيد من بيانات السوق.
جون سوزوكي الرئيس والرئيس التنفيذي وعضو مجلس الإدارة, بي كيه تكنولوجيزأود أن أقدّر دعمكم واحترافيتكم في الاستجابة لطلبي للحصول على معلومات بشأن سوق التشخيص المخبري للأمراض المعدية في نيجيريا. كما أُقدّر صبركم وتوجيهكم، واستعدادكم لتقديم خصم، مما مكّننا في النهاية من إتمام الصفقة. أتطلع إلى التعامل مع "ذا إنسايت بارتنرز" مستقبلًا، كل ذلك بفضل الانطباع الذي تركتموه لديّ نتيجةً لهذا اللقاء الأول.
الدكتور تشيجيوك أونيا المدير الإداري, شركة باينكريست للرعاية الصحية المحدودةسبب الشراء
- اتخاذ قرارات مدروسة
- فهم ديناميكيات السوق
- تحليل المنافسة
- رؤى العملاء
- توقعات السوق
- تخفيف المخاطر
- التخطيط الاستراتيجي
- مبررات الاستثمار
- تحديد الأسواق الناشئة
- تحسين استراتيجيات التسويق
- تعزيز الكفاءة التشغيلية
- مواكبة التوجهات التنظيمية


 احصل على عينة مجانية ل - سوق التصوير الإشعاعي الصناعي