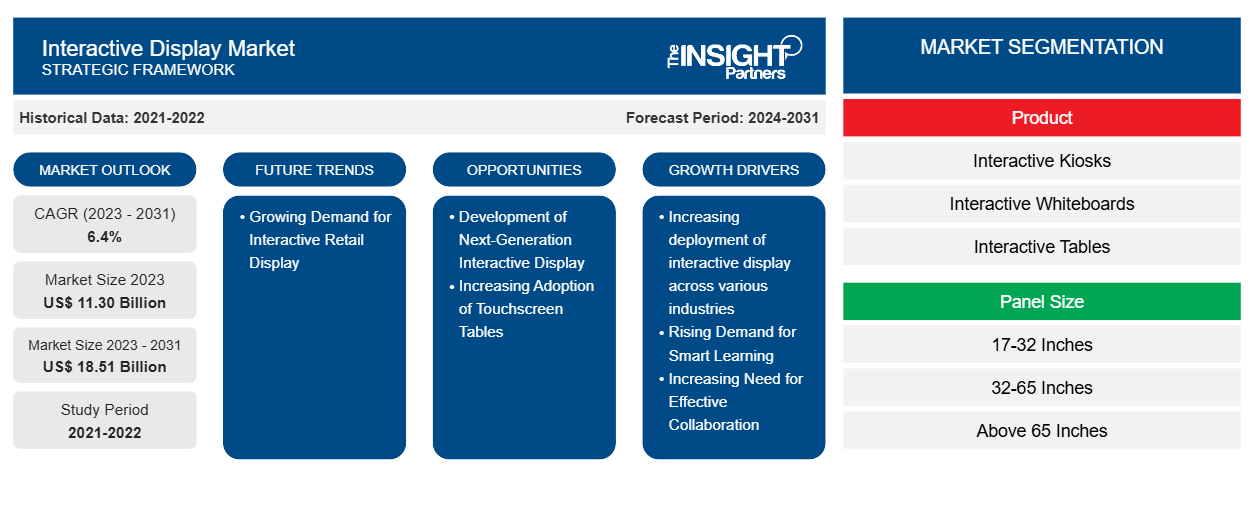
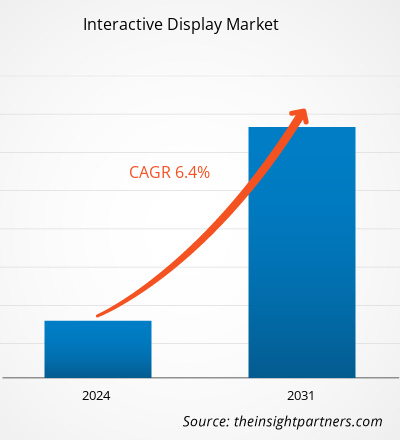
من المتوقع أن يصل حجم سوق شاشات العرض التفاعلية إلى 18.51 مليار دولار أمريكي بحلول عام 2031 من 11.30 مليار دولار أمريكي في عام 2023. ومن المتوقع أن يسجل السوق معدل نمو سنوي مركب بنسبة 6.4٪ خلال الفترة 2023-2031. ومن المتوقع أن يكون الطلب المتزايد على شاشات البيع بالتجزئة التفاعلية هو الاتجاه الرئيسي لسوق شاشات العرض التفاعلية خلال الفترة المتوقعة.
تحليل سوق شاشات العرض التفاعلية
من المتوقع أن تساهم التطبيقات المتزايدة للشاشات التفاعلية في نمو حجم سوق الشاشات التفاعلية . ومن المرجح أن يؤدي الاستثمار المتزايد في تقنيات الذكاء الاصطناعي وتوسع صناعات التعليم والخدمات المصرفية والمالية والتجزئة إلى دفع سوق الشاشات التفاعلية خلال فترة التنبؤ. علاوة على ذلك، من المتوقع أن يستفيد نمو سوق الشاشات التفاعلية من التبني المتزايد للتقنيات المتقدمة مثل الذكاء الاصطناعي ومنتجات الجيل التالي.
نظرة عامة على سوق شاشات العرض التفاعلية
الشاشة التفاعلية، والمعروفة أيضًا باسم شاشة اللمس التفاعلية، هي جهاز كبير مثبت على الحائط مع مدخل شاشة لمس رقمية يسمح للمستخدمين بإنشاء عروض تقديمية مرئية ومعالجة البيانات على الشاشة. الشاشة التفاعلية هي جهاز لوحي كبير يوفر فرصًا ديناميكية لكل من الطلاب والمعلمين من خلال توفير وصول مألوف إلى التعليمات. تُستخدم هذه الأجهزة بشكل شائع في الفصول الدراسية وغرف الاجتماعات وغيرها من البيئات التعاونية من خلال تعزيز المشاركة وتسهيل التعلم التفاعلي والتعاون بين المستخدمين. إن النمو المتنامي للرقمنة وتوسع العديد من الصناعات مثل التعليم وتجارة التجزئة والتجارة الإلكترونية والخدمات المصرفية والمالية والتأمين والترفيه يدفعان نمو سوق الشاشات التفاعلية.
قم بتخصيص هذا التقرير ليناسب متطلباتك
ستحصل على تخصيص لأي تقرير - مجانًا - بما في ذلك أجزاء من هذا التقرير، أو تحليل على مستوى الدولة، وحزمة بيانات Excel، بالإضافة إلى الاستفادة من العروض والخصومات الرائعة للشركات الناشئة والجامعات
سوق العرض التفاعلي:
- احصل على أهم اتجاهات السوق الرئيسية لهذا التقرير.ستتضمن هذه العينة المجانية تحليلاً للبيانات، بدءًا من اتجاهات السوق وحتى التقديرات والتوقعات.
محركات وفرص سوق العرض التفاعلي
زيادة نشر الشاشات التفاعلية في مختلف الصناعات لصالح السوق
تلعب الشاشات التفاعلية دورًا مهمًا في فهم احتياجات المستهلك ورغباته وما يفضله وما يكرهه. تساعد هذه الآلات الشركات على استخلاص رؤى قيمة وفهم سلوك الشراء لدى عملائها. يشارك كبار اللاعبين في السوق في تطوير منتجات مبتكرة أو إضافة ميزات إلى محافظهم الحالية، مثل تحسين الألوان والمساعدين الصوتيين. تدعم هذه الميزات الإضافية الشركات في جذب عملاء جدد في جميع أنحاء العالم. علاوة على ذلك، فإن الطلب المتزايد على الشاشات التفاعلية وتبنيها بين مختلف الصناعات مثل التعليم وتجارة التجزئة والخدمات المصرفية والمالية والتأمين والرعاية الصحية والنقل يغذي السوق. على سبيل المثال، في يناير 2023، قام مطار كوينزتاون بتحديث محطته من خلال تثبيت خدمة ذاتية للاستخدام المشترك (CUSS) لتعزيز تجربة الركاب في المطار. CUSS هو كشك مشترك يساعد المطار في عملية تسجيل وصول سهلة ويقلل من طوابير الانتظار. كما أدى النمو الرقمي والطلب المتزايد على منصات التعلم الرقمي بين المستهلكين إلى زيادة اعتماد الشاشات التفاعلية في صناعة التعليم. تسمح هذه اللوحات للمتعلمين بتصور المفاهيم وفهمها بسهولة. بالإضافة إلى ذلك، تسبب الوباء في تغيير كبير في صناعة التعليم، مما أدى إلى زيادة منصات التعلم الرقمي واستخدام لوحات العرض. يساعد تطور تقنية السبورة الذكية في صناعة التعليم الطلاب أو المتعلمين على الأداء الجيد وتحسين تعلمهم، وهو ما من المتوقع أن يحرك السوق بشكل عام في المستقبل القريب.
تطوير شاشات العرض التفاعلية من الجيل القادم
تعتمد الشركات بشكل كبير على التقنيات المتقدمة مثل الذكاء الاصطناعي وإنترنت الأشياء لتبسيط العمليات بشكل فعال وجذب عملاء جدد. تعمل تقنية الذكاء الاصطناعي على تعزيز العرض التفاعلي من خلال إضافة ميزات مهمة مثل توصيات المحتوى المخصصة والتعرف على الإيماءات وواجهات المستخدم التكيفية. يعمل هذا على تحسين تفاعل العملاء من خلال إنشاء تجارب ديناميكية وجذابة بناءً على السلوكيات والتفضيلات. يساعد دمج تقنية الذكاء الاصطناعي في الشاشات التفاعلية المستخدمين على تحليل البيانات للحصول على رؤى قيمة وتحسين تقديم المحتوى من خلال جعل الشاشات التفاعلية أكثر استجابة.
تتخذ شركات تصنيع الشاشات التفاعلية مبادرات مثل التعاون والشراكة لتطوير شاشات تفاعلية تعتمد على الذكاء الاصطناعي والجيل القادم من أجل دعم الصناعات، بما في ذلك تجارة التجزئة والتجارة الإلكترونية، والخدمات المصرفية والمالية والتأمين، والرعاية الصحية، والتعليم، مما يولد فرصًا كبيرة في السوق. على سبيل المثال:
- في يونيو 2023، دخلت شركة هيتاشي المحدودة في شراكة مع شركة إل جي إلكترونيكس لإطلاق شاشة جديدة تعمل بالذكاء الاصطناعي لصناعة التجزئة والتجارة الإلكترونية. تعمل الشركتان على تطوير لوحة تعمل باللمس مقاس 29 بوصة مزودة بالبنية التحتية البيومترية ومصادقة المفتاح العام، مع العديد من الميزات الإضافية مثل الكاميرا عالية الدقة وتقنية التعرف على الوجه ونظام مراقبة في الوقت الفعلي. تم تصميم الشاشة التفاعلية القائمة على الذكاء الاصطناعي لتلبية متطلبات مختلف العملاء من متاجر التجزئة والمطاعم والمكاتب والصالات الرياضية والقطاعات السكنية ومراكز المؤتمرات.
- في أكتوبر 2022، جمعت شركة OTI Lumionics تمويلًا بقيمة 55 مليون دولار أمريكي لتطوير مواد العرض لصانعي شاشات العرض التفاعلية. تسمح هذه المواد للمصنعين بإنشاء شاشات عرض كاملة بدون فتحات لأجهزة الاستشعار والمكونات. تعمل تقنية العرض على إحداث ثورة في صناعة الهواتف الذكية من خلال تغيير عمليات تصنيع الشاشات التفاعلية.
كما أن زيادة الاستثمارات في أنشطة البحث والتطوير لتطوير تقنيات جديدة تخلق فرصًا للاعبين في السوق. على سبيل المثال، في أكتوبر 2022، طور باحثون في المعهد الهندي للتكنولوجيا (IIT) في مدراس جهازًا جديدًا لتكنولوجيا العرض، وهو شاشة Touch Active التفاعلية (iTad). هذا الجهاز قادر على محاكاة القوام مثل الحواف الحادة والأسطح الخشنة. تحتوي تقنية العرض الجديدة هذه على مستشعر متعدد اللمس مدمج يستخدم للكشف عن حركة الإصبع من خلال برنامج يتحكم في المجالات الكهربائية عبر الالتصاق الكهربائي. وبالتالي، من المتوقع أن توفر الاستثمارات المتزايدة في البحث والتطوير لتطوير منتجات الجيل التالي فرصًا مربحة لسوق العرض التفاعلي خلال فترة التنبؤ.
تقرير تحليل تجزئة سوق العرض التفاعلي
إن القطاعات الرئيسية التي ساهمت في استخلاص تحليل سوق شاشات العرض التفاعلية هي المنتج وحجم اللوحة ونوع اللوحة والقطاع الرأسي للصناعة.
- بناءً على المنتج، يتم تقسيم سوق العرض التفاعلي إلى أكشاك تفاعلية ولوحات بيضاء تفاعلية وطاولات تفاعلية وجدران فيديو تفاعلية وشاشات تفاعلية. ومن المتوقع أن يحظى قطاع الأكشاك التفاعلية بحصة سوقية كبيرة للعرض التفاعلي بحلول عام 2030. إن النمو الرقمي المتزايد والانتشار المتزايد لشاشات العرض في مراكز التسوق ومتاجر التجزئة والفنادق والمدارس يدفع نمو قطاع الأكشاك التفاعلية.
- بناءً على حجم اللوحة، يتم تصنيف سوق العرض التفاعلي إلى 17-32 بوصة، و32-65 بوصة، وفوق 65 بوصة.
- على أساس نوع اللوحة، يتم تقسيم السوق إلى مسطحة ومرنة وشفافة.
- بناءً على القطاع الرأسي للصناعة، يتم تقسيم السوق إلى تجارة التجزئة والضيافة، والرعاية الصحية، والخدمات المصرفية والمالية والتأمين، والتعليم، والترفيه، وغيرها.
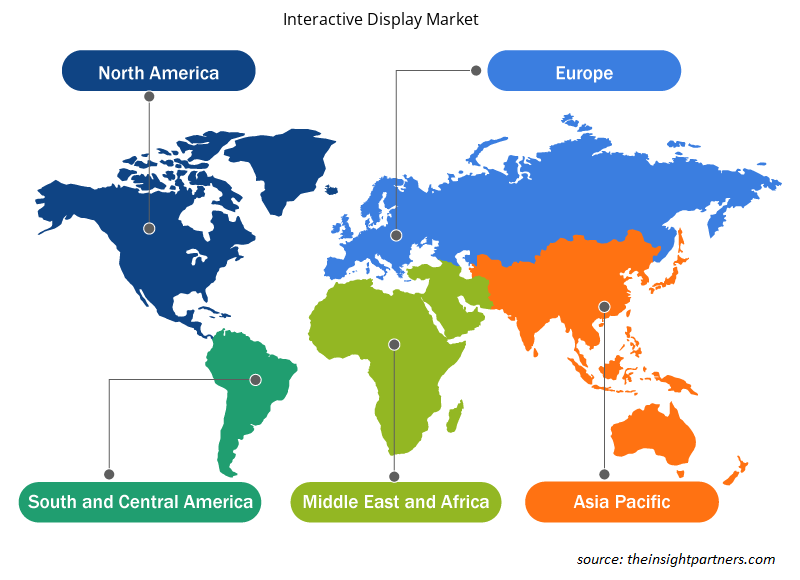
تحليل حصة سوق العرض التفاعلي حسب المنطقة الجغرافية
يتم تقسيم النطاق الجغرافي لتقرير سوق العرض التفاعلي بشكل أساسي إلى خمس مناطق: أمريكا الشمالية، ومنطقة آسيا والمحيط الهادئ، وأوروبا، والشرق الأوسط وأفريقيا، وأمريكا الجنوبية والوسطى.
سيطرت منطقة آسيا والمحيط الهادئ على سوق العرض التفاعلي في عام 2023، وذلك بسبب وجود لاعبين رئيسيين في السوق مثل Samsung Electronics Co Ltd وLG Electronics Inc وPanasonic Holdings Corp وSharp Electronics Corp وHitachi Ltd وBenQ Corporation وBOE Technology Group Co Ltd. يشارك هؤلاء اللاعبون في تطوير منتجات متقدمة لصناعات مختلفة. على سبيل المثال، في مايو 2023، أطلقت LG Electronics Inc. حل السبورة التفاعلية LG CreateBoard، وهو مثالي للفصول الدراسية الرقمية. تم دمج السبورة التفاعلية CreateBoard مع 40 نقطة متعددة اللمس توفر للمستخدم تجربة رسم وكتابة تفاعلية وسلسة. علاوة على ذلك، فإن الاستثمار المتزايد في قطاع التعليم والتقدم التكنولوجي المستمر يدفع سوق العرض التفاعلي، خاصة في أكبر الدول المتقدمة تكنولوجيًا في العالم مثل الصين واليابان وكوريا الجنوبية.
رؤى إقليمية حول سوق العرض التفاعلي
لقد قام المحللون في Insight Partners بشرح الاتجاهات والعوامل الإقليمية المؤثرة على سوق العرض التفاعلي طوال فترة التوقعات بشكل شامل. يناقش هذا القسم أيضًا قطاعات سوق العرض التفاعلي والجغرافيا في جميع أنحاء أمريكا الشمالية وأوروبا ومنطقة آسيا والمحيط الهادئ والشرق الأوسط وأفريقيا وأمريكا الجنوبية والوسطى.
- احصل على البيانات الإقليمية المحددة لسوق العرض التفاعلي
نطاق تقرير سوق العرض التفاعلي
| سمة التقرير | تفاصيل |
|---|---|
| حجم السوق في عام 2023 | 11.30 مليار دولار أمريكي |
| حجم السوق بحلول عام 2031 | 18.51 مليار دولار أمريكي |
| معدل النمو السنوي المركب العالمي (2023 - 2031) | 6.4% |
| البيانات التاريخية | 2021-2022 |
| فترة التنبؤ | 2024-2031 |
| القطاعات المغطاة | حسب المنتج
|
| المناطق والدول المغطاة | أمريكا الشمالية
|
| قادة السوق وملفات تعريف الشركات الرئيسية |
|
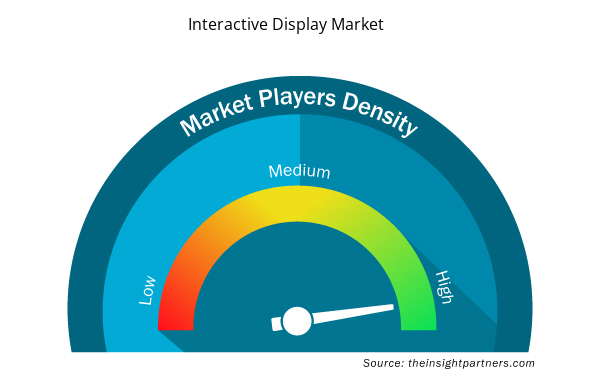
كثافة اللاعبين في سوق شاشات العرض التفاعلية: فهم تأثيرها على ديناميكيات الأعمال
يشهد سوق شاشات العرض التفاعلية نموًا سريعًا، مدفوعًا بالطلب المتزايد من المستخدم النهائي بسبب عوامل مثل تفضيلات المستهلك المتطورة والتقدم التكنولوجي والوعي المتزايد بفوائد المنتج. ومع ارتفاع الطلب، تعمل الشركات على توسيع عروضها والابتكار لتلبية احتياجات المستهلكين والاستفادة من الاتجاهات الناشئة، مما يؤدي إلى زيادة نمو السوق.
تشير كثافة اللاعبين في السوق إلى توزيع الشركات أو المؤسسات العاملة في سوق أو صناعة معينة. وهي تشير إلى عدد المنافسين (اللاعبين في السوق) الموجودين في مساحة سوق معينة نسبة إلى حجمها أو قيمتها السوقية الإجمالية.
الشركات الرئيسية العاملة في سوق العرض التفاعلي هي:
- شركة سامسونج للإلكترونيات المحدودة
- بروميثيان المحدودة
- شركة إل جي إلكترونيكس المحدودة
- مجموعة بي أو إي للتكنولوجيا المحدودة
- شركة باناسونيك القابضة
- شركة شارب للإلكترونيات
إخلاء المسؤولية : الشركات المذكورة أعلاه ليست مرتبة بأي ترتيب معين.
- احصل على نظرة عامة على أهم اللاعبين الرئيسيين في سوق العرض التفاعلي
أخبار سوق الشاشات التفاعلية والتطورات الأخيرة
يتم تقييم سوق العرض التفاعلي من خلال جمع البيانات النوعية والكمية بعد البحث الأولي والثانوي، والتي تتضمن منشورات الشركات المهمة وبيانات الجمعيات وقواعد البيانات. فيما يلي بعض التطورات في سوق العرض التفاعلي:
- قدمت شركة Elo Touch Solutions شاشة 2799L ذات الإطار المفتوح، والتي تم تصميمها خصيصًا لقطاعات التجزئة والقطاعات ذات الصلة. شاشة 2799L ذات الإطار المفتوح هي حل مخصص عالي التحمل بشاشة مقاس 27 بوصة، مما يجعلها مناسبة للاستخدام في الهواء الطلق. (المصدر: Elo Touch Solutions، بيان صحفي، سبتمبر 2023)
- استعرضت شركة Samsung Electronics USA نظام Tizen في معرض National Restaurant Association (NRA) 2023. Tizen هي تقنية أكشاك تفاعلية جديدة توفر مرونة أكبر من خلال تقديم تجربة طعام أكثر ملاءمة للمستهلكين.
(المصدر: سامسونج للإلكترونيات، بيان صحفي، مايو 2023)
تقرير سوق شاشات العرض التفاعلية والتغطية والنتائج المتوقعة
يوفر تقرير "حجم سوق شاشات العرض التفاعلية والتوقعات (2021-2031)" تحليلاً مفصلاً للسوق يغطي المجالات التالية:
- حجم سوق العرض التفاعلي وتوقعاته على المستويات العالمية والإقليمية والوطنية لجميع قطاعات السوق الرئيسية التي يغطيها النطاق
- اتجاهات سوق العرض التفاعلي بالإضافة إلى ديناميكيات السوق مثل المحركات والقيود والفرص الرئيسية
- تحليل مفصل لقوى PEST/Porter الخمس وSWOT
- تحليل سوق العرض التفاعلي الذي يغطي اتجاهات السوق الرئيسية والإطار العالمي والإقليمي واللاعبين الرئيسيين واللوائح والتطورات الأخيرة في السوق
- تحليل المشهد الصناعي والمنافسة الذي يغطي تركيز السوق، وتحليل خريطة الحرارة، واللاعبين البارزين، والتطورات الأخيرة لسوق العرض التفاعلي
- ملفات تعريف الشركة التفصيلية
- التحليل التاريخي (سنتان)، السنة الأساسية، التوقعات (7 سنوات) مع معدل النمو السنوي المركب
- تحليل PEST و SWOT
- حجم السوق والقيمة / الحجم - عالميًا وإقليميًا وقطريًا
- الصناعة والمنافسة
- مجموعة بيانات Excel


Report Coverage
Revenue forecast, Company Analysis, Industry landscape, Growth factors, and Trends

Segment Covered
This text is related
to segments covered.

Regional Scope
North America, Europe, Asia Pacific, Middle East & Africa, South & Central America

Country Scope
This text is related
to country scope.
الأسئلة الشائعة
Samsung Electronics Co Ltd, Promethean Limited, LG Electronics Inc., BOE Technology Group Co Ltd, and ViewSonic Corporation are major players in the market.
The market is expected to reach a value of US$ 18.51 billion by 2031.
Rising demand for smart learning, increasing deployment of interactive displays across various industries, and rising need for effective collaboration are driving the market growth.
The market is anticipated to expand at a CAGR of 6.4% during 2023–2031.
Growing demand for interactive retail displays is a key trend in the market.
Asia Pacific dominated the interactive display market in 2023.
The List of Companies - Interactive Display Market
- Samsung Electronics Co Ltd
- PROMETHEAN LIMITED
- LG Electronics Inc
- BOE Technology Group Co Ltd
- Panasonic Holdings Corp
- Sharp Electronics Corp
- Hitachi Ltd
- BenQ Corporation
- SMART TECHNOLOGIES ULC
- ViewSonic Corporation
The Insight Partners performs research in 4 major stages: Data Collection & Secondary Research, Primary Research, Data Analysis and Data Triangulation & Final Review.
- Data Collection and Secondary Research:
As a market research and consulting firm operating from a decade, we have published and advised several client across the globe. First step for any study will start with an assessment of currently available data and insights from existing reports. Further, historical and current market information is collected from Investor Presentations, Annual Reports, SEC Filings, etc., and other information related to company’s performance and market positioning are gathered from Paid Databases (Factiva, Hoovers, and Reuters) and various other publications available in public domain.
Several associations trade associates, technical forums, institutes, societies and organization are accessed to gain technical as well as market related insights through their publications such as research papers, blogs and press releases related to the studies are referred to get cues about the market. Further, white papers, journals, magazines, and other news articles published in last 3 years are scrutinized and analyzed to understand the current market trends.
- Primary Research:
The primarily interview analysis comprise of data obtained from industry participants interview and answers to survey questions gathered by in-house primary team.
For primary research, interviews are conducted with industry experts/CEOs/Marketing Managers/VPs/Subject Matter Experts from both demand and supply side to get a 360-degree view of the market. The primary team conducts several interviews based on the complexity of the markets to understand the various market trends and dynamics which makes research more credible and precise.
A typical research interview fulfils the following functions:
- Provides first-hand information on the market size, market trends, growth trends, competitive landscape, and outlook
- Validates and strengthens in-house secondary research findings
- Develops the analysis team’s expertise and market understanding
Primary research involves email interactions and telephone interviews for each market, category, segment, and sub-segment across geographies. The participants who typically take part in such a process include, but are not limited to:
- Industry participants: VPs, business development managers, market intelligence managers and national sales managers
- Outside experts: Valuation experts, research analysts and key opinion leaders specializing in the electronics and semiconductor industry.
Below is the breakup of our primary respondents by company, designation, and region:

Once we receive the confirmation from primary research sources or primary respondents, we finalize the base year market estimation and forecast the data as per the macroeconomic and microeconomic factors assessed during data collection.
- Data Analysis:
Once data is validated through both secondary as well as primary respondents, we finalize the market estimations by hypothesis formulation and factor analysis at regional and country level.
- Macro-Economic Factor Analysis:
We analyse macroeconomic indicators such the gross domestic product (GDP), increase in the demand for goods and services across industries, technological advancement, regional economic growth, governmental policies, the influence of COVID-19, PEST analysis, and other aspects. This analysis aids in setting benchmarks for various nations/regions and approximating market splits. Additionally, the general trend of the aforementioned components aid in determining the market's development possibilities.
- Country Level Data:
Various factors that are especially aligned to the country are taken into account to determine the market size for a certain area and country, including the presence of vendors, such as headquarters and offices, the country's GDP, demand patterns, and industry growth. To comprehend the market dynamics for the nation, a number of growth variables, inhibitors, application areas, and current market trends are researched. The aforementioned elements aid in determining the country's overall market's growth potential.
- Company Profile:
The “Table of Contents” is formulated by listing and analyzing more than 25 - 30 companies operating in the market ecosystem across geographies. However, we profile only 10 companies as a standard practice in our syndicate reports. These 10 companies comprise leading, emerging, and regional players. Nonetheless, our analysis is not restricted to the 10 listed companies, we also analyze other companies present in the market to develop a holistic view and understand the prevailing trends. The “Company Profiles” section in the report covers key facts, business description, products & services, financial information, SWOT analysis, and key developments. The financial information presented is extracted from the annual reports and official documents of the publicly listed companies. Upon collecting the information for the sections of respective companies, we verify them via various primary sources and then compile the data in respective company profiles. The company level information helps us in deriving the base number as well as in forecasting the market size.
- Developing Base Number:
Aggregation of sales statistics (2020-2022) and macro-economic factor, and other secondary and primary research insights are utilized to arrive at base number and related market shares for 2022. The data gaps are identified in this step and relevant market data is analyzed, collected from paid primary interviews or databases. On finalizing the base year market size, forecasts are developed on the basis of macro-economic, industry and market growth factors and company level analysis.
- Data Triangulation and Final Review:
The market findings and base year market size calculations are validated from supply as well as demand side. Demand side validations are based on macro-economic factor analysis and benchmarks for respective regions and countries. In case of supply side validations, revenues of major companies are estimated (in case not available) based on industry benchmark, approximate number of employees, product portfolio, and primary interviews revenues are gathered. Further revenue from target product/service segment is assessed to avoid overshooting of market statistics. In case of heavy deviations between supply and demand side values, all thes steps are repeated to achieve synchronization.
We follow an iterative model, wherein we share our research findings with Subject Matter Experts (SME’s) and Key Opinion Leaders (KOLs) until consensus view of the market is not formulated – this model negates any drastic deviation in the opinions of experts. Only validated and universally acceptable research findings are quoted in our reports.
We have important check points that we use to validate our research findings – which we call – data triangulation, where we validate the information, we generate from secondary sources with primary interviews and then we re-validate with our internal data bases and Subject matter experts. This comprehensive model enables us to deliver high quality, reliable data in shortest possible time.
 احصل على عينة مجانية لهذا التقرير