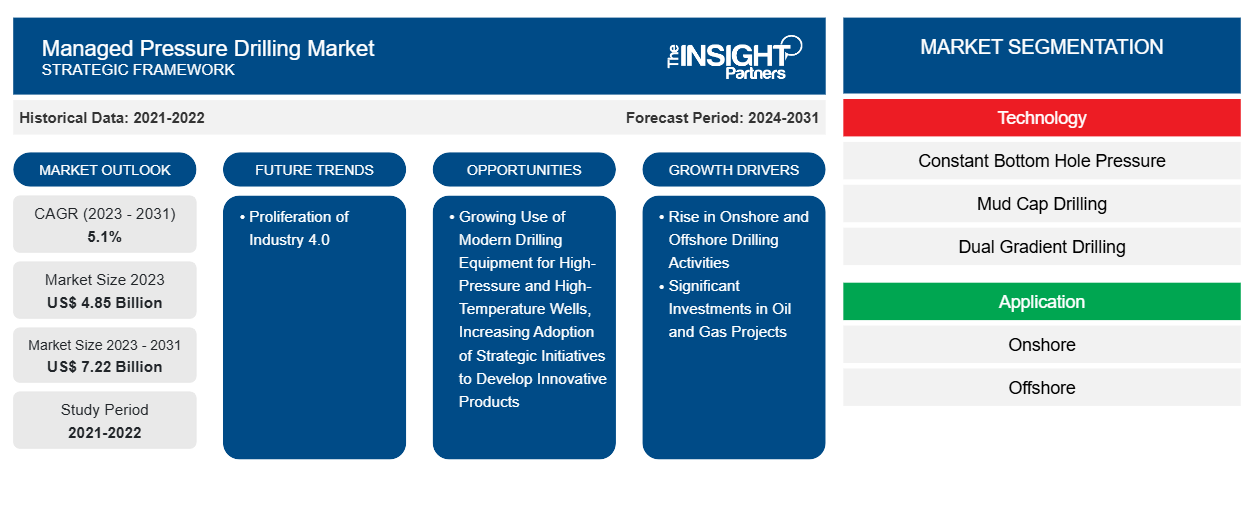
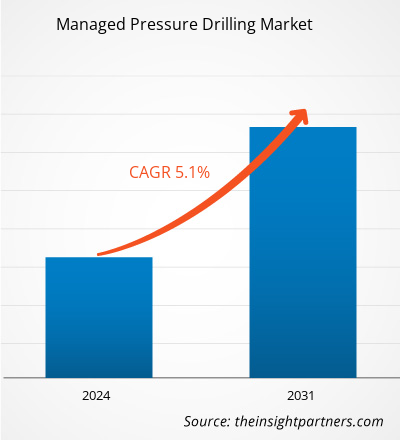
من المتوقع أن يصل حجم سوق الحفر تحت الضغط المُدار إلى 7.22 مليار دولار أمريكي بحلول عام 2031 من 4.85 مليار دولار أمريكي في عام 2023. ومن المتوقع أن يسجل السوق معدل نمو سنوي مركب بنسبة 5.1٪ خلال الفترة 2023-2031. ومن المرجح أن يؤدي التبني المتزايد لمعدات الحفر الحديثة للآبار ذات الضغط العالي ودرجة الحرارة العالية إلى ظهور اتجاهات جديدة في السوق في السنوات القادمة.
تحليل سوق الحفر تحت الضغط المُدار
تشمل الجهات المعنية الرئيسية في منظومة سوق الحفر تحت الضغط المُدار موردي المواد الخام ومصنعي معدات وآلات الحفر تحت الضغط المُدار ومقدمي الخدمات والمستخدمين النهائيين. يوفر موفرو المواد الخام أنواعًا مختلفة من المواد، بما في ذلك الفولاذ والألمنيوم، لمصنعي معدات وآلات الحفر تحت الضغط المُدار لتصنيع عمليات الحفر تحت الضغط المُدار المتكاملة مع تقنيات مختلفة. الضغط الثابت لقاع البئر (CBHP)، وحفر غطاء الطين (MCD)، والحفر ذو التدرج المزدوج (DGD)، وحفر التحكم في التدفق العائد (RFCD) هي بعض التقنيات المستخدمة في الحفر تحت الضغط المُدار.
يقدم مزودو الخدمة خدمات الحفر تحت الضغط المُدارة للمستخدمين النهائيين، مثل شركات استخراج النفط البرية والبحرية. يتم اعتماد خدمات الحفر تحت الضغط المُدارة من قبل العديد من الشركات بسبب أنشطة الحفر المتزايدة والاستثمارات الكبيرة في مشاريع النفط والغاز. على سبيل المثال، في عام 2024، أعلنت لجنة تنظيم البترول النيجيرية (NUPRC) أن نيجيريا عُرض عليها 12 كتلة نفطية في جولة تراخيص جديدة. في عام 2023، أعلنت وزارة النفط النيجيرية أن منح التراخيص لسبع كتل بحرية عُرضت في جولة تراخيص عام 2022 من المرجح أن يتم تكليفه بالكامل مع عقد الجولة في عام 2024، مع الاحتفاظ بالتراخيص المجمعة لـ 19 كتلة نفطية للمستثمرين القادرين. وبالمثل، في أبريل 2023، جمعت شركة النفط والغاز الطبيعي (ONGC) 7 مليارات دولار أمريكي في استثمارات على مدى السنوات الثلاث إلى الأربع القادمة لدعم إنتاج النفط والغاز. بعض الشركات المصنعة لمعدات وآلات الحفر تحت الضغط المُدار هي Ensign Energy Services، وADS Services LLC، وArcher، وBlade Energy Partners، وNabors Industries Ltd، وAir Drilling Associates Inc، وHalliburton Co، وSLB Weatherford International Plc، وNOV Inc.
نظرة عامة على سوق الحفر تحت الضغط المُدار
تُستخدم عملية الحفر تحت الضغط المُدار للتحكم في مستويات الضغط الحلقي بدقة عبر طول البئر من خلال إدارة بيئة الضغط في قاع البئر. إنها تقنية أساسية لحفر الآبار ذات نوافذ ضغط المسام الضيقة وتدرج الكسر. تتراوح أنظمة الحفر تحت الضغط المُدار من الآلية إلى الذكية، وتساعد في تعزيز السلامة وخفض تكاليف بناء الآبار وتقليل مخاطر التحكم في الآبار وزيادة إنتاج النفط والغاز. التطبيق الرئيسي لأنظمة الحفر تحت الضغط المُدار هو في آبار الغاز والنفط العميقة في الخارج. تتطلب عملية استخراج النفط والغاز تدابير احترازية لأن هذه المواد شديدة التقلب. مع زيادة أنشطة الحفر البرية والبحرية في جميع أنحاء العالم، يتزايد الطلب أيضًا على معدات الحفر تحت الضغط المُدار. على سبيل المثال، في أبريل 2023، بدأت شركة بي بي إنتاج النفط في منصة أرغوس الواقعة في خليج المكسيك. منصة أرغوس هي منشأة في المياه العميقة تقع على بعد حوالي 200 ميل جنوب نيو أورليانز، لويزيانا.
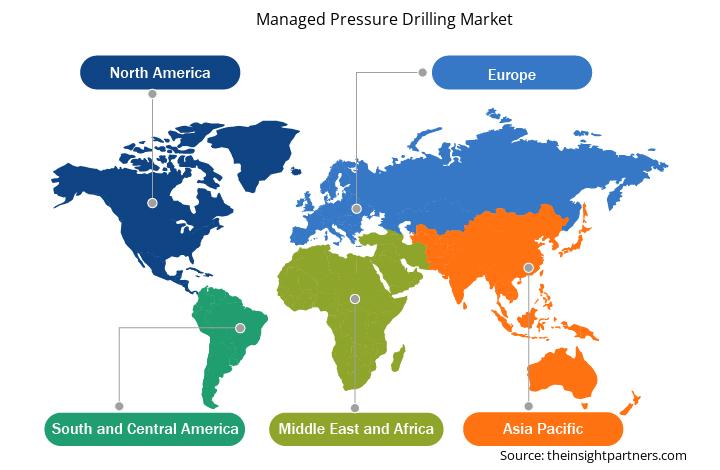
تم تقسيم سوق الحفر تحت الضغط العالمي إلى أمريكا الشمالية وأوروبا والشرق الأوسط وأفريقيا وأمريكا الجنوبية والوسطى. ومن المتوقع أن تهيمن أمريكا الشمالية على سوق الحفر تحت الضغط خلال الفترة المتوقعة. ويرجع ذلك إلى ارتفاع أنشطة حفر النفط والغاز. تهدف شركة تطوير الطاقة الأمريكية (US Energy) إلى توسيع عملياتها في حوض بيرميان الخصيب، أحد أكثر مناطق النفط والغاز إنتاجية في الولايات المتحدة. وعلى مدار الاثني عشر شهرًا القادمة في عام 2024، تتوقع الشركة نشر رأس مال قدره 750 مليون دولار أمريكي، مع تخصيص غالبية هذا الصندوق للمشاريع في حوض بيرميان. علاوة على ذلك، استثمرت شركة US Energy وشغلت وحفرت حوالي 4000 بئر في 13 ولاية أمريكية وكندا. مثل هذا الاستثمار المتزايد في قطاع النفط والغاز في جميع أنحاء الولايات المتحدة وكندا والمكسيك يدفع الطلب على منتجات الحفر تحت الضغط المُدار.
قم بتخصيص هذا التقرير ليناسب متطلباتك
ستحصل على تخصيص لأي تقرير - مجانًا - بما في ذلك أجزاء من هذا التقرير، أو تحليل على مستوى الدولة، وحزمة بيانات Excel، بالإضافة إلى الاستفادة من العروض والخصومات الرائعة للشركات الناشئة والجامعات
سوق الحفر تحت الضغط المُدار:
- احصل على أهم اتجاهات السوق الرئيسية لهذا التقرير.ستتضمن هذه العينة المجانية تحليلاً للبيانات، بدءًا من اتجاهات السوق وحتى التقديرات والتوقعات.
محركات وفرص سوق الحفر تحت الضغط المُدار
الاستخدام المتزايد لمعدات الحفر الحديثة للآبار ذات الضغط العالي ودرجة الحرارة العالية
تحفر العديد من البلدان بشكل متزايد آبار الضغط العالي ودرجة الحرارة المرتفعة. إن فقدان الدورة، أو انسداد الأنابيب، أو الالتواء، أو سيناريوهات الركل أو الخسارة هي بعض القضايا المرتبطة بأنشطة الحفر. عادةً ما يتم استخدام نظام الحفر تحت الضغط المُدار في أنشطة حفر الآبار ذات الضغط العالي ودرجة الحرارة المرتفعة حيث تساعد المعدات في حل هذه المشكلات من خلال تحسين معدل الاختراق، وتجنب الركل أو الخسارة، وتضييق نافذة الحفر، وإدارة برامج الطين، والسماح بالتعرف المبكر على انتفاخ البئر، وضمان الكفاءة العالية، وتقليل الوقت غير المنتج. وبالتالي، من المتوقع أن يوفر الاستخدام المتزايد لتقنيات الحفر تحت الضغط المُدار لحفر الآبار ذات الضغط العالي ودرجة الحرارة المرتفعة فرص نمو كبيرة لمقدمي معدات الحفر تحت الضغط المُدار خلال فترة التنبؤ.
زيادة اعتماد المبادرات الاستراتيجية لتطوير المنتجات المبتكرة
تتبنى العديد من الشركات الكبرى استراتيجيات مثل عمليات الدمج والاستحواذ والشراكات والتعاون لتطوير معدات الحفر تحت الضغط المُدار المتقدمة، والتي من المتوقع أن تخلق فرصًا واسعة لنمو سوق الحفر تحت الضغط المُدار خلال فترة التنبؤ. على سبيل المثال، في سبتمبر 2024، تعاونت شركة Seadrill، وهي شركة مقاولات حفر بحرية مقرها برمودا، مع شركة Oil States International، وهي شركة حفر بحرية مقرها في تكساس. يهدف هذا التعاون إلى تحويل كفاءة الحفر البحري من خلال تبني الحفر تحت الضغط المُدار (MPD) في عملياتها الرئيسية. وبالمثل، في يوليو 2024، وقعت شركة Archer اتفاقية مع شركة Air Drilling Associates، Inc. للاستحواذ على شركتها التابعة للحفر تحت الضغط المُدار، ADA Argentina. تقدم الشركة التابعة خدمات الحفر تحت الضغط المُدار لعملاء Archer في حوض Vaca Muerta في الأرجنتين. الحفر تحت الضغط المُدار هو عملية حفر تكيفية تساعد في التحكم في ملف الضغط الحلقي بدقة في جميع أنحاء البئر المحفورة. علاوة على ذلك، تمتلك شركة ADA وتدير ثلاثة أنظمة للحفر تحت الضغط المُدار.
تقرير تحليل تجزئة سوق الحفر تحت الضغط المُدار
إن القطاعات الرئيسية التي ساهمت في استخلاص تحليل سوق الحفر تحت الضغط المُدار هي التكنولوجيا والتطبيق.
- من حيث التكنولوجيا، يتم تصنيف السوق إلى حفر قاع الحفرة بضغط ثابت، وحفر غطاء الطين، وحفر التدرج المزدوج، وحفر التحكم في تدفق العودة. هيمن قطاع ضغط قاع الحفرة الثابت على السوق في عام 2023.
بناءً على التطبيق، ينقسم السوق إلى بري وبحري. يهيمن قطاع البري على السوق في عام 2023.
تحليل حصة سوق الحفر تحت الضغط حسب المنطقة الجغرافية
تم تقسيم سوق الحفر تحت الضغط المُدار إلى خمس مناطق رئيسية: أمريكا الشمالية وأوروبا وآسيا والمحيط الهادئ (APAC) والشرق الأوسط وأفريقيا (MEA) وأمريكا الجنوبية والوسطى. سيطرت أمريكا الشمالية على السوق في عام 2023، تليها منطقة آسيا والمحيط الهادئ والشرق الأوسط وأفريقيا.
من المتوقع أن يزدهر سوق الحفر تحت الضغط المُدار في منطقة الشرق الأوسط وأفريقيا بسبب زيادة الاستثمارات في قطاع النفط والغاز. يساهم قطاع النفط والغاز بحصة كبيرة من الناتج المحلي الإجمالي لهذه البلدان. في عام 2024، خططت شركة بترول أبوظبي الوطنية (أدنوك) لاستثمار أكثر من 13 مليار دولار أمريكي بين عامي 2024 و2029 لتوسيع استكشاف الغاز الطبيعي المسال. في عام 2023، بلغ إجمالي استثمارات رأس المال لشركة أرامكو، وهي شركة نفط وغاز في الشرق الأوسط، 49.7 مليار دولار أمريكي، بزيادة قدرها 28٪ مقارنة بعام 2022. في عام 2024، من المتوقع أن تصل استثمارات رأس مال الشركة إلى ما بين 48 مليار دولار أمريكي و58 مليار دولار أمريكي. تعد الزيادة في دخل الفرد، وتعافي الظروف الاقتصادية، والإنفاق الحكومي على تطوير البنية التحتية من بين العوامل التي تساهم في الطلب على خدمات الحفر تحت الضغط المُدار. يعد إنتاج النفط والغاز أحد أبرز الأعمال في المنطقة. إن المملكة العربية السعودية وليبيا وإيران والإمارات العربية المتحدة وقطر من الدول القليلة التي شهدت نمواً في قطاع النفط. وعلى الرغم من تباطؤ النمو الاقتصادي والاختلالات الاقتصادية الكلية الكبيرة الناجمة عن انخفاض أسعار النفط في السنوات القليلة الماضية، فإن الدول المنتجة للنفط والغاز في منطقة الشرق الأوسط وأفريقيا تركز على تحقيق إنتاج أكبر من النفط والغاز من خلال الشراكة مع شركات أجنبية لتوسيع أنشطتها في حقول النفط والغاز الضخمة البحرية والبرية.
رؤى إقليمية حول سوق الحفر تحت الضغط المُدار
لقد قام المحللون في Insight Partners بشرح الاتجاهات والعوامل الإقليمية المؤثرة على سوق الحفر تحت الضغط المُدار طوال فترة التوقعات بشكل شامل. يناقش هذا القسم أيضًا قطاعات سوق الحفر تحت الضغط المُدار والجغرافيا في جميع أنحاء أمريكا الشمالية وأوروبا ومنطقة آسيا والمحيط الهادئ والشرق الأوسط وأفريقيا وأمريكا الجنوبية والوسطى.
- احصل على البيانات الإقليمية المحددة لسوق الحفر تحت الضغط المُدار
نطاق تقرير سوق الحفر تحت الضغط المُدار
| سمة التقرير | تفاصيل |
|---|---|
| حجم السوق في عام 2023 | 4.85 مليار دولار أمريكي |
| حجم السوق بحلول عام 2031 | 7.22 مليار دولار أمريكي |
| معدل النمو السنوي المركب العالمي (2023 - 2031) | 5.1% |
| البيانات التاريخية | 2021-2022 |
| فترة التنبؤ | 2024-2031 |
| القطاعات المغطاة | حسب التكنولوجيا
|
| المناطق والدول المغطاة | أمريكا الشمالية
|
| قادة السوق وملفات تعريف الشركات الرئيسية |
|
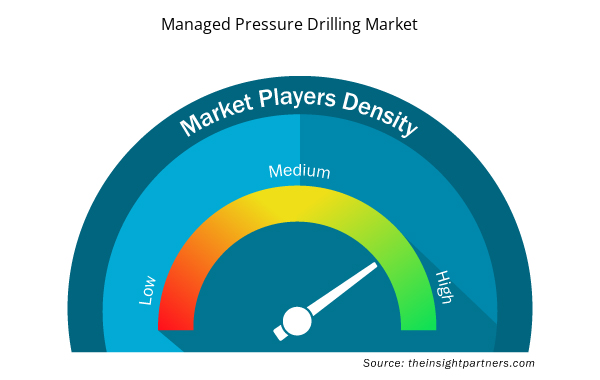
كثافة اللاعبين في سوق الحفر تحت الضغط المُدار: فهم تأثيرها على ديناميكيات الأعمال
يشهد سوق الحفر تحت الضغط نموًا سريعًا، مدفوعًا بالطلب المتزايد من المستخدم النهائي بسبب عوامل مثل تفضيلات المستهلكين المتطورة والتقدم التكنولوجي والوعي المتزايد بفوائد المنتج. ومع ارتفاع الطلب، تعمل الشركات على توسيع عروضها والابتكار لتلبية احتياجات المستهلكين والاستفادة من الاتجاهات الناشئة، مما يؤدي إلى زيادة نمو السوق.
تشير كثافة اللاعبين في السوق إلى توزيع الشركات أو المؤسسات العاملة في سوق أو صناعة معينة. وهي تشير إلى عدد المنافسين (اللاعبين في السوق) الموجودين في مساحة سوق معينة نسبة إلى حجمها أو قيمتها السوقية الإجمالية.
الشركات الرئيسية العاملة في سوق الحفر تحت الضغط المُدار هي:
- خدمات الطاقة للراين
- خدمات ADS ذ.م.م
- رامي
- شركاء الطاقة بليد
- شركة نابورز للصناعات المحدودة
- شركة الحفر الجوي
إخلاء المسؤولية : الشركات المذكورة أعلاه ليست مرتبة بأي ترتيب معين.
- احصل على نظرة عامة على أهم اللاعبين الرئيسيين في سوق الحفر تحت الضغط المُدار
أخبار سوق الحفر تحت الضغط المُدار والتطورات الأخيرة
يتم تقييم سوق الحفر تحت الضغط المُدار من خلال جمع البيانات النوعية والكمية بعد البحث الأولي والثانوي، والذي يتضمن منشورات الشركات المهمة وبيانات الجمعيات وقواعد البيانات. فيما يلي بعض التطورات الرئيسية في سوق الحفر تحت الضغط المُدار:
- أعلنت شركة Nabors Industries Ltd وشركة SLB عن تعاونهما لتوسيع نطاق تبني حلول الحفر الآلي لمشغلي النفط والغاز ومقاولي الحفر. ستتيح الاتفاقية للعملاء دمج تطبيقات أتمتة الحفر وأنظمة تشغيل الحفارات الخاصة بالشركتين بسلاسة لتقديم أداء وكفاءة أفضل لبناء الآبار.
(المصدر: شركة نابورز إندستريز المحدودة، بيان صحفي، يناير 2024)
- أعلنت شركة هاليبرتون وشركة Oil States Industries، Inc. عن تعاون استراتيجي يجمع بين مجموعتين من التقنيات الحائزة على جوائز لتزويد العملاء بحلول مبتكرة للحفر تحت الضغط في المياه العميقة (MPD).
(المصدر: هاليبرتون، بيان صحفي، نوفمبر 2023)
تقرير سوق الحفر تحت الضغط المُدار وتغطية النتائج
يوفر "حجم سوق الحفر تحت الضغط المُدار والتوقعات (2021-2031)" تحليلاً مفصلاً للسوق يغطي المجالات المذكورة أدناه:
- حجم سوق الحفر تحت الضغط المُدار والتوقعات على المستويات العالمية والإقليمية والوطنية لجميع قطاعات السوق الرئيسية التي يغطيها النطاق
- إدارة اتجاهات سوق الحفر تحت الضغط بالإضافة إلى ديناميكيات السوق مثل المحركات والقيود والفرص الرئيسية
- تحليل مفصل لـ PEST و SWOT
- تحليل سوق الحفر تحت الضغط المُدار والذي يغطي اتجاهات السوق الرئيسية والإطار العالمي والإقليمي واللاعبين الرئيسيين واللوائح والتطورات الأخيرة في السوق
- تحليل المشهد الصناعي والمنافسة الذي يغطي تركيز السوق، وتحليل خريطة الحرارة، واللاعبين البارزين، والتطورات الأخيرة لسوق الحفر تحت الضغط المُدار
- ملفات تعريف الشركة التفصيلية
- التحليل التاريخي (سنتان)، السنة الأساسية، التوقعات (7 سنوات) مع معدل النمو السنوي المركب
- تحليل PEST و SWOT
- حجم السوق والقيمة / الحجم - عالميًا وإقليميًا وقطريًا
- الصناعة والمنافسة
- مجموعة بيانات Excel


Report Coverage
Revenue forecast, Company Analysis, Industry landscape, Growth factors, and Trends

Segment Covered
This text is related
to segments covered.

Regional Scope
North America, Europe, Asia Pacific, Middle East & Africa, South & Central America

Country Scope
This text is related
to country scope.
الأسئلة الشائعة
Growing use of modern drilling equipment for high-pressure and high-temperature wells is expected to be the key opportunity in the market.
Ensign Energy Services; ADS Services, LLC; CATL; Archer; Blade Energy Partners; Nabors Industries Ltd; Air Drilling Associates, Inc; Halliburton Co; Ameresco Inc.; ESS, Inc.; SLB; Weatherford International Plc; NOV Inc. are the key market players operating in the Global Managed Pressure Drilling Market.
The rise in onshore and offshore drilling activities is contributing to the growth of the Global Managed Pressure Drilling Market.
Proliferation of Industry 4.0 to stimulate the Global Managed Pressure Drilling Market growth in the coming years.
Constant Bottom Hole Pressure is expected to dominate the market over the forecast period.
The List of Companies - Managed Pressure Drilling Market
- Ensign Energy Services
- ADS Services, LLC
- Archer
- Blade Energy Partners
- Nabors Industries Ltd
- Air Drilling Associates, Inc
- Halliburton Co
- SLB
- Weatherford International Plc
- NOV Inc
The Insight Partners performs research in 4 major stages: Data Collection & Secondary Research, Primary Research, Data Analysis and Data Triangulation & Final Review.
- Data Collection and Secondary Research:
As a market research and consulting firm operating from a decade, we have published and advised several client across the globe. First step for any study will start with an assessment of currently available data and insights from existing reports. Further, historical and current market information is collected from Investor Presentations, Annual Reports, SEC Filings, etc., and other information related to company’s performance and market positioning are gathered from Paid Databases (Factiva, Hoovers, and Reuters) and various other publications available in public domain.
Several associations trade associates, technical forums, institutes, societies and organization are accessed to gain technical as well as market related insights through their publications such as research papers, blogs and press releases related to the studies are referred to get cues about the market. Further, white papers, journals, magazines, and other news articles published in last 3 years are scrutinized and analyzed to understand the current market trends.
- Primary Research:
The primarily interview analysis comprise of data obtained from industry participants interview and answers to survey questions gathered by in-house primary team.
For primary research, interviews are conducted with industry experts/CEOs/Marketing Managers/VPs/Subject Matter Experts from both demand and supply side to get a 360-degree view of the market. The primary team conducts several interviews based on the complexity of the markets to understand the various market trends and dynamics which makes research more credible and precise.
A typical research interview fulfils the following functions:
- Provides first-hand information on the market size, market trends, growth trends, competitive landscape, and outlook
- Validates and strengthens in-house secondary research findings
- Develops the analysis team’s expertise and market understanding
Primary research involves email interactions and telephone interviews for each market, category, segment, and sub-segment across geographies. The participants who typically take part in such a process include, but are not limited to:
- Industry participants: VPs, business development managers, market intelligence managers and national sales managers
- Outside experts: Valuation experts, research analysts and key opinion leaders specializing in the electronics and semiconductor industry.
Below is the breakup of our primary respondents by company, designation, and region:

Once we receive the confirmation from primary research sources or primary respondents, we finalize the base year market estimation and forecast the data as per the macroeconomic and microeconomic factors assessed during data collection.
- Data Analysis:
Once data is validated through both secondary as well as primary respondents, we finalize the market estimations by hypothesis formulation and factor analysis at regional and country level.
- Macro-Economic Factor Analysis:
We analyse macroeconomic indicators such the gross domestic product (GDP), increase in the demand for goods and services across industries, technological advancement, regional economic growth, governmental policies, the influence of COVID-19, PEST analysis, and other aspects. This analysis aids in setting benchmarks for various nations/regions and approximating market splits. Additionally, the general trend of the aforementioned components aid in determining the market's development possibilities.
- Country Level Data:
Various factors that are especially aligned to the country are taken into account to determine the market size for a certain area and country, including the presence of vendors, such as headquarters and offices, the country's GDP, demand patterns, and industry growth. To comprehend the market dynamics for the nation, a number of growth variables, inhibitors, application areas, and current market trends are researched. The aforementioned elements aid in determining the country's overall market's growth potential.
- Company Profile:
The “Table of Contents” is formulated by listing and analyzing more than 25 - 30 companies operating in the market ecosystem across geographies. However, we profile only 10 companies as a standard practice in our syndicate reports. These 10 companies comprise leading, emerging, and regional players. Nonetheless, our analysis is not restricted to the 10 listed companies, we also analyze other companies present in the market to develop a holistic view and understand the prevailing trends. The “Company Profiles” section in the report covers key facts, business description, products & services, financial information, SWOT analysis, and key developments. The financial information presented is extracted from the annual reports and official documents of the publicly listed companies. Upon collecting the information for the sections of respective companies, we verify them via various primary sources and then compile the data in respective company profiles. The company level information helps us in deriving the base number as well as in forecasting the market size.
- Developing Base Number:
Aggregation of sales statistics (2020-2022) and macro-economic factor, and other secondary and primary research insights are utilized to arrive at base number and related market shares for 2022. The data gaps are identified in this step and relevant market data is analyzed, collected from paid primary interviews or databases. On finalizing the base year market size, forecasts are developed on the basis of macro-economic, industry and market growth factors and company level analysis.
- Data Triangulation and Final Review:
The market findings and base year market size calculations are validated from supply as well as demand side. Demand side validations are based on macro-economic factor analysis and benchmarks for respective regions and countries. In case of supply side validations, revenues of major companies are estimated (in case not available) based on industry benchmark, approximate number of employees, product portfolio, and primary interviews revenues are gathered. Further revenue from target product/service segment is assessed to avoid overshooting of market statistics. In case of heavy deviations between supply and demand side values, all thes steps are repeated to achieve synchronization.
We follow an iterative model, wherein we share our research findings with Subject Matter Experts (SME’s) and Key Opinion Leaders (KOLs) until consensus view of the market is not formulated – this model negates any drastic deviation in the opinions of experts. Only validated and universally acceptable research findings are quoted in our reports.
We have important check points that we use to validate our research findings – which we call – data triangulation, where we validate the information, we generate from secondary sources with primary interviews and then we re-validate with our internal data bases and Subject matter experts. This comprehensive model enables us to deliver high quality, reliable data in shortest possible time.
 احصل على عينة مجانية لهذا التقرير