سوق حلول التوفر على الرف – برامج التشغيل والاتجاهات والفرص وإحصاءات النمو | 2031
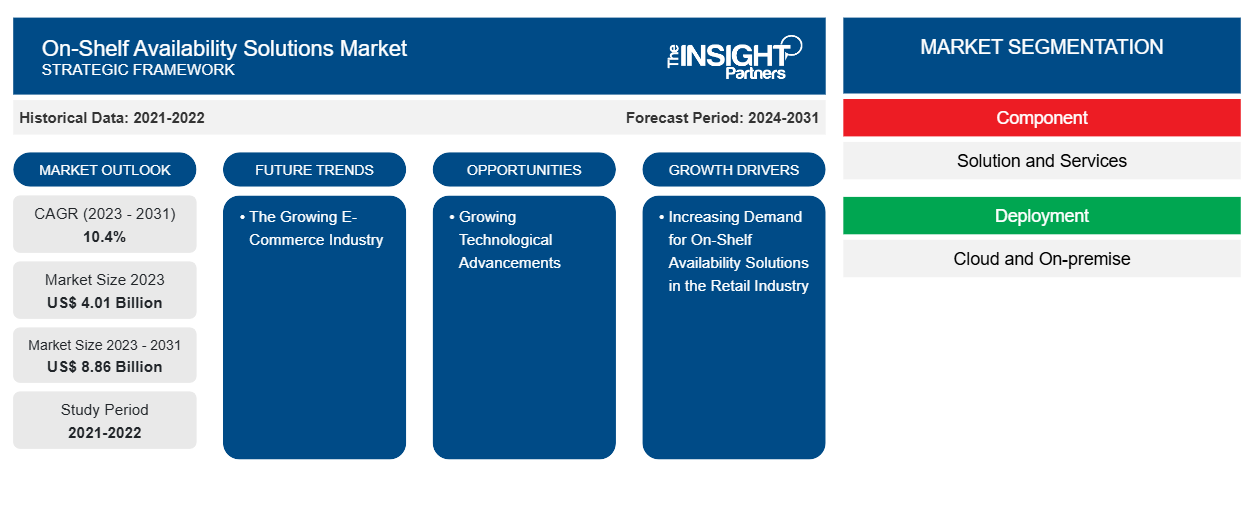
البيانات التاريخية : 2021-2022 | سنة الأساس : 2023 | فترة التنبؤ : 2024-2031حجم سوق حلول التوفر على الرفوف وتوقعاته (2021-2031)، والحصة العالمية والإقليمية، والاتجاهات، وفرص النمو. يغطي التقرير: حسب المكون (الحلول والخدمات)، والنشر (السحابي والمحلي)، والمستخدم النهائي (مصنعو السلع الاستهلاكية المعبأة، وتجار التجزئة، والموردون، وغيرهم)، والجغرافيا.
- تاريخ التقرير : Mar 2026
- رمز التقرير : TIPRE00007761
- الفئة : التكنولوجيا والإعلام والاتصالات
- الحالة : البيانات الصادرة
- تنسيقات التقارير المتاحة :


- عدد الصفحات : 150
من المتوقع أن يصل حجم سوق حلول التوفر على الرفوف إلى 8.86 مليار دولار أمريكي بحلول عام 2031 من 4.01 مليار دولار أمريكي في عام 2023. ومن المتوقع أن يسجل السوق معدل نمو سنوي مركب بنسبة 10.4٪ في الفترة 2023-2031. ومن المرجح أن تظل صناعة التجارة الإلكترونية المتنامية اتجاهًا رئيسيًا في سوق حلول التوفر على الرفوف.
تحليل سوق حلول التوفر على الرفوف
إن العدد المتزايد من متاجر التجزئة في جميع أنحاء العالم يزيد من الطلب على حلول التوفر على الرفوف في صناعة التجزئة، وهو أحد العوامل الرئيسية التي تغذي نمو السوق. بالإضافة إلى ذلك، فإن الطلب المتزايد على حلول متعددة القنوات والتركيز المتزايد على تجربة العملاء يدفعان نمو السوق. علاوة على ذلك، فإن التكامل المتزايد للتكنولوجيا المتقدمة مثل الذكاء الاصطناعي والتعلم الآلي والرؤية الحاسوبية وغيرها يخلق فرصة لنمو سوق حلول التوفر على الرفوف في السنوات القادمة.
نظرة عامة على سوق حلول التوفر على الرفوف
يشير مصطلح التوفر على الرفوف إلى وجود منتج على أرفف المتجر عندما يصل العميل لشرائه. ويضمن التوفر على الرفوف أن يتمكن العملاء من شراء المنتج الذي يرغبون فيه بسهولة ودون متاعب. وبالنسبة للتاجر، فإنه يضمن سعادة المستهلك بالإضافة إلى زيادة الإيرادات من مبيعات المنتجات. كما يساعد التوفر على الرفوف الشركات المصنعة أيضًا، حيث يضمن مبيعات سلعها ويقدم معلومات مفيدة للتحكم في المخزون. ونتيجة لذلك، في قطاع التجزئة، يعد التوفر على الرفوف عاملاً حاسمًا يجب مراقبته والحفاظ عليه بشكل فعال.
قم بتخصيص هذا التقرير ليناسب متطلباتك
ستحصل على تخصيص لأي تقرير - مجانًا - بما في ذلك أجزاء من هذا التقرير، أو تحليل على مستوى الدولة، وحزمة بيانات Excel، بالإضافة إلى الاستفادة من العروض والخصومات الرائعة للشركات الناشئة والجامعات
سوق حلول التوفر على الرفوف: رؤى استراتيجية
-
احصل على أهم اتجاهات السوق الرئيسية لهذا التقرير.ستتضمن هذه العينة المجانية تحليلاً للبيانات، بدءًا من اتجاهات السوق وحتى التقديرات والتوقعات.
محركات وفرص سوق حلول التوفر على الرفوف
تزايد الطلب على حلول توافر المنتجات على الرفوف في قطاع البيع بالتجزئة
تظل أساسيات عمليات المتاجر تشكل تحديًا للعديد من تجار التجزئة، وذلك غالبًا لأنهم غير قادرين على تفسير البيانات التي لديهم أو ليس لديهم إمكانية الوصول إلى المعلومات اللازمة لإجراء التحسينات. وللتعامل مع هذه المشكلة، يتبنى تجار التجزئة حلول التوفر على الرفوف. يمكن أن يساعد هذا الحل تجار التجزئة على توفير رضا العملاء وزيادة الإيرادات من خلال بيع المنتج. بالإضافة إلى ذلك، يساعد تجار التجزئة على تحسين سمعة العلامة التجارية وتعزيز ثقافة الشركة الأكثر إيجابية. وبالتالي، فإن كل العوامل المذكورة أعلاه تزيد من الطلب على حلول التوفر على الرفوف في صناعة التجزئة، مما يدفع نمو السوق.
التقدم التكنولوجي المتزايد
تتطلب إدارة الرفوف يدويًا تكاليف عالية للقوى العاملة، ويتم تنفيذها في الغالب بتردد محدد. لحل هذه المشكلة، يعمل العديد من اللاعبين في السوق باستمرار على دمج التقنيات المتقدمة مثل الذكاء الاصطناعي والرؤية الحاسوبية وغيرها. يمكن أن يساعد دمج التقنيات تلقائيًا في اكتشاف العناصر خارج النظام والمواضع غير الصحيحة وغيرها من المشكلات من خلال تحديد وتصنيف وجرد عناصر الرفوف باستخدام خوارزميات مثل التعرف على بطاقة السعر والتعرف على المنتج واكتشاف خارج النظام والتعرف على النشاط والتعرف الضوئي على الحروف (OCR). وبالتالي، يمكن لمثل هذه التطورات التكنولوجية أن تخلق فرصة لنمو السوق في الفترة المتوقعة.
تقرير تحليل تجزئة سوق حلول التوفر على الرفوف
إن القطاعات الرئيسية التي ساهمت في اشتقاق تحليل سوق حلول التوفر على الرف هي المكونات والنشر والمستخدم النهائي.
- بناءً على المكون، ينقسم السوق إلى الحلول والخدمات. احتل قطاع الحلول حصة سوقية أكبر في عام 2023.
- من حيث النشر، يتم تقسيم السوق إلى السحابة والمحلية. احتلت شريحة السحابة الحصة الأكبر من السوق في عام 2023.
- بحسب المستخدم النهائي، يتم تقسيم السوق إلى مصنعي السلع الاستهلاكية المعبأة، وتجار التجزئة، والموردين، وغيرهم. وقد استحوذت شريحة مصنعي السلع الاستهلاكية المعبأة على أكبر حصة من السوق في عام 2023.
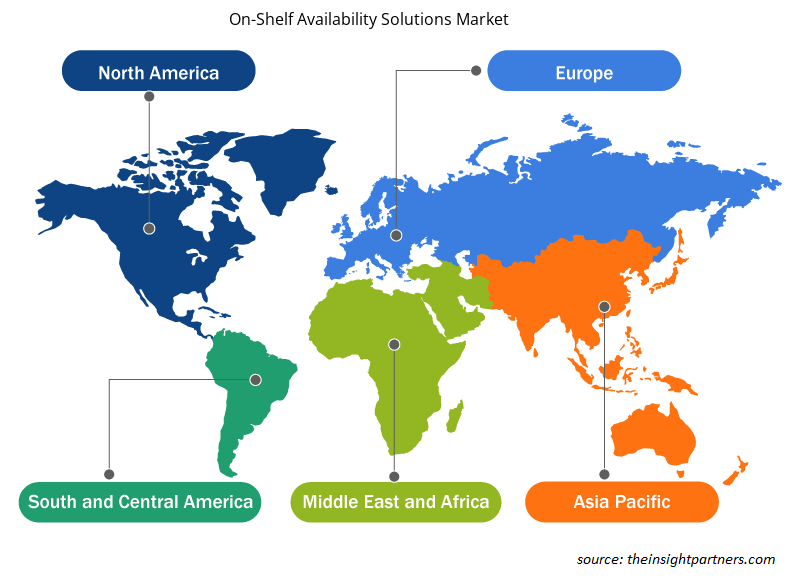
تحليل حصة سوق حلول التوفر على الرفوف حسب المنطقة الجغرافية
ينقسم النطاق الجغرافي لتقرير سوق حلول التوفر على الرف بشكل أساسي إلى خمس مناطق: أمريكا الشمالية، ومنطقة آسيا والمحيط الهادئ، وأوروبا، والشرق الأوسط وأفريقيا، وأمريكا الجنوبية/أمريكا الجنوبية والوسطى.
من حيث الإيرادات، استحوذت أمريكا الشمالية على أكبر حصة في سوق حلول التوفر على الرفوف. السوق في هذه المنطقة مقسمة إلى الولايات المتحدة وكندا والمكسيك. تشهد المنطقة ارتفاعًا هائلاً في قطاع التجارة الإلكترونية، وهو أحد العوامل الرئيسية التي تغذي نمو السوق. بالإضافة إلى ذلك، تتكون المنطقة من قطاعات البيع بالتجزئة وسلسلة التوريد المتطورة للغاية، مما يساهم بشكل أكبر في زيادة الطلب على حلول التوفر على الرفوف في أمريكا الشمالية.
رؤى إقليمية حول سوق حلول التوفر على الرفوف
لقد قام المحللون في Insight Partners بشرح الاتجاهات والعوامل الإقليمية المؤثرة على سوق حلول التوفر على الرفوف طوال فترة التوقعات بشكل شامل. يناقش هذا القسم أيضًا قطاعات سوق حلول التوفر على الرفوف والجغرافيا في جميع أنحاء أمريكا الشمالية وأوروبا ومنطقة آسيا والمحيط الهادئ والشرق الأوسط وأفريقيا وأمريكا الجنوبية والوسطى.
- احصل على البيانات الإقليمية المحددة لسوق حلول التوفر على الرفوف
نطاق تقرير سوق حلول التوفر على الرفوف
| سمة التقرير | تفاصيل |
|---|---|
| حجم السوق في عام 2023 | 4.01 مليار دولار أمريكي |
| حجم السوق بحلول عام 2031 | 8.86 مليار دولار أمريكي |
| معدل النمو السنوي المركب العالمي (2023 - 2031) | 10.4% |
| البيانات التاريخية | 2021-2022 |
| فترة التنبؤ | 2024-2031 |
| القطاعات المغطاة |
حسب المكون
|
| المناطق والدول المغطاة |
أمريكا الشمالية
|
| قادة السوق وملفات تعريف الشركات الرئيسية |
|
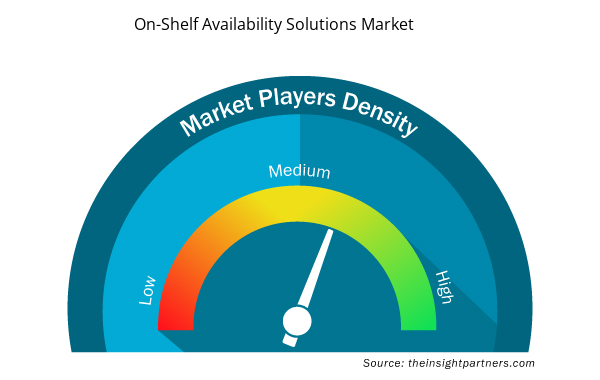
كثافة اللاعبين في سوق حلول التوفر على الرفوف: فهم تأثيرها على ديناميكيات الأعمال
يشهد سوق حلول التوفر على الرفوف نموًا سريعًا، مدفوعًا بالطلب المتزايد من المستخدم النهائي بسبب عوامل مثل تفضيلات المستهلك المتطورة والتقدم التكنولوجي والوعي الأكبر بفوائد المنتج. ومع ارتفاع الطلب، تعمل الشركات على توسيع عروضها والابتكار لتلبية احتياجات المستهلكين والاستفادة من الاتجاهات الناشئة، مما يؤدي إلى زيادة نمو السوق.
تشير كثافة اللاعبين في السوق إلى توزيع الشركات أو المؤسسات العاملة في سوق أو صناعة معينة. وهي تشير إلى عدد المنافسين (اللاعبين في السوق) الموجودين في مساحة سوق معينة نسبة إلى حجمها أو قيمتها السوقية الإجمالية.
الشركات الرئيسية العاملة في سوق حلول التوفر على الرف هي:
- مجموعة أطلس للتكنولوجيا
- شركة بي ماي آي القابضة المحدودة
- شركة آي بي إم
- حلول التجزئة
- شركة.
- ساب اس اي
إخلاء المسؤولية : الشركات المذكورة أعلاه ليست مرتبة بأي ترتيب معين.
- احصل على نظرة عامة على أهم اللاعبين الرئيسيين في سوق حلول التوفر على الرفوف
أخبار السوق والتطورات الأخيرة حول حلول التوفر على الرفوف
يتم تقييم سوق حلول التوفر على الرفوف من خلال جمع البيانات النوعية والكمية بعد البحث الأولي والثانوي، والذي يتضمن منشورات الشركات المهمة وبيانات الجمعيات وقواعد البيانات. فيما يلي قائمة بالتطورات في سوق اضطرابات الكلام واللغة والاستراتيجيات:
- أعلنت شركة Retail Velocity، الرائدة في مجال إدارة بيانات العرض والطلب الاستهلاكي وإعداد التقارير والتحليلات، عن إطلاق الجيل العاشر من منصة VELOCITY وتقديم VELOCITY Essential. يوفر VELOCITY Pro 10 الجديد أداءً متزايدًا وإدارة أسهل للبيانات وإعداد تقارير محسّنة وأمانًا إضافيًا، مما يسمح لمصنعي السلع الاستهلاكية باكتساب رؤى عملية أعمق وأسرع من أي وقت مضى؛ واتخاذ قرارات أكثر استنارة وتعاونًا داخليًا ومع شركاء التجزئة؛ ومعالجة الطلب الاستهلاكي المتغير وظروف السوق بسرعة وفعالية. (المصدر: Retail Velocity، بيان صحفي، 2022)
- أعلنت شركة Tredence Inc.، وهي شركة رائدة في مجال علوم البيانات وهندسة الذكاء الاصطناعي، عن شراكة مع Databricks، الشركة الرائدة في مجال التحليلات الموحدة التي أسسها المبدعون الأصليون لبرنامج Apache Spark. وبموجب هذه الشراكة، قامت الشركتان معًا ببناء مسرع On-Shelf Availability Solution (OSA) الذي يساعد تجار التجزئة والمصنعين على حل مشكلة نفاد المخزون من خلال الجمع بين قدرات معالجة البيانات لدى Databricks وخبرة Tredence في مجال الذكاء الاصطناعي/التعلم الآلي. (المصدر: Tredence Inc، بيان صحفي، 2021)
تقرير سوق حلول التوفر على الرفوف - التغطية والنتائج المتوقعة
يوفر تقرير "حجم سوق حلول التوفر على الرف والتوقعات (2021-2031)" تحليلاً مفصلاً للسوق يغطي المجالات التالية:
- حجم السوق والتوقعات على المستويات العالمية والإقليمية والوطنية لجميع قطاعات السوق الرئيسية التي يغطيها النطاق
- ديناميكيات السوق مثل المحركات والقيود والفرص الرئيسية
- الاتجاهات المستقبلية الرئيسية
- تحليل مفصل لقوى PEST/Porter الخمس وSWOT
- تحليل السوق العالمي والإقليمي الذي يغطي اتجاهات السوق الرئيسية واللاعبين الرئيسيين واللوائح والتطورات الأخيرة في السوق
- تحليل المشهد الصناعي والمنافسة الذي يغطي تركيز السوق، وتحليل خريطة الحرارة، واللاعبين البارزين، والتطورات الأخيرة
- ملفات تعريف الشركة التفصيلية

أنكيتا خبيرة ديناميكية في أبحاث السوق والاستشارات، تتمتع بخبرة تزيد عن 8 سنوات في قطاعات التكنولوجيا والإعلام وتكنولوجيا المعلومات والاتصالات والإلكترونيات وأشباه الموصلات. وقد قادت ونفذت بنجاح أكثر من 100 مهمة استشارية وبحثية لعملاء عالميين مثل مايكروسوفت وأوراكل وشركة NEC وSAP وKPMG وExpeditors International. تشمل كفاءاتها الأساسية تقييم السوق، وتحليل البيانات، والتنبؤ، وصياغة الاستراتيجيات، والاستخبارات التنافسية، وكتابة التقارير.
أنكيتا بارعة في إدارة دورات المشاريع الكاملة، بدءًا من تصميم عروض ما قبل البيع ومناقشات العملاء، وصولًا إلى تقديم رؤى عملية بعد البيع. كما أنها ماهرة في إدارة فرق متعددة الوظائف، وهيكلة وحدات بحثية معقدة، ومواءمة الحلول مع أهداف العمل الخاصة بالعملاء. وقد مكنتها مهاراتها الممتازة في التواصل والقيادة والعرض التقديمي من تحقيق نتائج قيّمة باستمرار في بيئات سوقية سريعة التطور.
- التحليل التاريخي (سنتان)، سنة الأساس، التوقعات (7 سنوات) مع معدل النمو السنوي المركب
- تحليل PEST و SWOT
- حجم السوق والقيمة / الحجم - عالمي، إقليمي، بلد
- الصناعة والمنافسة
- مجموعة بيانات إكسل
التقارير الحديثة
شهادات العملاء
تقرير سوق أنظمة SCADA من Insight Partners شامل، ويقدم رؤى قيّمة حول الاتجاهات الحالية والتوقعات المستقبلية. تميّز الفريق باحترافية عالية وسرعة في الاستجابة ودعم مستمر طوال الوقت. نحن راضون جدًا ونوصي بشدة بخدماتهم.
ران كيديم شريك, شركة ريالي تكنولوجيز المحدودةطلبتُ تقريرًا عن سوق برمجيات محدد، وأعدّه الفريق في غضون أيام قليلة. كانت المعلومات ذات صلة وثيقة وعرضها جيد. ثم طلبتُ بعض التعديلات والإضافات على التقرير. وكان الفريق متجاوبًا للغاية، وحصلتُ على التقرير النهائي في أقل من أسبوع.
جان هيرفيه جين رئيس مجلس الإدارة, فيوتشر أناليتيكاعملنا مع شركة "إنسايت بارتنرز" لإجراء دراسة سوقية وتوقعات مهمة. زودونا برؤى واضحة حول الفرص والمخاطر، مما ساعدنا في صياغة خططنا. كانت أبحاثهم سهلة الاستخدام ومبنية على بيانات دقيقة، مما ساعدنا على اتخاذ قرارات ذكية وواثقة. نوصي بهم بشدة.
بيوش ناجبال نائب الرئيس الأول, شعاع عالي عالميقدّمت شركة Insight Partners أبحاثًا سوقية ثاقبة ومنظمة جيدًا بخبرة واسعة في هذا المجال. تميّز فريقهم بالاحترافية وسرعة الاستجابة طوال الوقت. وسهّل موقعهم الإلكتروني سهل الاستخدام الوصول إلى تقارير القطاع. نوصي بهم بشدة لخدمات بحثية موثوقة وعالية الجودة.
يوكيهيكو أداتشي المدير التنفيذي, ديب بلو، ذ.م.م.هذه أول مرة أشتري فيها تقرير سوق من The Insight Partners. رغم أنني كنت مترددًا في البداية، إلا أنني زرت موقعهم الإلكتروني وشعرت براحة أكبر للمخاطرة وشراء تقرير السوق. أنا راضٍ تمامًا عن جودة التقرير وخدمة العملاء. كانت لديّ عدة أسئلة وتعليقات حول التقرير الأولي، ولكن بعد بضع محادثات عبر البريد الإلكتروني مع محللهم، أعتقد أن لديّ تقريرًا يمكنني استخدامه كمدخل لعملية التخطيط الاستراتيجي لدينا. شكرًا جزيلاً لكم على تخصيص وقتكم الإضافي وجعل هذه التجربة إيجابية. سأوصي بخدماتكم للآخرين بالتأكيد، وستكونون أول من ألجأ إليه عندما نحتاج إلى المزيد من بيانات السوق.
جون سوزوكي الرئيس والرئيس التنفيذي وعضو مجلس الإدارة, بي كيه تكنولوجيزأود أن أقدّر دعمكم واحترافيتكم في الاستجابة لطلبي للحصول على معلومات بشأن سوق التشخيص المخبري للأمراض المعدية في نيجيريا. كما أُقدّر صبركم وتوجيهكم، واستعدادكم لتقديم خصم، مما مكّننا في النهاية من إتمام الصفقة. أتطلع إلى التعامل مع "ذا إنسايت بارتنرز" مستقبلًا، كل ذلك بفضل الانطباع الذي تركتموه لديّ نتيجةً لهذا اللقاء الأول.
الدكتور تشيجيوك أونيا المدير الإداري, شركة باينكريست للرعاية الصحية المحدودةسبب الشراء
- اتخاذ قرارات مدروسة
- فهم ديناميكيات السوق
- تحليل المنافسة
- رؤى العملاء
- توقعات السوق
- تخفيف المخاطر
- التخطيط الاستراتيجي
- مبررات الاستثمار
- تحديد الأسواق الناشئة
- تحسين استراتيجيات التسويق
- تعزيز الكفاءة التشغيلية
- مواكبة التوجهات التنظيمية


 احصل على عينة مجانية ل - سوق حلول التوفر على الرفوف