تقرير سوق خدمات تجميع واختبار أشباه الموصلات 2031 حسب القطاعات والجغرافيا والديناميكيات والتطورات الأخيرة والرؤى الاستراتيجية
البيانات التاريخية : 2021-2022 | سنة الأساس : 2023 | فترة التنبؤ : 2024-2031حجم سوق خدمات تجميع واختبار أشباه الموصلات وتوقعاته (2021-2031)، والحصة العالمية والإقليمية، والاتجاهات، وفرص النمو. يغطي التقرير: حسب الخدمات (خدمات التجميع والتغليف وخدمات الاختبار) والتطبيقات (الإلكترونيات الاستهلاكية، والسيارات، والطبية، والصناعية، وتطبيقات أخرى)، والموقع الجغرافي.
- تاريخ التقرير : Mar 2026
- رمز التقرير : TIPRE00011144
- الفئة : الإلكترونيات وأشباه الموصلات
- الحالة : البيانات الصادرة
- تنسيقات التقارير المتاحة :


- عدد الصفحات : 150
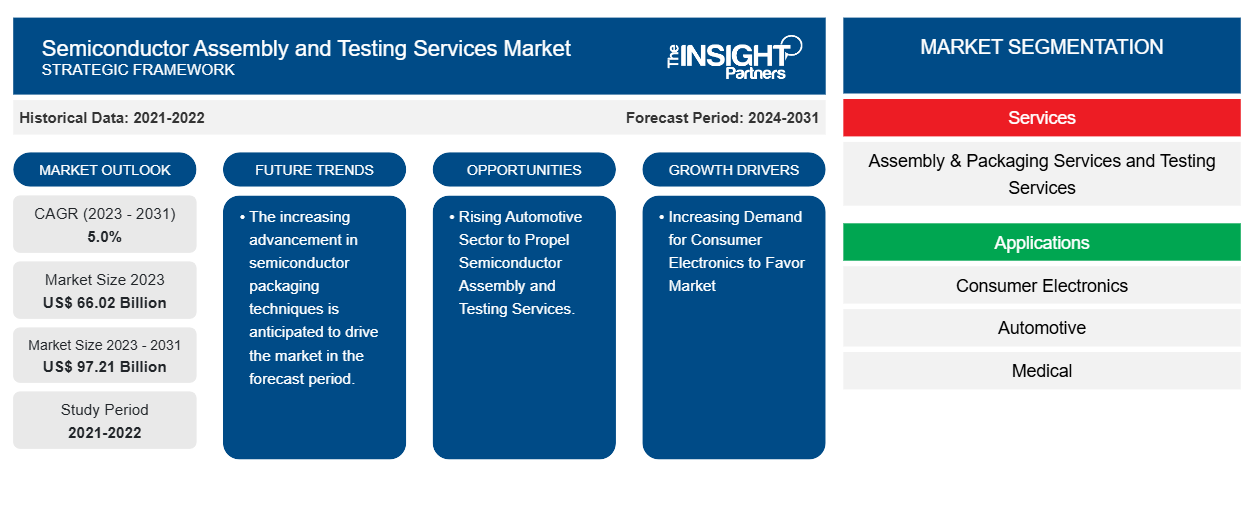
من المتوقع أن يصل حجم سوق خدمات تجميع واختبار أشباه الموصلات إلى 97.21 مليار دولار أمريكي بحلول عام 2031 من 66.02 مليار دولار أمريكي في عام 2023. ومن المتوقع أن يسجل السوق معدل نمو سنوي مركب بنسبة 5.0٪ خلال الفترة 2023-2031. من المرجح أن يكون الطلب المتزايد على الإلكترونيات الاستهلاكية والاستخدام العالي لأجهزة أشباه الموصلات في الأتمتة الصناعية من المحركات والاتجاهات الرئيسية للسوق.
تحليل سوق خدمات تجميع واختبار أشباه الموصلات
يشهد سوق خدمات تجميع واختبار أشباه الموصلات نموًا كبيرًا على مستوى العالم. ويعزى هذا النمو إلى عوامل مثل الطلب المتزايد على الإلكترونيات الاستهلاكية والاستخدام الكبير لأجهزة أشباه الموصلات في الأتمتة الصناعية . وعلاوة على ذلك، من المتوقع أن يوفر قطاع السيارات الصاعد لدفع خدمات تجميع واختبار أشباه الموصلات والتقدم في تقنيات تغليف أشباه الموصلات العديد من الفرص للسوق في السنوات القادمة.
نظرة عامة على سوق خدمات تجميع واختبار أشباه الموصلات
إن تجميع أشباه الموصلات واختبارها يشكل جزءًا بالغ الأهمية من سلسلة قيمة أشباه الموصلات، حيث يتم تجميع أو تعبئة الرقائق المصنعة بواسطة مصانع أشباه الموصلات ثم اختبارها قبل استخدامها أخيرًا في المنتج المطلوب. إن الابتكارات في تجميع أشباه الموصلات واختبارها تعمل على زيادة الأداء وتقليل عامل الشكل وتقليل تكاليف رقائق أشباه الموصلات.
قم بتخصيص هذا التقرير ليناسب متطلباتك
ستحصل على تخصيص لأي تقرير - مجانًا - بما في ذلك أجزاء من هذا التقرير، أو تحليل على مستوى الدولة، وحزمة بيانات Excel، بالإضافة إلى الاستفادة من العروض والخصومات الرائعة للشركات الناشئة والجامعات
سوق خدمات تجميع واختبار أشباه الموصلات: رؤى استراتيجية
-
احصل على أهم اتجاهات السوق الرئيسية لهذا التقرير.ستتضمن هذه العينة المجانية تحليلاً للبيانات، بدءًا من اتجاهات السوق وحتى التقديرات والتوقعات.
محركات وفرص سوق خدمات تجميع واختبار أشباه الموصلات
تزايد الطلب على الأجهزة الإلكترونية الاستهلاكية لصالح السوق
أصبحت الأجهزة الإلكترونية الاستهلاكية، مثل الهواتف الذكية والأجهزة اللوحية والنظارات الذكية وسماعات الواقع الافتراضي والساعات الذكية وأساور اللياقة البدنية، تحظى بشعبية متزايدة بين المستهلكين. تخدم هذه الأجهزة أغراضًا مختلفة، بما في ذلك تتبع النشاط ومراقبة الصحة. يدفع الطلب على الأجهزة الإلكترونية الاستهلاكية الحاجة إلى خدمات تجميع واختبار أشباه الموصلات. تتوسع مجالات تطبيق الأجهزة القابلة للارتداء إلى ما هو أبعد من الإلكترونيات الاستهلاكية لتشمل الأجهزة الطبية وأجهزة الاتصالات اللاسلكية. في القطاع الطبي، هناك إمكانات نمو كبيرة لسوق خدمات تجميع واختبار أشباه الموصلات في الأجهزة الطبية القابلة للارتداء وأنظمة مراقبة الرعاية الصحية اللاسلكية حيث يخضع القطاع للتحول التكنولوجي.
قطاع السيارات الصاعد يعزز خدمات تجميع واختبار أشباه الموصلات.
من المتوقع أن يحمل قطاع السيارات الصاعد العديد من الفرص للسوق حيث تعتمد المركبات المبتكرة بشكل كبير على الإلكترونيات لمختلف الوظائف، بما في ذلك وحدات التحكم في المحرك (ECUs)، وأنظمة المعلومات والترفيه، وأنظمة مساعدة السائق المتقدمة (ADAS)، ومكونات المركبات الكهربائية. علاوة على ذلك، يساعد ظهور المركبات الكهربائية، ومساعدة السيارات، والجودة والمعايير الموثوقة، وتكامل سلسلة التوريد السوق على النمو.ECUs), infotainment systems, advanced
تقرير تحليلي لتجزئة سوق خدمات تجميع واختبار أشباه الموصلات
إن القطاعات الرئيسية التي ساهمت في اشتقاق تحليل سوق خدمات تجميع واختبار أشباه الموصلات هي الخدمات والتطبيقات.
- بناءً على المكونات، ينقسم سوق خدمات تجميع واختبار أشباه الموصلات إلى خدمات التجميع والتغليف وخدمات الاختبار. ومن المتوقع أن يحظى قطاع خدمات التجميع والتغليف بحصة سوقية كبيرة خلال فترة التوقعات.
- من حيث التطبيقات، يتم تقسيم السوق إلى إلكترونيات استهلاكية، وتطبيقات السيارات، والتطبيقات الطبية، والتطبيقات الصناعية، وغيرها من التطبيقات. ومن المتوقع أن يحظى قطاع الإلكترونيات الاستهلاكية بحصة سوقية كبيرة خلال الفترة المتوقعة.
تحليل حصة سوق خدمات تجميع واختبار أشباه الموصلات حسب المنطقة الجغرافية
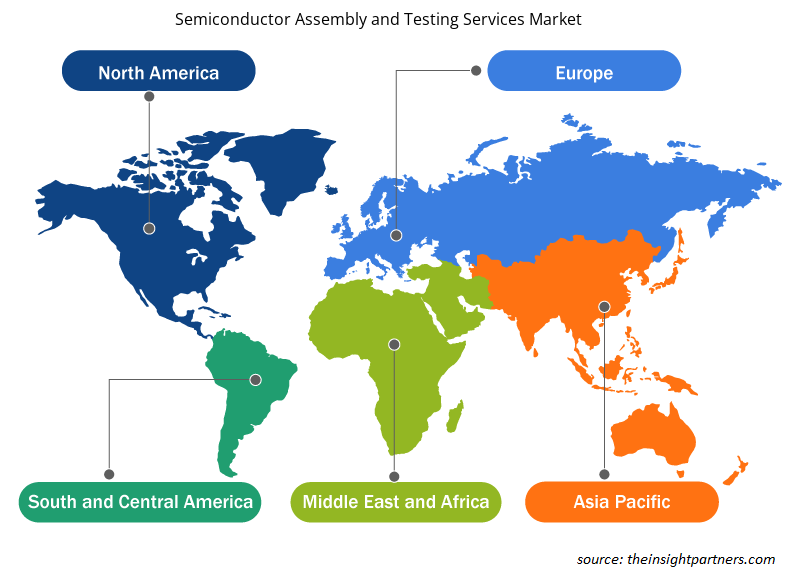
ينقسم النطاق الجغرافي لتقرير سوق خدمات تجميع واختبار أشباه الموصلات بشكل أساسي إلى خمس مناطق: أمريكا الشمالية، ومنطقة آسيا والمحيط الهادئ، وأوروبا، والشرق الأوسط وأفريقيا، وأمريكا الجنوبية والوسطى.
سيطرت أمريكا الشمالية على سوق خدمات تجميع واختبار أشباه الموصلات. وقد أدت اتجاهات تبني التكنولوجيا العالية في مختلف الصناعات في منطقة أمريكا الشمالية إلى تغذية نمو سوق خدمات تجميع واختبار أشباه الموصلات. ومن المتوقع أن تؤدي عوامل مثل زيادة اعتماد الأدوات الرقمية والإنفاق التكنولوجي المرتفع من قبل الوكالات الحكومية إلى دفع نمو سوق خدمات تجميع واختبار أشباه الموصلات في أمريكا الشمالية. ومن المرجح أن يكون الطلب المتزايد على الإلكترونيات الاستهلاكية والاستخدام العالي لأجهزة أشباه الموصلات في الأتمتة الصناعية من المحركات والاتجاهات الرئيسية للسوق. وعلاوة على ذلك، فإن التركيز القوي على البحث والتطوير في الاقتصادات المتقدمة في الولايات المتحدة وكندا يجبر اللاعبين في أمريكا الشمالية على جلب حلول متقدمة تقنيًا إلى السوق. بالإضافة إلى ذلك، يوجد في الولايات المتحدة العديد من اللاعبين في سوق خدمات تجميع واختبار أشباه الموصلات الذين يركزون بشكل متزايد على تطوير حلول مبتكرة. تساهم كل هذه العوامل في نمو سوق خدمات تجميع واختبار أشباه الموصلات في المنطقة.
رؤى إقليمية حول سوق خدمات تجميع واختبار أشباه الموصلات
لقد قام المحللون في Insight Partners بشرح الاتجاهات والعوامل الإقليمية المؤثرة على سوق خدمات تجميع واختبار أشباه الموصلات طوال فترة التوقعات بشكل شامل. يناقش هذا القسم أيضًا قطاعات سوق خدمات تجميع واختبار أشباه الموصلات والجغرافيا في جميع أنحاء أمريكا الشمالية وأوروبا ومنطقة آسيا والمحيط الهادئ والشرق الأوسط وأفريقيا وأمريكا الجنوبية والوسطى.
- احصل على البيانات الإقليمية المحددة لسوق خدمات تجميع واختبار أشباه الموصلات
نطاق تقرير سوق خدمات تجميع واختبار أشباه الموصلات
| سمة التقرير | تفاصيل |
|---|---|
| حجم السوق في عام 2023 | 66.02 مليار دولار أمريكي |
| حجم السوق بحلول عام 2031 | 97.21 مليار دولار أمريكي |
| معدل النمو السنوي المركب العالمي (2023 - 2031) | 5.0% |
| البيانات التاريخية | 2021-2022 |
| فترة التنبؤ | 2024-2031 |
| القطاعات المغطاة |
حسب الخدمات
|
| المناطق والدول المغطاة |
أمريكا الشمالية
|
| قادة السوق وملفات تعريف الشركات الرئيسية |
|
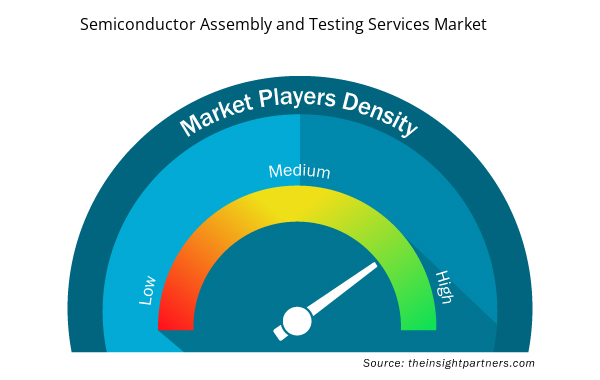
كثافة اللاعبين في سوق خدمات تجميع واختبار أشباه الموصلات: فهم تأثيرها على ديناميكيات الأعمال
يشهد سوق خدمات تجميع واختبار أشباه الموصلات نموًا سريعًا، مدفوعًا بالطلب المتزايد من المستخدم النهائي بسبب عوامل مثل تفضيلات المستهلك المتطورة والتقدم التكنولوجي والوعي المتزايد بفوائد المنتج. ومع ارتفاع الطلب، تعمل الشركات على توسيع عروضها والابتكار لتلبية احتياجات المستهلكين والاستفادة من الاتجاهات الناشئة، مما يؤدي إلى زيادة نمو السوق.
تشير كثافة اللاعبين في السوق إلى توزيع الشركات أو المؤسسات العاملة في سوق أو صناعة معينة. وهي تشير إلى عدد المنافسين (اللاعبين في السوق) الموجودين في مساحة سوق معينة نسبة إلى حجمها أو قيمتها السوقية الإجمالية.
الشركات الرئيسية العاملة في سوق خدمات تجميع واختبار أشباه الموصلات هي:
- امكور للتكنولوجيا
- مجموعة ASE
- شركة تشيبوند للتكنولوجيا
- شركة الإلكترونيات الدقيقة المتكاملة
- مجموعة جي سي إي تي المحدودة
- تقنيات انتيغرا
إخلاء المسؤولية : الشركات المذكورة أعلاه ليست مرتبة بأي ترتيب معين.
- احصل على نظرة عامة على أهم اللاعبين الرئيسيين في سوق خدمات تجميع واختبار أشباه الموصلات
أخبار السوق والتطورات الأخيرة في مجال خدمات تجميع واختبار أشباه الموصلات
يتم تقييم سوق خدمات تجميع واختبار أشباه الموصلات من خلال جمع البيانات النوعية والكمية بعد البحث الأولي والثانوي، والتي تتضمن منشورات الشركات المهمة وبيانات الجمعيات وقواعد البيانات. فيما يلي بعض التطورات في سوق خدمات تجميع واختبار أشباه الموصلات:
- افتتحت الحكومة الهندية افتراضيا منشأة "تجميع واختبار أشباه الموصلات المستعانة بمصادر خارجية" أو منشأة Osat في ساناند بولاية جوجارات، من بين مشروعين آخرين مرتبطين بأشباه الموصلات في محاولة لتعزيز مكانة الهند كقوة في مجال أشباه الموصلات.
- أبرمت شركة فوكسكون شراكة مع مجموعة HCL لتجميع أشباه الموصلات واختبارها، وهي المحاولة الثانية للشركة التايوانية لدخول مجال تصنيع الرقائق في الهند. (المصدر: موقع شركة فوكسكون، يناير 2024)
تقرير سوق خدمات تجميع واختبار أشباه الموصلات - التغطية والنتائج المتوقعة
يوفر تقرير "حجم سوق خدمات تجميع واختبار أشباه الموصلات وتوقعاته (2021-2031)" تحليلاً مفصلاً للسوق يغطي المجالات التالية:
- حجم سوق خدمات تجميع واختبار أشباه الموصلات وتوقعاته على المستويات العالمية والإقليمية والوطنية لجميع قطاعات السوق الرئيسية التي يغطيها النطاق
- اتجاهات سوق خدمات تجميع واختبار أشباه الموصلات بالإضافة إلى ديناميكيات السوق مثل المحركات والقيود والفرص الرئيسية
- تحليل مفصل لقوى PEST/Porter الخمس وSWOT
- تحليل سوق خدمات تجميع واختبار أشباه الموصلات يغطي اتجاهات السوق الرئيسية والإطار العالمي والإقليمي والجهات الفاعلة الرئيسية واللوائح والتطورات الأخيرة في السوق
- تحليل المشهد الصناعي والمنافسة الذي يغطي تركيز السوق، وتحليل خريطة الحرارة، واللاعبين البارزين، والتطورات الأخيرة في سوق خدمات تجميع واختبار أشباه الموصلات
- ملفات تعريف الشركة التفصيلية

نافين خبيرٌ متمرسٌ في أبحاث السوق والاستشارات، يتمتع بخبرةٍ تزيد عن 9 سنوات في مشاريع مُخصصة ومُشتركة واستشارية. يشغل حاليًا منصب نائب الرئيس المساعد، وقد نجح في إدارة أصحاب المصلحة عبر سلسلة قيمة المشاريع، وألّف أكثر من 100 تقرير بحثي وأكثر من 30 مهمة استشارية. يمتد نطاق عمله ليشمل مشاريع صناعية وحكومية، مساهمًا بشكل كبير في نجاح العملاء واتخاذ القرارات القائمة على البيانات.
نافين حاصلٌ على شهادة في هندسة الإلكترونيات والاتصالات من جامعة فرجينيا التقنية، كارناتاكا، وشهادة ماجستير في إدارة الأعمال في التسويق والعمليات من جامعة مانيبال. وهو عضوٌ نشطٌ في معهد مهندسي الكهرباء والإلكترونيات (IEEE) لمدة 9 سنوات، حيث شارك في مؤتمراتٍ وندواتٍ تقنية، وتطوّع على مستوى الأقسام والمناطق. قبل منصبه الحالي، عمل مستشارًا استراتيجيًا مساعدًا في IndustryARC، ومستشارًا للخوادم الصناعية في شركة هيوليت باكارد (HP Global).
- التحليل التاريخي (سنتان)، سنة الأساس، التوقعات (7 سنوات) مع معدل النمو السنوي المركب
- تحليل PEST و SWOT
- حجم السوق والقيمة / الحجم - عالمي، إقليمي، بلد
- الصناعة والمنافسة
- مجموعة بيانات إكسل
التقارير الحديثة
تقارير ذات صلة
شهادات العملاء
تقرير سوق أنظمة SCADA من Insight Partners شامل، ويقدم رؤى قيّمة حول الاتجاهات الحالية والتوقعات المستقبلية. تميّز الفريق باحترافية عالية وسرعة في الاستجابة ودعم مستمر طوال الوقت. نحن راضون جدًا ونوصي بشدة بخدماتهم.
ران كيديم شريك, شركة ريالي تكنولوجيز المحدودةطلبتُ تقريرًا عن سوق برمجيات محدد، وأعدّه الفريق في غضون أيام قليلة. كانت المعلومات ذات صلة وثيقة وعرضها جيد. ثم طلبتُ بعض التعديلات والإضافات على التقرير. وكان الفريق متجاوبًا للغاية، وحصلتُ على التقرير النهائي في أقل من أسبوع.
جان هيرفيه جين رئيس مجلس الإدارة, فيوتشر أناليتيكاعملنا مع شركة "إنسايت بارتنرز" لإجراء دراسة سوقية وتوقعات مهمة. زودونا برؤى واضحة حول الفرص والمخاطر، مما ساعدنا في صياغة خططنا. كانت أبحاثهم سهلة الاستخدام ومبنية على بيانات دقيقة، مما ساعدنا على اتخاذ قرارات ذكية وواثقة. نوصي بهم بشدة.
بيوش ناجبال نائب الرئيس الأول, شعاع عالي عالميقدّمت شركة Insight Partners أبحاثًا سوقية ثاقبة ومنظمة جيدًا بخبرة واسعة في هذا المجال. تميّز فريقهم بالاحترافية وسرعة الاستجابة طوال الوقت. وسهّل موقعهم الإلكتروني سهل الاستخدام الوصول إلى تقارير القطاع. نوصي بهم بشدة لخدمات بحثية موثوقة وعالية الجودة.
يوكيهيكو أداتشي المدير التنفيذي, ديب بلو، ذ.م.م.هذه أول مرة أشتري فيها تقرير سوق من The Insight Partners. رغم أنني كنت مترددًا في البداية، إلا أنني زرت موقعهم الإلكتروني وشعرت براحة أكبر للمخاطرة وشراء تقرير السوق. أنا راضٍ تمامًا عن جودة التقرير وخدمة العملاء. كانت لديّ عدة أسئلة وتعليقات حول التقرير الأولي، ولكن بعد بضع محادثات عبر البريد الإلكتروني مع محللهم، أعتقد أن لديّ تقريرًا يمكنني استخدامه كمدخل لعملية التخطيط الاستراتيجي لدينا. شكرًا جزيلاً لكم على تخصيص وقتكم الإضافي وجعل هذه التجربة إيجابية. سأوصي بخدماتكم للآخرين بالتأكيد، وستكونون أول من ألجأ إليه عندما نحتاج إلى المزيد من بيانات السوق.
جون سوزوكي الرئيس والرئيس التنفيذي وعضو مجلس الإدارة, بي كيه تكنولوجيزأود أن أقدّر دعمكم واحترافيتكم في الاستجابة لطلبي للحصول على معلومات بشأن سوق التشخيص المخبري للأمراض المعدية في نيجيريا. كما أُقدّر صبركم وتوجيهكم، واستعدادكم لتقديم خصم، مما مكّننا في النهاية من إتمام الصفقة. أتطلع إلى التعامل مع "ذا إنسايت بارتنرز" مستقبلًا، كل ذلك بفضل الانطباع الذي تركتموه لديّ نتيجةً لهذا اللقاء الأول.
الدكتور تشيجيوك أونيا المدير الإداري, شركة باينكريست للرعاية الصحية المحدودةسبب الشراء
- اتخاذ قرارات مدروسة
- فهم ديناميكيات السوق
- تحليل المنافسة
- رؤى العملاء
- توقعات السوق
- تخفيف المخاطر
- التخطيط الاستراتيجي
- مبررات الاستثمار
- تحديد الأسواق الناشئة
- تحسين استراتيجيات التسويق
- تعزيز الكفاءة التشغيلية
- مواكبة التوجهات التنظيمية


 احصل على عينة مجانية ل - سوق خدمات تجميع واختبار أشباه الموصلات