سوق أنظمة خطوط الأنابيب الافتراضية – المحركات والاتجاهات والفرص وإحصاءات النمو | 2031
البيانات التاريخية : 2021-2022 | سنة الأساس : 2023 | فترة التنبؤ : 2024-2031حجم سوق أنظمة خطوط الأنابيب الافتراضية وتوقعاته (2021-2031)، والحصة العالمية والإقليمية، والاتجاهات، وفرص النمو. يغطي التقرير: حسب النوع (المقطورة القياسية والمقطورة القابلة للسحب)، والغاز (الغاز الطبيعي المضغوط، والهيدروجين، وغيرها)، وتصنيف الضغط (أقل من 3000 رطل/بوصة مربعة، ومن 3001 إلى 5000 رطل/بوصة مربعة، وأكثر من 5000 رطل/بوصة مربعة)، والتطبيق (الصناعي، والنقل، والتجاري، والسكني)، والجغرافيا.
- تاريخ التقرير : Mar 2026
- رمز التقرير : TIPRE00011605
- الفئة : الطاقة والقوة
- الحالة : البيانات الصادرة
- تنسيقات التقارير المتاحة :


- عدد الصفحات : 150
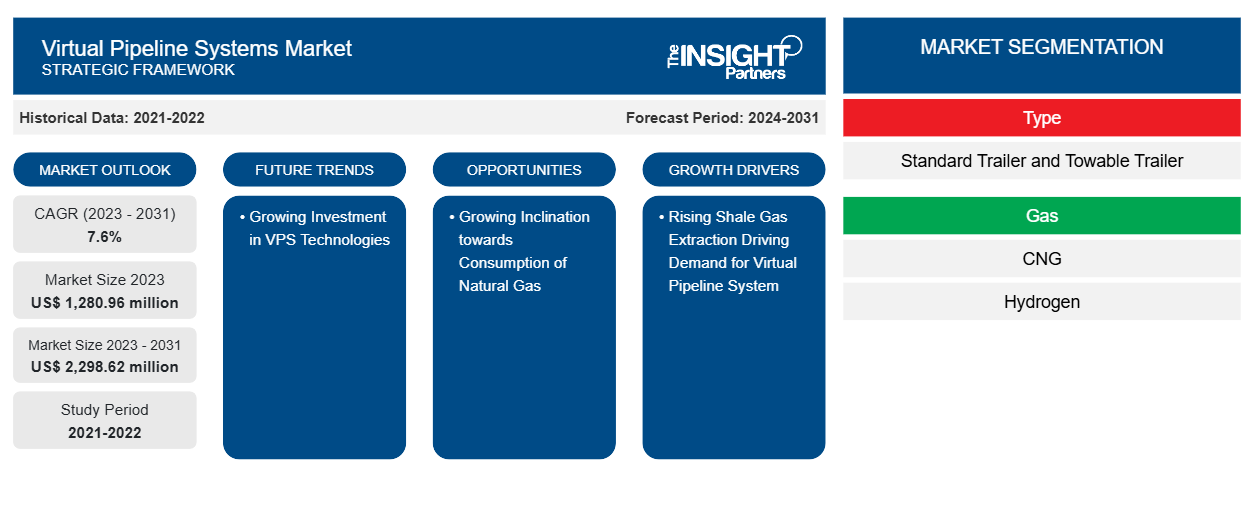
من المتوقع أن يصل حجم سوق أنظمة خطوط الأنابيب الافتراضية إلى 2,298.62 مليون دولار أمريكي بحلول عام 2031 من 1,280.96 مليون دولار أمريكي في عام 2023. ومن المتوقع أن يسجل السوق معدل نمو سنوي مركب بنسبة 7.6٪ في الفترة 2023-2031. ومن المرجح أن يظل الاستثمار المتزايد بشكل كبير في البنية التحتية لخطوط الأنابيب الافتراضية اتجاهًا رئيسيًا في سوق أنظمة خطوط الأنابيب الافتراضية.
تحليل سوق أنظمة خطوط الأنابيب الافتراضية
يشمل المستخدمون النهائيون الرئيسيون لسوق أنظمة خطوط الأنابيب الافتراضية التطبيقات البحرية والنفط والغاز والبتروكيماويات وغيرها من التطبيقات الصناعية. يشير الاستخدام المتزايد للغاز الطبيعي كوقود أحفوري أكثر نظافة واستدامة للصناعة والأسر إلى أن توريد الغاز الطبيعي المسال على مستوى العالم يمثل اتجاهًا مفيدًا. تختار شركات الشحن وشركات النفط والغاز والبتروكيماويات بشكل استراتيجي التنويع في أساطيل الغاز الطبيعي للاستفادة من هذا الاتجاه. وبالتالي، تتبنى صناعات المستخدم النهائي بشكل متزايد أنظمة خطوط الأنابيب الافتراضية التي تستفيد بشكل أكبر من ديناميكيات السوق على مدار السنوات المتوقعة.
نظرة عامة على سوق أنظمة خطوط الأنابيب الافتراضية
يتيح خط الأنابيب الافتراضي نقل الغاز الطبيعي المتجدد أو الغاز الحيوي الملتقط من المواقع الزراعية إلى المستخدمين النهائيين. وبالتالي، من المتوقع أن يؤدي التركيز المتزايد على تحقيق صافي الصفر والتركيز على الطاقة الخضراء وإدارة الطاقة المتجددة إلى تغذية نمو السوق خلال فترة التوقعات. إن تشجيع المبادرات الحكومية لتعزيز الطلب على إمدادات الغاز الطبيعي في المناطق الصناعية والتجارية يزيد من نمو السوق. في الولايات المتحدة، من المتوقع أن يؤثر التمويل الحكومي المتزايد لصناعة النفط والغاز مع زيادة أنشطة الإنتاج والاستكشاف بشكل إيجابي على نمو السوق.
قم بتخصيص هذا التقرير ليناسب متطلباتك
ستحصل على تخصيص لأي تقرير - مجانًا - بما في ذلك أجزاء من هذا التقرير، أو تحليل على مستوى الدولة، وحزمة بيانات Excel، بالإضافة إلى الاستفادة من العروض والخصومات الرائعة للشركات الناشئة والجامعات
سوق أنظمة خطوط الأنابيب الافتراضية: رؤى استراتيجية
-
احصل على أهم اتجاهات السوق الرئيسية لهذا التقرير.ستتضمن هذه العينة المجانية تحليلاً للبيانات، بدءًا من اتجاهات السوق وحتى التقديرات والتوقعات.
محركات وفرص سوق أنظمة خطوط الأنابيب الافتراضية
استخراج الغاز الصخري المتزايد يعزز الطلب على نظام خطوط الأنابيب الافتراضية
لقد أدى التطور المستمر في إجراءات حفر الصخر الزيتي إلى جعل الصخر الزيتي أحد مصادر الطاقة الثابتة. ويمكن استغلال الغاز الصخري كبديل للطاقة النظيفة في البلدان التي تعتمد على الفحم كمصدر للطاقة، لأنه ينبعث منه كمية أقل من الكربون مقارنة بالفحم. وقد أدى إنتاج الغاز الصخري إلى وفرة إمدادات الغاز الطبيعي في جميع أنحاء العالم. إن الزيادة في مشاريع استكشاف واستخراج الغاز الصخري بسبب التطورات في التكنولوجيات ذات الصلة، إلى جانب توافر عدد كبير من الاحتياطيات، تعمل على تعزيز الطلب على أنظمة خطوط الأنابيب الافتراضية، وبالتالي زيادة تطوير السوق.shales one of the consistent energy resource. Shale gas can be exploited as a cleaner energy alternatives in countries that are dependent on coal as an energy source, as it emits less carbon than coal. Shale gas production has ensued the plenty of natural gas supply worldwide. The increase in shell gas exploration and extraction projects due to developments in related technologies, coupled with the availability of a large number of reserves, is enhancing the demand for virtual pipeline systems, thereby increasing market development.
الطلب المتزايد على الغاز الطبيعي – فرصة في سوق أنظمة خطوط الأنابيب الافتراضية
ومن المتوقع أن يوفر التركيز والاستثمار المتزايد في مجال البحث والتطوير في مجال الغاز الطبيعي من قبل شركات النفط والغاز والطاقة آفاق نمو كبيرة للتطور المستقبلي للشركات في سوق أنظمة خطوط الأنابيب الافتراضية. وتستند أنشطة البحث والتطوير هذه بشكل أساسي إلى هدفها المتمثل في تعزيز استخدام منتجات الغاز الطبيعي منخفضة الانبعاثات . وكان شيخوخة البنية الأساسية لخطوط الأنابيب مصدر قلق رئيسي للحكومات على مستوى العالم. ونتيجة لذلك، تسعى الحكومات جاهدة لإيجاد بدائل للطرق القياسية لنقل النفط والغاز. وبالتالي، من المتوقع أن تخلق اللوائح الحكومية الصارمة لضمان حماية البيئة من انبعاثات الكربون وانسكاب النفط فرصًا مربحة لبائعي سوق خطوط الأنابيب الافتراضية.
تقرير تحليل تجزئة سوق أنظمة خطوط الأنابيب الافتراضية
إن القطاعات الرئيسية التي ساهمت في اشتقاق تحليل سوق أنظمة خطوط الأنابيب الافتراضية هي النوع والغاز وتصنيف الضغط والتطبيق.
- بناءً على النوع، تم تقسيم سوق أنظمة الأنابيب الافتراضية إلى مقطورة قياسية ومقطورة قابلة للسحب. احتلت شريحة المقطورات القياسية حصة سوقية أكبر في عام 2023.
- من حيث الغاز، تم تقسيم السوق إلى الغاز الطبيعي المضغوط والهيدروجين وغيرها. يهيمن قطاع الغاز الطبيعي المضغوط على السوق في عام 2023.
- من حيث تصنيف الضغط، تم تقسيم السوق إلى أقل من 3000 رطل/بوصة مربعة، ومن 3001 إلى 5000 رطل/بوصة مربعة، وأكثر من 5000 رطل/بوصة مربعة. وقد هيمنت شريحة 3001 إلى 5000 رطل/بوصة مربعة على السوق في عام 2023.
- من حيث التطبيق، تم تقسيم السوق إلى قطاعات صناعية ونقل وتجاري وسكني. وقد هيمن قطاع النقل على السوق في عام 2023.
تحليل حصة سوق أنظمة خطوط الأنابيب الافتراضية حسب المنطقة الجغرافية
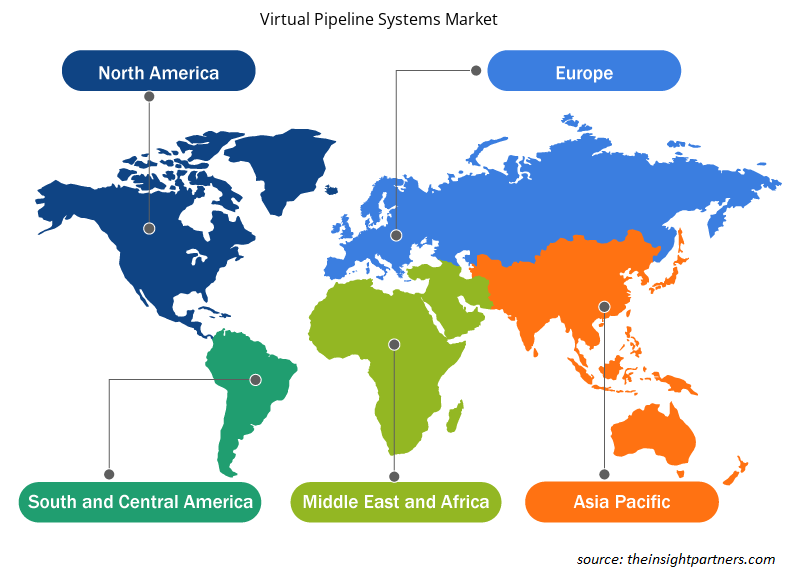
ينقسم النطاق الجغرافي لتقرير سوق أنظمة خطوط الأنابيب الافتراضية بشكل أساسي إلى خمس مناطق: أمريكا الشمالية، ومنطقة آسيا والمحيط الهادئ، وأوروبا، والشرق الأوسط وأفريقيا، وأمريكا الجنوبية/أمريكا الجنوبية والوسطى.
تتصدر أمريكا الشمالية سوق أنظمة خطوط الأنابيب الافتراضية. وتعد الولايات المتحدة وكندا والمكسيك من بين الاقتصادات الرئيسية في أمريكا الشمالية. ويعزى نمو سوق أنظمة خطوط الأنابيب الافتراضية في أمريكا الشمالية بشكل أساسي إلى زيادة تجارة الغاز الطبيعي المسال، وتطوير البنية التحتية للغاز الطبيعي الجاري، وزيادة قدرات توليد الطاقة التي تعمل بالغاز. وستعزز المشاريع الجديدة وإنتاج الغاز الصخري الكبير في حوض بيرميان التنمية الشاملة للمنطقة. ومن بين شركات أنظمة خطوط الأنابيب الافتراضية الرئيسية العاملة في أمريكا الشمالية شركة Certarus Ltd. وThrottle Energy Inc. Technology وClean Fuel Connection Inc. وCompass Natural Gas وNG Advantage وCNG Delivery وTX Energy Drilling Corporation وCorban Energy Group. وقد انجذبت العديد من الشركات إلى إمكانات الإنتاج القوية التي تتمتع بها أمريكا الشمالية، مما أدى إلى إنفاق كبير على بناء البنية التحتية لخطوط أنابيب الغاز الطبيعي، وهو ما يقود نمو سوق أنظمة خطوط الأنابيب الافتراضية في أمريكا الشمالية.
رؤى إقليمية حول سوق أنظمة خطوط الأنابيب الافتراضية
لقد قام المحللون في Insight Partners بشرح الاتجاهات والعوامل الإقليمية المؤثرة على سوق أنظمة الأنابيب الافتراضية طوال فترة التوقعات بشكل شامل. يناقش هذا القسم أيضًا قطاعات سوق أنظمة الأنابيب الافتراضية والجغرافيا في جميع أنحاء أمريكا الشمالية وأوروبا ومنطقة آسيا والمحيط الهادئ والشرق الأوسط وأفريقيا وأمريكا الجنوبية والوسطى.
- احصل على البيانات الإقليمية المحددة لسوق أنظمة خطوط الأنابيب الافتراضية
نطاق تقرير سوق أنظمة الأنابيب الافتراضية
| سمة التقرير | تفاصيل |
|---|---|
| حجم السوق في عام 2023 | 1,280.96 مليون دولار أمريكي |
| حجم السوق بحلول عام 2031 | 2,298.62 مليون دولار أمريكي |
| معدل النمو السنوي المركب العالمي (2023 - 2031) | 7.6% |
| البيانات التاريخية | 2021-2022 |
| فترة التنبؤ | 2024-2031 |
| القطاعات المغطاة |
حسب النوع
|
| المناطق والدول المغطاة |
أمريكا الشمالية
|
| قادة السوق وملفات تعريف الشركات الرئيسية |
|
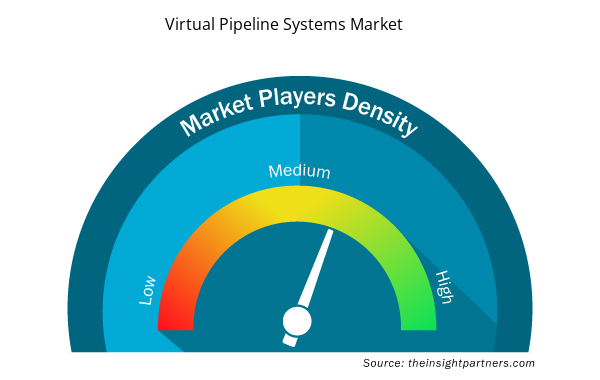
كثافة اللاعبين في السوق: فهم تأثيرها على ديناميكيات الأعمال
يشهد سوق أنظمة خطوط الأنابيب الافتراضية نموًا سريعًا، مدفوعًا بالطلب المتزايد من المستخدم النهائي بسبب عوامل مثل تفضيلات المستهلكين المتطورة والتقدم التكنولوجي والوعي المتزايد بفوائد المنتج. ومع ارتفاع الطلب، تعمل الشركات على توسيع عروضها والابتكار لتلبية احتياجات المستهلكين والاستفادة من الاتجاهات الناشئة، مما يؤدي إلى زيادة نمو السوق.
تشير كثافة اللاعبين في السوق إلى توزيع الشركات أو المؤسسات العاملة في سوق أو صناعة معينة. وهي تشير إلى عدد المنافسين (اللاعبين في السوق) الموجودين في مساحة سوق معينة نسبة إلى حجمها أو قيمتها السوقية الإجمالية.
الشركات الرئيسية العاملة في سوق أنظمة خطوط الأنابيب الافتراضية هي:
- بايوتك، المحدودة
- شركة خدمات الغاز الطبيعي المضغوط المحدودة
- بتروليام ناسيونال بيرهاد (بتروناس)
- شركة راج النمسا ايه جي
- شركة كوانتوم فيول سيستمز المحدودة
- شركة جاليليو للتكنولوجيا
إخلاء المسؤولية : الشركات المذكورة أعلاه ليست مرتبة بأي ترتيب معين.
- احصل على نظرة عامة على أهم اللاعبين الرئيسيين في سوق أنظمة الأنابيب الافتراضية
أخبار سوق أنظمة خطوط الأنابيب الافتراضية والتطورات الأخيرة
يتم تقييم سوق أنظمة خطوط الأنابيب الافتراضية من خلال جمع البيانات النوعية والكمية بعد البحث الأولي والثانوي، والذي يتضمن منشورات الشركات المهمة وبيانات الجمعيات وقواعد البيانات. فيما يلي قائمة بالتطورات في السوق فيما يتعلق بالابتكارات وتوسيع الأعمال والاستراتيجيات:
- في يناير 2022، سلمت شركة بتروناس 1000 طن من الغاز الطبيعي المسال باستخدام نظام خط الأنابيب الافتراضي وتقنية 40 VPS و41. وقد قدم حل بتروناس الإبداعي، الذي بدأ العمل في عام 2020، للمستهلكين خارج الشبكة أكثر من 16 مليون كيلوجرام من الطاقة المنخفضة الكربون باستخدام مركبات مجهزة بخزانات مبردة. (المصدر: بتروناس، بيان صحفي/موقع الشركة على الويب/النشرة الإخبارية)
- في مايو 2022، استحوذت شركة Chart Industries, Inc. على شركة CSC Cryogenic Service Center AB لتعزيز وجودها في منطقة الشمال الأوروبي. (المصدر: Chart Industries, Inc.، بيان صحفي/موقع الشركة على الويب/النشرة الإخبارية)
تقرير سوق أنظمة الأنابيب الافتراضية والتغطية والنتائج المتوقعة
يوفر تقرير "حجم سوق أنظمة خطوط الأنابيب الافتراضية والتوقعات (2021-2031)" تحليلاً مفصلاً للسوق يغطي المجالات التالية:
- حجم سوق أنظمة خطوط الأنابيب الافتراضية والتوقعات على المستويات العالمية والإقليمية والوطنية لجميع قطاعات السوق الرئيسية المغطاة ضمن النطاق
- ديناميكيات السوق مثل المحركات والقيود والفرص الرئيسية
- اتجاهات سوق أنظمة خطوط الأنابيب الافتراضية
- تحليل مفصل لـ PEST و SWOT
- تحليل سوق أنظمة خطوط الأنابيب الافتراضية يغطي اتجاهات السوق الرئيسية والإطار العالمي والإقليمي والجهات الفاعلة الرئيسية واللوائح والتطورات الأخيرة في السوق
- سوق أنظمة خطوط الأنابيب الافتراضية تحليل الصناعة والمناظر الطبيعية والمنافسة، وتغطية تركيز السوق، وتحليل خريطة الحرارة، واللاعبين البارزين، والتطورات الأخيرة
- ملفات تعريف الشركة التفصيلية

نيفيديتا خبيرة أبحاث مُتميزة، تتمتع بخبرة تزيد عن 9 سنوات في أبحاث السوق واستشارات الأعمال. تشغل حاليًا منصب مديرة مشاريع في مجال تكنولوجيا المعلومات والاتصالات لدى شركة "ذا إنسايت بارتنرز"، وتتمتع بخبرة واسعة في إدارة وتنفيذ مهام الأبحاث المُجمعة والمُخصصة والقائمة على الاشتراكات والاستشارات في مختلف قطاعات التكنولوجيا.
بفضل سجلها الحافل في تقديم تحليلات قائمة على البيانات ورؤى عملية، ساهمت نيفيديتا بشكل رئيسي في العديد من المشاريع الحيوية. يشمل عملها تنفيذ المشاريع من البداية إلى النهاية، بدءًا من فهم أهداف العملاء، وتحليل اتجاهات السوق، وصولًا إلى استخلاص التوصيات الاستراتيجية. وقد تعاونت على نطاق واسع مع شركات رائدة في مجال تكنولوجيا المعلومات والاتصالات، مما ساعدها على تحديد فرص السوق ومواكبة تحولات القطاع.
تحمل نيفيديتا ماجستير إدارة أعمال في الإدارة من شركة "آي إم إس" في دهرادون. قبل انضمامها إلى "ذا إنسايت بارتنرز"، اكتسبت خبرة قيّمة في شركتي "ماركتس آند ماركتس" و"فيوتشر ماركت إنسايتس" في بونا، حيث شغلت مناصب بحثية مُختلفة وبنت أساسًا قويًا في تحليل القطاع والتفاعل مع العملاء.
- التحليل التاريخي (سنتان)، سنة الأساس، التوقعات (7 سنوات) مع معدل النمو السنوي المركب
- تحليل PEST و SWOT
- حجم السوق والقيمة / الحجم - عالمي، إقليمي، بلد
- الصناعة والمنافسة
- مجموعة بيانات إكسل
التقارير الحديثة
شهادات العملاء
تقرير سوق أنظمة SCADA من Insight Partners شامل، ويقدم رؤى قيّمة حول الاتجاهات الحالية والتوقعات المستقبلية. تميّز الفريق باحترافية عالية وسرعة في الاستجابة ودعم مستمر طوال الوقت. نحن راضون جدًا ونوصي بشدة بخدماتهم.
ران كيديم شريك, شركة ريالي تكنولوجيز المحدودةطلبتُ تقريرًا عن سوق برمجيات محدد، وأعدّه الفريق في غضون أيام قليلة. كانت المعلومات ذات صلة وثيقة وعرضها جيد. ثم طلبتُ بعض التعديلات والإضافات على التقرير. وكان الفريق متجاوبًا للغاية، وحصلتُ على التقرير النهائي في أقل من أسبوع.
جان هيرفيه جين رئيس مجلس الإدارة, فيوتشر أناليتيكاعملنا مع شركة "إنسايت بارتنرز" لإجراء دراسة سوقية وتوقعات مهمة. زودونا برؤى واضحة حول الفرص والمخاطر، مما ساعدنا في صياغة خططنا. كانت أبحاثهم سهلة الاستخدام ومبنية على بيانات دقيقة، مما ساعدنا على اتخاذ قرارات ذكية وواثقة. نوصي بهم بشدة.
بيوش ناجبال نائب الرئيس الأول, شعاع عالي عالميقدّمت شركة Insight Partners أبحاثًا سوقية ثاقبة ومنظمة جيدًا بخبرة واسعة في هذا المجال. تميّز فريقهم بالاحترافية وسرعة الاستجابة طوال الوقت. وسهّل موقعهم الإلكتروني سهل الاستخدام الوصول إلى تقارير القطاع. نوصي بهم بشدة لخدمات بحثية موثوقة وعالية الجودة.
يوكيهيكو أداتشي المدير التنفيذي, ديب بلو، ذ.م.م.هذه أول مرة أشتري فيها تقرير سوق من The Insight Partners. رغم أنني كنت مترددًا في البداية، إلا أنني زرت موقعهم الإلكتروني وشعرت براحة أكبر للمخاطرة وشراء تقرير السوق. أنا راضٍ تمامًا عن جودة التقرير وخدمة العملاء. كانت لديّ عدة أسئلة وتعليقات حول التقرير الأولي، ولكن بعد بضع محادثات عبر البريد الإلكتروني مع محللهم، أعتقد أن لديّ تقريرًا يمكنني استخدامه كمدخل لعملية التخطيط الاستراتيجي لدينا. شكرًا جزيلاً لكم على تخصيص وقتكم الإضافي وجعل هذه التجربة إيجابية. سأوصي بخدماتكم للآخرين بالتأكيد، وستكونون أول من ألجأ إليه عندما نحتاج إلى المزيد من بيانات السوق.
جون سوزوكي الرئيس والرئيس التنفيذي وعضو مجلس الإدارة, بي كيه تكنولوجيزأود أن أقدّر دعمكم واحترافيتكم في الاستجابة لطلبي للحصول على معلومات بشأن سوق التشخيص المخبري للأمراض المعدية في نيجيريا. كما أُقدّر صبركم وتوجيهكم، واستعدادكم لتقديم خصم، مما مكّننا في النهاية من إتمام الصفقة. أتطلع إلى التعامل مع "ذا إنسايت بارتنرز" مستقبلًا، كل ذلك بفضل الانطباع الذي تركتموه لديّ نتيجةً لهذا اللقاء الأول.
الدكتور تشيجيوك أونيا المدير الإداري, شركة باينكريست للرعاية الصحية المحدودةسبب الشراء
- اتخاذ قرارات مدروسة
- فهم ديناميكيات السوق
- تحليل المنافسة
- رؤى العملاء
- توقعات السوق
- تخفيف المخاطر
- التخطيط الاستراتيجي
- مبررات الاستثمار
- تحديد الأسواق الناشئة
- تحسين استراتيجيات التسويق
- تعزيز الكفاءة التشغيلية
- مواكبة التوجهات التنظيمية


 احصل على عينة مجانية ل - سوق أنظمة خطوط الأنابيب الافتراضية