تحليل وتوقعات سوق إدارة وسائل التواصل الاجتماعي حسب الحجم والمشاركة والنمو والاتجاهات 2031
البيانات التاريخية : 2021-2022 | سنة الأساس : 2023 | فترة التنبؤ : 2024-2031حجم سوق إدارة وسائل التواصل الاجتماعي وتوقعاته (2021 - 2031)، والحصة العالمية والإقليمية، والاتجاه، وتحليل فرص النمو، وتغطية التقرير: حسب المكون (الحل والخدمة)، والنشر (محليًا ومبنيًا على السحابة)، وحجم المؤسسة [الشركات الصغيرة والمتوسطة والشركات الكبيرة]، والتطبيق (إدارة المبيعات والتسويق، وإدارة تجربة العملاء، والاستخبارات التنافسية، وإدارة المخاطر والكشف عن الاحتيال)، والعمودي (تكنولوجيا المعلومات والاتصالات، والخدمات المصرفية والمالية والتأمين، والرعاية الصحية، والإعلام والترفيه، وتجارة التجزئة، وغيرها)، والجغرافيا.
- تاريخ التقرير : Mar 2026
- رمز التقرير : TIPRE00003875
- الفئة : التكنولوجيا والإعلام والاتصالات
- الحالة : البيانات الصادرة
- تنسيقات التقارير المتاحة :


- عدد الصفحات : 150
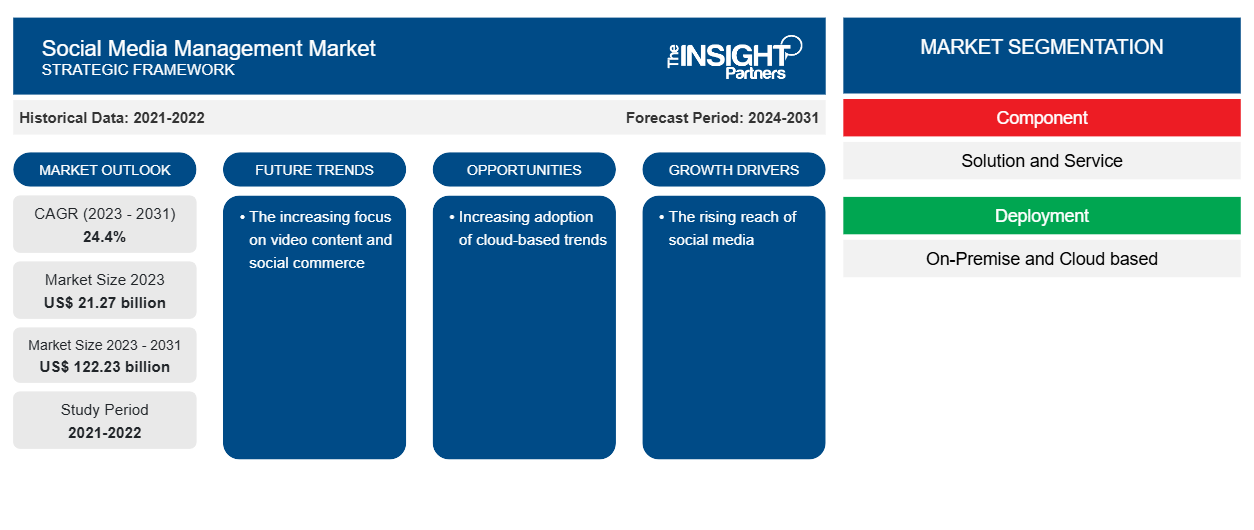
من المتوقع أن يصل حجم سوق إدارة وسائل التواصل الاجتماعي إلى 122.23 مليار دولار أمريكي بحلول عام 2031 من 21.27 مليار دولار أمريكي في عام 2023. ومن المتوقع أن يسجل السوق معدل نمو سنوي مركب بنسبة 24.4٪ خلال الفترة 2023-2031. ومن المرجح أن يظل التركيز المتزايد على محتوى الفيديو والتجارة الاجتماعية اتجاهًا رئيسيًا في السوق.
تحليل سوق إدارة وسائل التواصل الاجتماعي
تتبنى الشركات الصغيرة والمتوسطة الحجم بشكل متزايد إدارة وسائل التواصل الاجتماعي بسبب العدد المتزايد من الشركات الصغيرة والمتوسطة الحجم وتحول التركيز إلى التسويق عبر الإنترنت، مثل التسويق عبر وسائل التواصل الاجتماعي. يعد التفاعل مع الأشخاص على وسائل التواصل الاجتماعي استراتيجية تسويقية مهمة للشركات الصغيرة. يساعد استخدام وسائل التواصل الاجتماعي الشركة على زيادة الوعي بعلامتها التجارية، وزيادة قاعدة عملاء الشركة، والتواصل مع العملاء الحاليين. من السهل على أصحاب الأعمال الصغيرة الانخراط في التسويق من خلال وسائل التواصل الاجتماعي، طالما أن الشركة تنشر على صفحات وسائل التواصل الاجتماعي، وهو نهج تسويقي فعال من حيث التكلفة. تعد Facebook وInstagram وTwitter وLinkedIn وPinterest من منصات التواصل الاجتماعي الشهيرة.
نظرة عامة على سوق إدارة وسائل التواصل الاجتماعي
إدارة وسائل التواصل الاجتماعي هي عملية تتضمن جدولة النشر وإنشاء المحتوى والتفاعل مع المستخدمين وتطوير استراتيجية ومراقبة الأداء وزيادة ظهور حسابات الشركة على وسائل التواصل الاجتماعي . إنها تسهل عليك إقامة علاقات مع المشتركين ونشر المنشورات ذات الصلة. تعد إدارة وسائل التواصل الاجتماعي حافزًا لنتيجة تجارية إيجابية. يعزز الوجود القوي على وسائل التواصل الاجتماعي من وعي العلامة التجارية ويعزز خدمة العملاء ويوسع نطاق وصولها إلى جماهير جديدة. يمكن أن توفر تعاونات المؤثرين اتصالات دائمة مع الجمهور. يمكن للصور والنصوص الإبداعية أن تغير تصور الأفراد في المؤسسة.
قم بتخصيص هذا التقرير ليناسب متطلباتك
ستحصل على تخصيص لأي تقرير - مجانًا - بما في ذلك أجزاء من هذا التقرير، أو تحليل على مستوى الدولة، وحزمة بيانات Excel، بالإضافة إلى الاستفادة من العروض والخصومات الرائعة للشركات الناشئة والجامعات
سوق إدارة وسائل التواصل الاجتماعي: رؤى استراتيجية
-
احصل على أهم اتجاهات السوق الرئيسية لهذا التقرير.ستتضمن هذه العينة المجانية تحليلاً للبيانات، بدءًا من اتجاهات السوق وحتى التقديرات والتوقعات.
محركات وفرص سوق إدارة وسائل التواصل الاجتماعي
الانتشار المتزايد لوسائل التواصل الاجتماعي
على مدار السنوات القليلة الماضية، أكدت العديد من دراسات وسائل التواصل الاجتماعي تفوق إنستغرام في الأداء على فيسبوك. وقد أثبت إنستغرام أنه الخيار الأفضل لأغراض التسويق، بغض النظر عن زيادة نطاقه وتفاعله ومؤشرات الأداء الرئيسية الأخرى. في بداية عام 2023، بلغ متوسط معدل الوصول لإنستغرام 9.34%، بينما بلغ متوسط معدل الوصول لفيسبوك 4.32% و3.2%. وعلى مدار عام 2023، انخفض متوسط معدل الوصول لإنستغرام ليصل إلى 7.60% في بداية عام 2024. وبالتالي، يتزايد الطلب على برامج إدارة وسائل التواصل الاجتماعي.
زيادة اعتماد الاتجاهات القائمة على السحابة
هناك العديد من الأسباب التي تدفعنا إلى تبني تقنيات الحوسبة السحابية. ومن بين الفوائد الأكثر شيوعًا تحسين المرونة والكفاءة وقابلية التوسع. وعلاوة على ذلك، فإن نموذج الدفع مقابل الاستخدام للعديد من الخدمات السحابية يمكن أن يوفر لك المال من التكاليف الأولية ويساعدك في إدارة مواردك. في السنوات الأخيرة، أصبحت الحوسبة السحابية شائعة بشكل متزايد مع تبني المزيد والمزيد من الشركات للحلول المستندة إلى الحوسبة السحابية. وبالتالي، فإن التبني المتزايد للهواتف الذكية كناقل للهجوم يخلق المزيد من الفرص للسوق.
تقرير تحليل تجزئة سوق إدارة وسائل التواصل الاجتماعي
إن القطاعات الرئيسية التي ساهمت في استنباط تحليل سوق إدارة وسائل التواصل الاجتماعي هي المكون والنشر والتطبيق والعمودي.
- بناءً على الحل، ينقسم سوق إدارة وسائل التواصل الاجتماعي إلى حلول وخدمات. احتل قطاع الحلول حصة سوقية أكبر في عام 2023.
- من حيث النشر، يتم تقسيم السوق إلى محلي ومبني على السحابة. احتل قطاع السحابة حصة سوقية أكبر في عام 2023.
- بحسب حجم المؤسسة، يتم تقسيم السوق إلى مؤسسات صغيرة ومتوسطة الحجم ومؤسسات كبيرة.
- حسب التطبيق، يتم تقسيم السوق إلى إدارة المبيعات والتسويق، وإدارة تجربة العملاء، والاستخبارات التنافسية، وإدارة المخاطر، والكشف عن الاحتيال.
- حسب القطاع الرأسي، يتم تقسيم السوق إلى تكنولوجيا المعلومات والاتصالات، والخدمات المصرفية والمالية والتأمين، والرعاية الصحية، والإعلام والترفيه، وتجارة التجزئة، وغيرها.
تحليل حصة سوق إدارة وسائل التواصل الاجتماعي حسب المنطقة الجغرافية
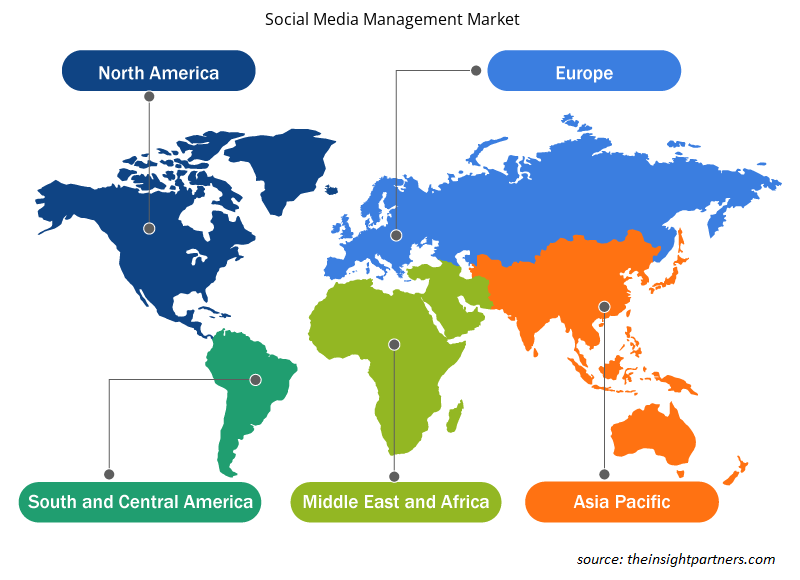
ينقسم النطاق الجغرافي لتقرير سوق إدارة وسائل التواصل الاجتماعي بشكل أساسي إلى خمس مناطق: أمريكا الشمالية، ومنطقة آسيا والمحيط الهادئ، وأوروبا، والشرق الأوسط وأفريقيا، وأمريكا الجنوبية والوسطى.
يشهد سوق إدارة وسائل التواصل الاجتماعي نموًا سريعًا في منطقة آسيا والمحيط الهادئ. وهناك عوامل مختلفة تدفع السوق في منطقة آسيا والمحيط الهادئ، مثل الاستخدام المتزايد لوسائل التواصل الاجتماعي، وانتشار الإنترنت، والمشهد الرقمي المتنامي. وبالتالي، فإن اعتماد أمان نقاط النهاية يتزايد بشكل متزايد في البلاد.
رؤى إقليمية حول سوق إدارة وسائل التواصل الاجتماعي
لقد قام المحللون في Insight Partners بشرح الاتجاهات والعوامل الإقليمية المؤثرة على سوق إدارة وسائل التواصل الاجتماعي طوال فترة التوقعات بشكل شامل. يناقش هذا القسم أيضًا قطاعات سوق إدارة وسائل التواصل الاجتماعي والجغرافيا في جميع أنحاء أمريكا الشمالية وأوروبا ومنطقة آسيا والمحيط الهادئ والشرق الأوسط وأفريقيا وأمريكا الجنوبية والوسطى.
- احصل على البيانات الإقليمية المحددة لسوق إدارة وسائل التواصل الاجتماعي
نطاق تقرير سوق إدارة وسائل التواصل الاجتماعي
| سمة التقرير | تفاصيل |
|---|---|
| حجم السوق في عام 2023 | 21.27 مليار دولار أمريكي |
| حجم السوق بحلول عام 2031 | 122.23 مليار دولار أمريكي |
| معدل النمو السنوي المركب العالمي (2023 - 2031) | 24.4% |
| البيانات التاريخية | 2021-2022 |
| فترة التنبؤ | 2024-2031 |
| القطاعات المغطاة |
حسب المكون
|
| المناطق والدول المغطاة |
أمريكا الشمالية
|
| قادة السوق وملفات تعريف الشركات الرئيسية |
|
كثافة اللاعبين في سوق إدارة وسائل التواصل الاجتماعي: فهم تأثيرها على ديناميكيات الأعمال
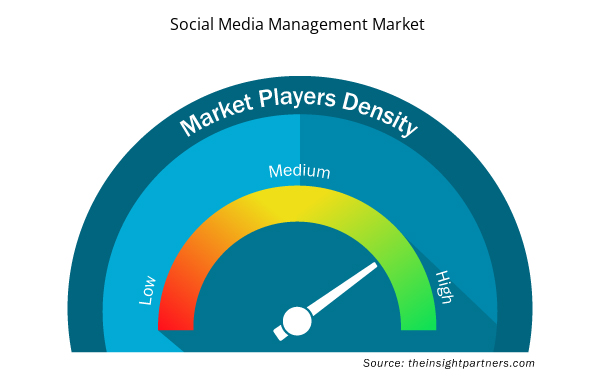
يشهد سوق إدارة وسائل التواصل الاجتماعي نموًا سريعًا، مدفوعًا بالطلب المتزايد من المستخدم النهائي بسبب عوامل مثل تفضيلات المستهلكين المتطورة والتقدم التكنولوجي والوعي المتزايد بفوائد المنتج. ومع ارتفاع الطلب، تعمل الشركات على توسيع عروضها والابتكار لتلبية احتياجات المستهلكين والاستفادة من الاتجاهات الناشئة، مما يؤدي إلى زيادة نمو السوق.
تشير كثافة اللاعبين في السوق إلى توزيع الشركات أو المؤسسات العاملة في سوق أو صناعة معينة. وهي تشير إلى عدد المنافسين (اللاعبين في السوق) الموجودين في مساحة سوق معينة نسبة إلى حجمها أو قيمتها السوقية الإجمالية.
الشركات الرئيسية العاملة في سوق إدارة وسائل التواصل الاجتماعي هي:
- أدوبي
- شركة آي بي إم
- شركة جوجل المحدودة
- شركة أوراكل
- شركة Salesforce.com
- شركة هب سبوت
إخلاء المسؤولية : الشركات المذكورة أعلاه ليست مرتبة بأي ترتيب معين.
- احصل على نظرة عامة على أهم اللاعبين الرئيسيين في سوق إدارة وسائل التواصل الاجتماعي
أخبار سوق إدارة وسائل التواصل الاجتماعي والتطورات الأخيرة
يتم تقييم سوق إدارة وسائل التواصل الاجتماعي من خلال جمع البيانات النوعية والكمية بعد البحث الأولي والثانوي، والتي تتضمن منشورات الشركات المهمة وبيانات الجمعيات وقواعد البيانات. فيما يلي بعض التطورات في سوق إدارة وسائل التواصل الاجتماعي:
- كجزء من ترويجها لمجموعة أدوات الإنشاء الجديدة Adobe Express، دخلت Adobe في شراكة مع Meta لإطلاق برنامج تدريبي جديد بعنوان "Express Your Brand"، والذي تم تصميمه لمساعدة أصحاب الأعمال الصغيرة على إنشاء محتوى واستراتيجيات تسويق رقمية أكثر فعالية وتعظيم أعمالهم. (المصدر: Adobe، بيان صحفي، مايو 2022).
- أعلنت شركة Social Guru USA عن إطلاق موقعها الإلكتروني المحدث حديثًا، والذي يقدم خدمات إدارة شاملة لوسائل التواصل الاجتماعي. ويمثل هذا التطور إنجازًا مهمًا بعد استحواذ الشركة. (المصدر: Social Guru USA، بيان صحفي، يونيو 2024)
تقرير سوق إدارة وسائل التواصل الاجتماعي: التغطية والنتائج المتوقعة
يوفر تقرير "حجم سوق إدارة وسائل التواصل الاجتماعي والتوقعات (2021-2031)" تحليلاً مفصلاً للسوق يغطي المجالات التالية:
- حجم سوق إدارة وسائل التواصل الاجتماعي وتوقعاته على المستويات العالمية والإقليمية والوطنية لجميع قطاعات السوق الرئيسية التي يغطيها النطاق
- اتجاهات سوق إدارة وسائل التواصل الاجتماعي بالإضافة إلى ديناميكيات السوق مثل المحركات والقيود والفرص الرئيسية
- تحليل مفصل لقوى PEST/Porter الخمس وSWOT
- تحليل سوق إدارة وسائل التواصل الاجتماعي الذي يغطي اتجاهات السوق الرئيسية والإطار العالمي والإقليمي واللاعبين الرئيسيين واللوائح والتطورات الأخيرة في السوق
- تحليل المشهد الصناعي والمنافسة الذي يغطي تركيز السوق، وتحليل خريطة الحرارة، واللاعبين البارزين، والتطورات الأخيرة لسوق إدارة وسائل التواصل الاجتماعي
- ملفات تعريف الشركة التفصيلية

أنكيتا خبيرة ديناميكية في أبحاث السوق والاستشارات، تتمتع بخبرة تزيد عن 8 سنوات في قطاعات التكنولوجيا والإعلام وتكنولوجيا المعلومات والاتصالات والإلكترونيات وأشباه الموصلات. وقد قادت ونفذت بنجاح أكثر من 100 مهمة استشارية وبحثية لعملاء عالميين مثل مايكروسوفت وأوراكل وشركة NEC وSAP وKPMG وExpeditors International. تشمل كفاءاتها الأساسية تقييم السوق، وتحليل البيانات، والتنبؤ، وصياغة الاستراتيجيات، والاستخبارات التنافسية، وكتابة التقارير.
أنكيتا بارعة في إدارة دورات المشاريع الكاملة، بدءًا من تصميم عروض ما قبل البيع ومناقشات العملاء، وصولًا إلى تقديم رؤى عملية بعد البيع. كما أنها ماهرة في إدارة فرق متعددة الوظائف، وهيكلة وحدات بحثية معقدة، ومواءمة الحلول مع أهداف العمل الخاصة بالعملاء. وقد مكنتها مهاراتها الممتازة في التواصل والقيادة والعرض التقديمي من تحقيق نتائج قيّمة باستمرار في بيئات سوقية سريعة التطور.
- التحليل التاريخي (سنتان)، سنة الأساس، التوقعات (7 سنوات) مع معدل النمو السنوي المركب
- تحليل PEST و SWOT
- حجم السوق والقيمة / الحجم - عالمي، إقليمي، بلد
- الصناعة والمنافسة
- مجموعة بيانات إكسل
التقارير الحديثة
تقارير ذات صلة
شهادات العملاء
تقرير سوق أنظمة SCADA من Insight Partners شامل، ويقدم رؤى قيّمة حول الاتجاهات الحالية والتوقعات المستقبلية. تميّز الفريق باحترافية عالية وسرعة في الاستجابة ودعم مستمر طوال الوقت. نحن راضون جدًا ونوصي بشدة بخدماتهم.
ران كيديم شريك, شركة ريالي تكنولوجيز المحدودةطلبتُ تقريرًا عن سوق برمجيات محدد، وأعدّه الفريق في غضون أيام قليلة. كانت المعلومات ذات صلة وثيقة وعرضها جيد. ثم طلبتُ بعض التعديلات والإضافات على التقرير. وكان الفريق متجاوبًا للغاية، وحصلتُ على التقرير النهائي في أقل من أسبوع.
جان هيرفيه جين رئيس مجلس الإدارة, فيوتشر أناليتيكاعملنا مع شركة "إنسايت بارتنرز" لإجراء دراسة سوقية وتوقعات مهمة. زودونا برؤى واضحة حول الفرص والمخاطر، مما ساعدنا في صياغة خططنا. كانت أبحاثهم سهلة الاستخدام ومبنية على بيانات دقيقة، مما ساعدنا على اتخاذ قرارات ذكية وواثقة. نوصي بهم بشدة.
بيوش ناجبال نائب الرئيس الأول, شعاع عالي عالميقدّمت شركة Insight Partners أبحاثًا سوقية ثاقبة ومنظمة جيدًا بخبرة واسعة في هذا المجال. تميّز فريقهم بالاحترافية وسرعة الاستجابة طوال الوقت. وسهّل موقعهم الإلكتروني سهل الاستخدام الوصول إلى تقارير القطاع. نوصي بهم بشدة لخدمات بحثية موثوقة وعالية الجودة.
يوكيهيكو أداتشي المدير التنفيذي, ديب بلو، ذ.م.م.هذه أول مرة أشتري فيها تقرير سوق من The Insight Partners. رغم أنني كنت مترددًا في البداية، إلا أنني زرت موقعهم الإلكتروني وشعرت براحة أكبر للمخاطرة وشراء تقرير السوق. أنا راضٍ تمامًا عن جودة التقرير وخدمة العملاء. كانت لديّ عدة أسئلة وتعليقات حول التقرير الأولي، ولكن بعد بضع محادثات عبر البريد الإلكتروني مع محللهم، أعتقد أن لديّ تقريرًا يمكنني استخدامه كمدخل لعملية التخطيط الاستراتيجي لدينا. شكرًا جزيلاً لكم على تخصيص وقتكم الإضافي وجعل هذه التجربة إيجابية. سأوصي بخدماتكم للآخرين بالتأكيد، وستكونون أول من ألجأ إليه عندما نحتاج إلى المزيد من بيانات السوق.
جون سوزوكي الرئيس والرئيس التنفيذي وعضو مجلس الإدارة, بي كيه تكنولوجيزأود أن أقدّر دعمكم واحترافيتكم في الاستجابة لطلبي للحصول على معلومات بشأن سوق التشخيص المخبري للأمراض المعدية في نيجيريا. كما أُقدّر صبركم وتوجيهكم، واستعدادكم لتقديم خصم، مما مكّننا في النهاية من إتمام الصفقة. أتطلع إلى التعامل مع "ذا إنسايت بارتنرز" مستقبلًا، كل ذلك بفضل الانطباع الذي تركتموه لديّ نتيجةً لهذا اللقاء الأول.
الدكتور تشيجيوك أونيا المدير الإداري, شركة باينكريست للرعاية الصحية المحدودةسبب الشراء
- اتخاذ قرارات مدروسة
- فهم ديناميكيات السوق
- تحليل المنافسة
- رؤى العملاء
- توقعات السوق
- تخفيف المخاطر
- التخطيط الاستراتيجي
- مبررات الاستثمار
- تحديد الأسواق الناشئة
- تحسين استراتيجيات التسويق
- تعزيز الكفاءة التشغيلية
- مواكبة التوجهات التنظيمية


 احصل على عينة مجانية ل - سوق إدارة وسائل التواصل الاجتماعي