سوق مستشعرات رطوبة التربة – المحركات والاتجاهات والفرص وإحصاءات النمو | 2031
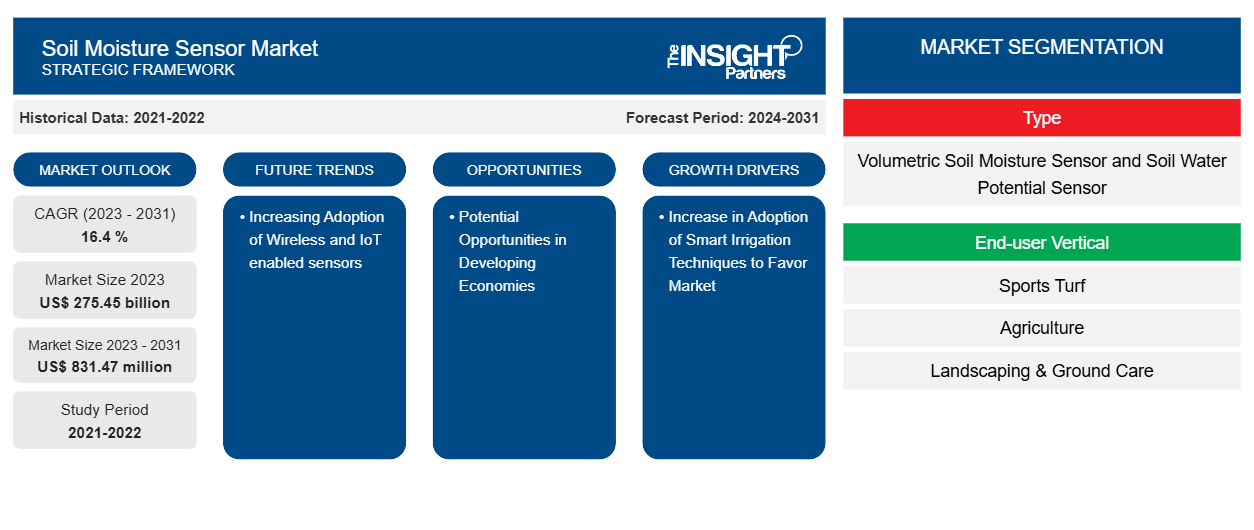
البيانات التاريخية : 2021-2022 | سنة الأساس : 2023 | فترة التنبؤ : 2024-2031حجم سوق مستشعرات رطوبة التربة وتوقعاتها (2021-2031)، والحصة العالمية والإقليمية، والاتجاهات، وفرص النمو، وتغطية تقرير تحليل: حسب النوع (مستشعر رطوبة التربة الحجمي ومستشعر إمكانات مياه التربة)، والقطاعات المستهدفة (العشب الرياضي، والزراعة، وتنسيق الحدائق والعناية بالأرض، والغابات، وغيرها) والجغرافيا.
- تاريخ التقرير : Mar 2026
- رمز التقرير : TIPTE100000366
- الفئة : الإلكترونيات وأشباه الموصلات
- الحالة : البيانات الصادرة
- تنسيقات التقارير المتاحة :


- عدد الصفحات : 150
من المتوقع أن يصل حجم سوق مستشعرات رطوبة التربة إلى 831.47 مليون دولار أمريكي بحلول عام 2031 من 275.45 مليار دولار أمريكي في عام 2023. ومن المتوقع أن يسجل السوق معدل نمو سنوي مركب بنسبة 16.4٪ في الفترة 2023-2031. يتأثر سوق مستشعرات رطوبة التربة بشدة بعوامل مثل النمو السكاني ونقص الأراضي الصالحة للزراعة وارتفاع أسعار المواد الغذائية والتقدم في التكنولوجيا الزراعية.CAGR of 16.4 % in 2023—2031. The market for soil moisture sensors is heavily influenced by factors such as population growth, shortage of arable land, rising food prices, and advancements in agricultural technology.
تحليل سوق أجهزة استشعار رطوبة التربة
يدرك المزارعون أهمية إدارة الموارد بشكل مستدام. تعتمد البيئة والزراعة بشكل كبير على جودة التربة . يسمح تحديد محتوى الرطوبة في التربة في الزراعة بتقييم جدوى إنتاج المحاصيل وربحيتها. ونتيجة لذلك، هناك حاجة متزايدة لأجهزة استشعار رطوبة التربة في جميع أنحاء العالم. تجد أجهزة استشعار رطوبة التربة استخدامًا واسع النطاق في توقعات الغلة الزراعية، والتطهير البيولوجي، وإدارة مكبات النفايات، واستصلاح مياه الصرف الصحي، والتحكم في الري، وأنظمة الإنذار المبكر بالجفاف.
نظرة عامة على سوق أجهزة استشعار رطوبة التربة
يتم قياس محتوى الماء في التربة باستخدام أجهزة استشعار رطوبة التربة. يمكن قياس محتوى رطوبة التربة باستخدام مجموعة متنوعة من التقنيات المعملية والحقلية، بما في ذلك الاستشعار عن بعد، على الرغم من أن استخدام أجهزة استشعار رطوبة التربة هو الطريقة الأكثر كفاءة وسرعة. واجهت وكالات المياه منذ فترة طويلة تحديات في تحقيق وفورات متسقة وقابلة للقياس في المياه من خلال تنفيذ برامج كفاءة استخدام المياه. ركزت البرامج المصممة لإنقاذ المناظر الطبيعية تقليديًا على التدريس حول جدولة الري وصيانة أنظمة الري واختيار النباتات المناسبة للبيئة المحلية. على الرغم من أن هذه المبادرات أسفرت عن وفورات، إلا أنه لا يزال هناك الكثير من المجال لتحسين كفاءة ري المناظر الطبيعية.
قم بتخصيص هذا التقرير ليناسب متطلباتك
ستحصل على تخصيص لأي تقرير - مجانًا - بما في ذلك أجزاء من هذا التقرير، أو تحليل على مستوى الدولة، وحزمة بيانات Excel، بالإضافة إلى الاستفادة من العروض والخصومات الرائعة للشركات الناشئة والجامعات
سوق أجهزة استشعار رطوبة التربة: رؤى استراتيجية
-
احصل على أهم اتجاهات السوق الرئيسية لهذا التقرير.ستتضمن هذه العينة المجانية تحليلاً للبيانات، بدءًا من اتجاهات السوق وحتى التقديرات والتوقعات.
محركات وفرص سوق أجهزة استشعار رطوبة التربة
زيادة في اعتماد تقنيات الري الذكية لصالح السوق
من المشاكل الرئيسية التي تواجهها البلدان في جميع أنحاء العالم حاليًا نقص المياه. يُعتقد أن ما يقرب من 60٪ من احتياطيات المياه العذبة في العالم تستهلكها الزراعة، وهي المستخدم الأساسي للمياه للري الزراعي. لذلك، هناك حاجة إلى نظام للتحكم بشكل فعال في كمية المياه المستخدمة في الزراعة. هنا، تعد أنظمة الري الذكية ضرورية لأنها تطبق استراتيجيات ري أكثر فعالية تعمل على خفض استهلاك المياه وتعزيز الغلة الزراعية . تعتبر أجهزة استشعار رطوبة التربة مفيدة لمعرفة متى وأين وكمية المياه التي يحتاجها المحصول في أي وقت. تساعد هذه المعلومات المزارعين على إنتاج المزيد من المحاصيل. تركيب هذه المستشعرات بسيط، و.
الفرص المحتملة في الاقتصادات النامية.
إن الأمن الغذائي يشكل أهمية بالغة، وخاصة في الدول النامية حيث يشكل التدهور البيئي خطراً جسيماً ـ فالزراعة تشكل أحد المصادر الأساسية للدخل في الاقتصادات النامية مثل الصين والهند والبرازيل. ومن أجل تلبية الطلب على إنتاج الغذاء في ظل النمو السكاني السريع، يتعين على هذه الدول أن تستخدم الأراضي المتاحة على نحو فعال. ومن المتوقع أن يزداد الطلب على أجهزة استشعار رطوبة التربة في هذه الدول النامية لأن محتوى رطوبة التربة يشكل أهمية بالغة في تحديد إنتاج المحاصيل.
تقرير تحليل تجزئة سوق مستشعر رطوبة التربة
إن القطاعات الرئيسية التي ساهمت في اشتقاق تحليل سوق مستشعر رطوبة التربة هي الأنواع والقطاعات العمودية للمستخدم النهائي.
- وفقًا للنوع، يتم تقسيم سوق مستشعر رطوبة التربة إلى مستشعرات رطوبة التربة الحجمية ومستشعرات إمكانات مياه التربة.
- بحسب المستخدم النهائي، يتم تقسيم السوق إلى العشب الرياضي، والزراعة، وتنسيق الحدائق والعناية بالأرض، والغابات، وغيرها.
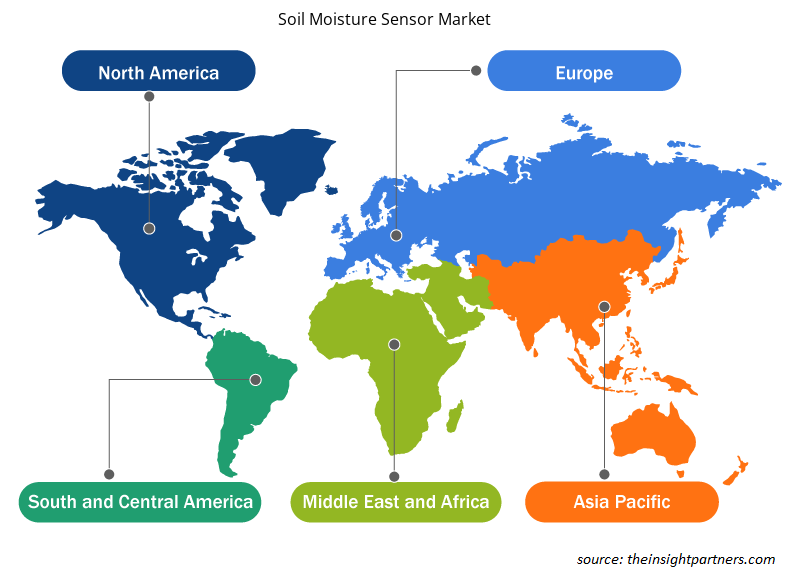
تحليل حصة سوق أجهزة استشعار رطوبة التربة حسب المنطقة الجغرافية
ينقسم النطاق الجغرافي لتقرير سوق مستشعر رطوبة التربة بشكل أساسي إلى خمس مناطق: أمريكا الشمالية، ومنطقة آسيا والمحيط الهادئ، وأوروبا، والشرق الأوسط وأفريقيا، وأمريكا الجنوبية/أمريكا الجنوبية والوسطى. سيطرت أمريكا الشمالية على سوق مستشعر رطوبة التربة. وقد أدت اتجاهات تبني التكنولوجيا العالية في مختلف الصناعات في منطقة أمريكا الشمالية إلى تغذية نمو سوق مستشعر رطوبة التربة. ومن المتوقع أن تؤدي عوامل مثل زيادة اعتماد الأدوات الرقمية والإنفاق التكنولوجي العالي من قبل الوكالات الحكومية إلى دفع نمو سوق مستشعر رطوبة التربة في أمريكا الشمالية. علاوة على ذلك، فإن التركيز القوي على البحث والتطوير في الاقتصادات المتقدمة في الولايات المتحدة وكندا يجبر اللاعبين في أمريكا الشمالية على جلب حلول متقدمة تقنيًا إلى السوق. بالإضافة إلى ذلك، تمتلك الولايات المتحدة عددًا كبيرًا من اللاعبين في سوق مستشعر رطوبة التربة الذين يركزون بشكل متزايد على تطوير حلول مبتكرة. تساهم كل هذه العوامل في نمو سوق مستشعر رطوبة التربة في المنطقة.
رؤى إقليمية حول سوق أجهزة استشعار رطوبة التربة
لقد قام المحللون في Insight Partners بشرح الاتجاهات والعوامل الإقليمية المؤثرة على سوق مستشعر رطوبة التربة طوال فترة التنبؤ بشكل شامل. يناقش هذا القسم أيضًا قطاعات سوق مستشعر رطوبة التربة والجغرافيا في جميع أنحاء أمريكا الشمالية وأوروبا ومنطقة آسيا والمحيط الهادئ والشرق الأوسط وأفريقيا وأمريكا الجنوبية والوسطى.
- احصل على البيانات الإقليمية المحددة لسوق أجهزة استشعار رطوبة التربة
نطاق تقرير سوق أجهزة استشعار رطوبة التربة
| سمة التقرير | تفاصيل |
|---|---|
| حجم السوق في عام 2023 | 275.45 مليار دولار أمريكي |
| حجم السوق بحلول عام 2031 | 831.47 مليون دولار أمريكي |
| معدل النمو السنوي المركب العالمي (2023 - 2031) | 16.4% |
| البيانات التاريخية | 2021-2022 |
| فترة التنبؤ | 2024-2031 |
| القطاعات المغطاة |
حسب النوع
|
| المناطق والدول المغطاة |
أمريكا الشمالية
|
| قادة السوق وملفات تعريف الشركات الرئيسية |
|
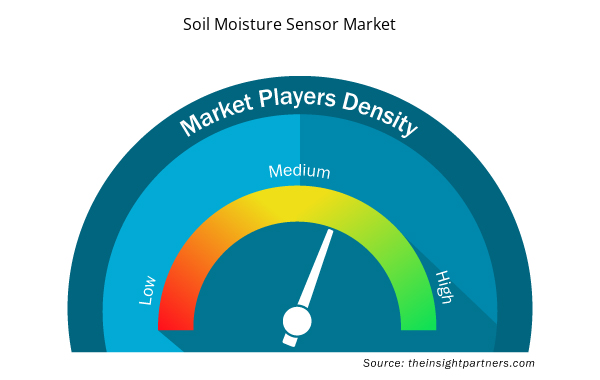
كثافة اللاعبين في السوق: فهم تأثيرها على ديناميكيات الأعمال
يشهد سوق أجهزة استشعار رطوبة التربة نموًا سريعًا، مدفوعًا بالطلب المتزايد من المستخدم النهائي بسبب عوامل مثل تفضيلات المستهلكين المتطورة والتقدم التكنولوجي والوعي المتزايد بفوائد المنتج. ومع ارتفاع الطلب، تعمل الشركات على توسيع عروضها والابتكار لتلبية احتياجات المستهلكين والاستفادة من الاتجاهات الناشئة، مما يؤدي إلى زيادة نمو السوق.
تشير كثافة اللاعبين في السوق إلى توزيع الشركات أو المؤسسات العاملة في سوق أو صناعة معينة. وهي تشير إلى عدد المنافسين (اللاعبين في السوق) الموجودين في مساحة سوق معينة نسبة إلى حجمها أو قيمتها السوقية الإجمالية.
الشركات الرئيسية العاملة في سوق مستشعر رطوبة التربة هي:
- شركة سنتيك للتكنولوجيا
- شركة إيروميتر المحدودة
- شركة دلتا تي ديفايسز المحدودة
- شركة ستيفنز لأنظمة مراقبة المياه
- شركة تورو
- أكليما، المحدودة
إخلاء المسؤولية : الشركات المذكورة أعلاه ليست مرتبة بأي ترتيب معين.
- احصل على نظرة عامة على أهم اللاعبين الرئيسيين في سوق أجهزة استشعار رطوبة التربة
أخبار سوق أجهزة استشعار رطوبة التربة والتطورات الأخيرة
يتم تقييم سوق مستشعر رطوبة التربة من خلال جمع البيانات النوعية والكمية بعد البحث الأولي والثانوي، والذي يتضمن منشورات الشركات المهمة وبيانات الجمعيات وقواعد البيانات. فيما يلي قائمة بالتطورات في السوق:
- في يناير 2023، أعلنت CropX Technologies، إحدى الشركات العالمية الرائدة في الحلول الرقمية لإدارة المزارع الزراعية، عن استحواذها على Tule Technologies، وهي شركة ري دقيق مقرها كاليفورنيا. يجلب هذا الاستحواذ تقنيات جديدة لالتقاط البيانات إلى نظام CropX Agronomic Farm Management System ويوسع سوقها في المحاصيل المتخصصة المروية بالتنقيط في كاليفورنيا.
(المصدر: CropX Technologies، بيان صحفي، 2023)
- في أكتوبر 2022، أطلقت شركة Sensoterra جيلًا جديدًا من أجهزة الاستشعار ذات العمق الواحد بتصميم هوائي جديد. وقد حسّن المستشعر الذي تم إطلاقه حديثًا قوة إشارة LoRaWAN بمقدار 2 إلى 4 عوامل ويوفر متانة أفضل إلى جانب زيادة الدقة.
(المصدر: Sensoterra، بيان صحفي، 2022)
تقرير سوق أجهزة استشعار رطوبة التربة - التغطية والنتائج المتوقعة
يوفر تقرير "حجم سوق مستشعر رطوبة التربة والتوقعات (2021-2031)" تحليلاً مفصلاً للسوق يغطي المجالات التالية:
- حجم السوق والتوقعات على المستويات العالمية والإقليمية والوطنية لجميع قطاعات السوق الرئيسية التي يغطيها النطاق
- ديناميكيات السوق مثل المحركات والقيود والفرص الرئيسية
- الاتجاهات المستقبلية الرئيسية
- تحليل مفصل لقوى PEST/Porter الخمس وSWOT
- تحليل السوق العالمي والإقليمي الذي يغطي اتجاهات السوق الرئيسية واللاعبين الرئيسيين واللوائح والتطورات الأخيرة في السوق
- تحليل المشهد الصناعي والمنافسة الذي يغطي تركيز السوق، وتحليل خريطة الحرارة، واللاعبين البارزين، والتطورات الأخيرة
- ملفات تعريف الشركة التفصيلية

نافين خبيرٌ متمرسٌ في أبحاث السوق والاستشارات، يتمتع بخبرةٍ تزيد عن 9 سنوات في مشاريع مُخصصة ومُشتركة واستشارية. يشغل حاليًا منصب نائب الرئيس المساعد، وقد نجح في إدارة أصحاب المصلحة عبر سلسلة قيمة المشاريع، وألّف أكثر من 100 تقرير بحثي وأكثر من 30 مهمة استشارية. يمتد نطاق عمله ليشمل مشاريع صناعية وحكومية، مساهمًا بشكل كبير في نجاح العملاء واتخاذ القرارات القائمة على البيانات.
نافين حاصلٌ على شهادة في هندسة الإلكترونيات والاتصالات من جامعة فرجينيا التقنية، كارناتاكا، وشهادة ماجستير في إدارة الأعمال في التسويق والعمليات من جامعة مانيبال. وهو عضوٌ نشطٌ في معهد مهندسي الكهرباء والإلكترونيات (IEEE) لمدة 9 سنوات، حيث شارك في مؤتمراتٍ وندواتٍ تقنية، وتطوّع على مستوى الأقسام والمناطق. قبل منصبه الحالي، عمل مستشارًا استراتيجيًا مساعدًا في IndustryARC، ومستشارًا للخوادم الصناعية في شركة هيوليت باكارد (HP Global).
- التحليل التاريخي (سنتان)، سنة الأساس، التوقعات (7 سنوات) مع معدل النمو السنوي المركب
- تحليل PEST و SWOT
- حجم السوق والقيمة / الحجم - عالمي، إقليمي، بلد
- الصناعة والمنافسة
- مجموعة بيانات إكسل
التقارير الحديثة
تقارير ذات صلة
شهادات العملاء
تقرير سوق أنظمة SCADA من Insight Partners شامل، ويقدم رؤى قيّمة حول الاتجاهات الحالية والتوقعات المستقبلية. تميّز الفريق باحترافية عالية وسرعة في الاستجابة ودعم مستمر طوال الوقت. نحن راضون جدًا ونوصي بشدة بخدماتهم.
ران كيديم شريك, شركة ريالي تكنولوجيز المحدودةطلبتُ تقريرًا عن سوق برمجيات محدد، وأعدّه الفريق في غضون أيام قليلة. كانت المعلومات ذات صلة وثيقة وعرضها جيد. ثم طلبتُ بعض التعديلات والإضافات على التقرير. وكان الفريق متجاوبًا للغاية، وحصلتُ على التقرير النهائي في أقل من أسبوع.
جان هيرفيه جين رئيس مجلس الإدارة, فيوتشر أناليتيكاعملنا مع شركة "إنسايت بارتنرز" لإجراء دراسة سوقية وتوقعات مهمة. زودونا برؤى واضحة حول الفرص والمخاطر، مما ساعدنا في صياغة خططنا. كانت أبحاثهم سهلة الاستخدام ومبنية على بيانات دقيقة، مما ساعدنا على اتخاذ قرارات ذكية وواثقة. نوصي بهم بشدة.
بيوش ناجبال نائب الرئيس الأول, شعاع عالي عالميقدّمت شركة Insight Partners أبحاثًا سوقية ثاقبة ومنظمة جيدًا بخبرة واسعة في هذا المجال. تميّز فريقهم بالاحترافية وسرعة الاستجابة طوال الوقت. وسهّل موقعهم الإلكتروني سهل الاستخدام الوصول إلى تقارير القطاع. نوصي بهم بشدة لخدمات بحثية موثوقة وعالية الجودة.
يوكيهيكو أداتشي المدير التنفيذي, ديب بلو، ذ.م.م.هذه أول مرة أشتري فيها تقرير سوق من The Insight Partners. رغم أنني كنت مترددًا في البداية، إلا أنني زرت موقعهم الإلكتروني وشعرت براحة أكبر للمخاطرة وشراء تقرير السوق. أنا راضٍ تمامًا عن جودة التقرير وخدمة العملاء. كانت لديّ عدة أسئلة وتعليقات حول التقرير الأولي، ولكن بعد بضع محادثات عبر البريد الإلكتروني مع محللهم، أعتقد أن لديّ تقريرًا يمكنني استخدامه كمدخل لعملية التخطيط الاستراتيجي لدينا. شكرًا جزيلاً لكم على تخصيص وقتكم الإضافي وجعل هذه التجربة إيجابية. سأوصي بخدماتكم للآخرين بالتأكيد، وستكونون أول من ألجأ إليه عندما نحتاج إلى المزيد من بيانات السوق.
جون سوزوكي الرئيس والرئيس التنفيذي وعضو مجلس الإدارة, بي كيه تكنولوجيزأود أن أقدّر دعمكم واحترافيتكم في الاستجابة لطلبي للحصول على معلومات بشأن سوق التشخيص المخبري للأمراض المعدية في نيجيريا. كما أُقدّر صبركم وتوجيهكم، واستعدادكم لتقديم خصم، مما مكّننا في النهاية من إتمام الصفقة. أتطلع إلى التعامل مع "ذا إنسايت بارتنرز" مستقبلًا، كل ذلك بفضل الانطباع الذي تركتموه لديّ نتيجةً لهذا اللقاء الأول.
الدكتور تشيجيوك أونيا المدير الإداري, شركة باينكريست للرعاية الصحية المحدودةسبب الشراء
- اتخاذ قرارات مدروسة
- فهم ديناميكيات السوق
- تحليل المنافسة
- رؤى العملاء
- توقعات السوق
- تخفيف المخاطر
- التخطيط الاستراتيجي
- مبررات الاستثمار
- تحديد الأسواق الناشئة
- تحسين استراتيجيات التسويق
- تعزيز الكفاءة التشغيلية
- مواكبة التوجهات التنظيمية


 احصل على عينة مجانية ل - سوق أجهزة استشعار رطوبة التربة