تحليلات الإنفاق للإلكترونيات وأشباه الموصلات نظرة عامة على السوق والنمو والاتجاهات والتحليل وتقرير البحث (2021-2030)
البيانات التاريخية : 2020-2021 | سنة الأساس : 2022 | فترة التنبؤ : 2023-2030تحليلات الإنفاق على سوق الإلكترونيات وأشباه الموصلات، وحجمها وتوقعاتها (2020-2030)، والحصة العالمية والإقليمية، والاتجاهات، وتحليل فرص النمو حسب المكونات (البرمجيات والخدمات)، والنوع (التحليلات الوصفية، والتحليلات التنبؤية، والتحليلات الوصفية)، والنشر (داخليًا وسحابيًا)، والتطبيق (الإدارة المالية، وإدارة المخاطر، وإدارة الحوكمة والامتثال، وإدارة مصادر الموردين والأداء، وتوقعات العرض والطلب، وغيرها).
- تاريخ التقرير : Feb 2024
- رمز التقرير : TIPRE00038938
- الفئة : التكنولوجيا والإعلام والاتصالات
- الحالة : نُشرت
- تنسيقات التقارير المتاحة :


- عدد الصفحات : 162
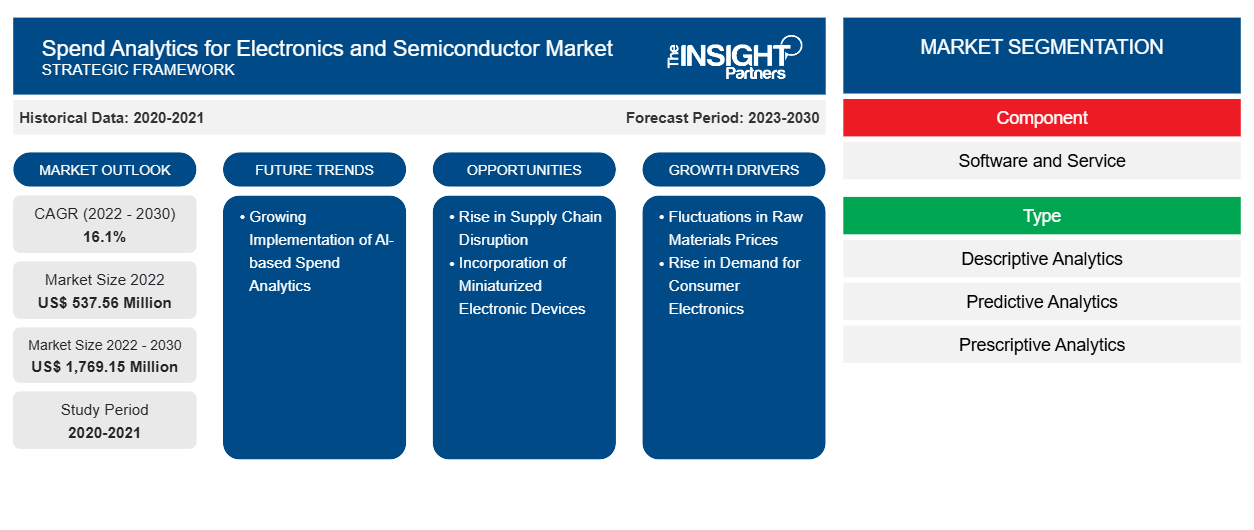
[تقرير بحثي] تم تقييم حجم الإنفاق التحليلي لسوق الإلكترونيات وأشباه الموصلات بنحو 537.56 مليون دولار أمريكي في عام 2022 ومن المتوقع أن يصل إلى 1،769.15 مليون دولار أمريكي بحلول عام 2030؛ ومن المتوقع أن يسجل معدل نمو سنوي مركب بنسبة 16.1٪ من عام 2022 إلى عام 2030.
تحليلات الإنفاق على سوق الإلكترونيات وأشباه الموصلات من وجهة نظر المحلل:
من المتوقع أن يعزز دمج الذكاء الاصطناعي والذكاء الاصطناعي التوليدي وتحليلات البيانات الضخمة وإنترنت الأشياء والحوسبة السحابية وأتمتة العمليات الروبوتية والتعرف على الصور وغيرها من التقنيات قدرات حلول تحليل الإنفاق في السنوات القادمة. إن التقدم التكنولوجي المرتبط بتحليل الإنفاق مدفوع بتكامل الذكاء الاصطناعي. يمكّن الذكاء الاصطناعي الآلات وتطبيقات البرامج من التفكير والتعلم والتصرف مثل الإدراك البشري. تسمح هذه القدرة لأنظمة الذكاء الاصطناعي بتحليل مجموعات البيانات المعقدة والتعرف على الأنماط واتخاذ قرارات مستنيرة بناءً على المعلومات المتاحة. أدى صعود تكنولوجيا الذكاء الاصطناعي أيضًا إلى زيادة الطلب على رقائق أشباه الموصلات القوية والفعالة. تتطلب أنظمة الذكاء الاصطناعي قدرات حوسبة عالية الأداء لمعالجة وتحليل كميات كبيرة من البيانات في الوقت الفعلي. دفع هذا الطلب إلى تطوير رقائق الذكاء الاصطناعي المتخصصة المحسّنة لأحمال عمل الذكاء الاصطناعي. وبالتالي، من المتوقع أن يخلق التنفيذ المتزايد لتحليلات الإنفاق القائمة على الذكاء الاصطناعي فرصًا واسعة لنمو تحليلات الإنفاق لسوق الإلكترونيات وأشباه الموصلات في السنوات القادمة.
نظرة عامة على تحليلات الإنفاق لسوق الإلكترونيات وأشباه الموصلات:
تشير اتجاهات الإنفاق العالمي لتحليلات سوق الإلكترونيات وأشباه الموصلات إلى إمكانية تحقيق نمو كبير ومن المتوقع أن يستمر التوسع في السنوات القادمة. ومن المتوقع أن يكون للتقدم في تكامل البيانات وتحليل البيانات المعقدة تأثير كبير على نمو سوق تحليلات الإنفاق للإلكترونيات وأشباه الموصلات. يتضمن النظام البيئي للسوق مجموعة متنوعة من أصحاب المصلحة، بما في ذلك مطورو البرامج وشركات الاستشارات والمستخدمين النهائيين. يعد مطورو البرامج أمرًا حيويًا في إنشاء وصيانة برامج تحليلات الإنفاق بناءً على المتطلبات المشتركة أو المحددة للمؤسسات في صناعة الإلكترونيات وأشباه الموصلات. تلعب شركات الاستشارات دورًا حيويًا في نشر برامج تحليلات الإنفاق في شركات الإلكترونيات وأشباه الموصلات. تسد خبرتهم الفجوة بين القدرات التكنولوجية واحتياجات العمل، مما يضمن التبني الناجح لحلول التحليلات. يشمل المستخدمون النهائيون لتحليلات الإنفاق للإلكترونيات وأشباه الموصلات مقدمي خدمات التصنيع الإلكتروني ومصنعي المعدات الأصلية وغيرهم.
قم بتخصيص هذا التقرير ليناسب متطلباتك
ستحصل على تخصيص لأي تقرير - مجانًا - بما في ذلك أجزاء من هذا التقرير، أو تحليل على مستوى الدولة، وحزمة بيانات Excel، بالإضافة إلى الاستفادة من العروض والخصومات الرائعة للشركات الناشئة والجامعات
تحليلات الإنفاق على سوق الإلكترونيات وأشباه الموصلات: رؤى استراتيجية
- احصل على أهم اتجاهات السوق الرئيسية لهذا التقرير.ستتضمن هذه العينة المجانية تحليلاً للبيانات، بدءًا من اتجاهات السوق وحتى التقديرات والتوقعات.
تحليلات الإنفاق على سوق الإلكترونيات وأشباه الموصلات: المحرك
التقلبات في أسعار المواد الخام تغذي تحليلات الإنفاق على نمو سوق الإلكترونيات وأشباه الموصلات
تعتمد تحليلات الإنفاق العالمي على توقعات سوق الإلكترونيات وأشباه الموصلات على تحليل عوامل مختلفة، بما في ذلك تأثير التقلبات في أسعار المواد الخام. يمكن أن تؤثر مبيعات الرقائق واختلافات الطلب على الإيرادات الإجمالية وربحية الشركات العاملة في صناعة الإلكترونيات وأشباه الموصلات. والجدير بالذكر أن تايوان، موطن أكبر شركة لتصنيع الرقائق التعاقدية - TSMC، لعبت دورًا مهمًا كمنتج بارز لأشباه الموصلات، والتي يتم استخدامها على نطاق واسع في مختلف المجالات، بما في ذلك الأجهزة المنزلية والأجهزة المحمولة ومراكز البيانات والطائرات العسكرية. يمكن أن يؤدي عدم اليقين بشأن أسعار المواد الخام في السوق إلى تعطيل سلسلة التوريد، مما يؤثر على توافر وتسعير المكونات الإلكترونية وأشباه الموصلات. كما يمكن أن يُعزى نقص أشباه الموصلات إلى عوامل مختلفة، بما في ذلك تقلبات السوق، مثل أسعار المواد الخام والاضطرابات الناجمة عن جائحة كوفيد-19. مع سعي شركات الإلكترونيات وأشباه الموصلات إلى توفير منتجات فعالة من حيث التكلفة مع الحفاظ على القدرة التنافسية، فإنها تواجه تحدي اتخاذ القرارات الاستراتيجية أثناء تقلبات السوق وعدم اليقين في أسعار المواد الخام. وهذا بدوره يفيد تقدم تحليلات الإنفاق لتوقعات سوق الإلكترونيات وأشباه الموصلات، من خلال زيادة احتمالية اعتمادها. وعلاوة على ذلك، تتطلب التقلبات في أسعار المواد الخام اتخاذ قرارات استراتيجية للتنقل في الأوقات الصعبة. وبالتالي، يتم دمج تحليلات الإنفاق لتسهيل تحديد أوجه القصور، وتحسين عمليات الشراء، والمساعدة في اتخاذ القرارات المستنيرة اللازمة لإدارة التكاليف الفعّالة. من خلال توفير رؤى قيمة حول أنماط الإنفاق وأداء الموردين واتجاهات السوق، تعمل تحليلات الإنفاق على تمكين الشركات من تحقيق نتائج تعتمد على البيانات وتكييف استراتيجياتها وفقًا لذلك. يمكن للشركات العاملة في سوق الإلكترونيات وأشباه الموصلات فهم أنماط إنفاقها بشكل شامل، وتحديد فرص خفض التكاليف، وتخفيف المخاطر، وتعزيز أدائها المالي الإجمالي في مواجهة تقلبات السوق وعدم اليقين من خلال الاستفادة من تحليلات الإنفاق. وبالتالي، تساهم التقلبات في أسعار المواد الخام في نمو قيم توقعات تحليلات الإنفاق لسوق الإلكترونيات وأشباه الموصلات.
تحليلات الإنفاق على سوق الإلكترونيات وأشباه الموصلات: القطاع
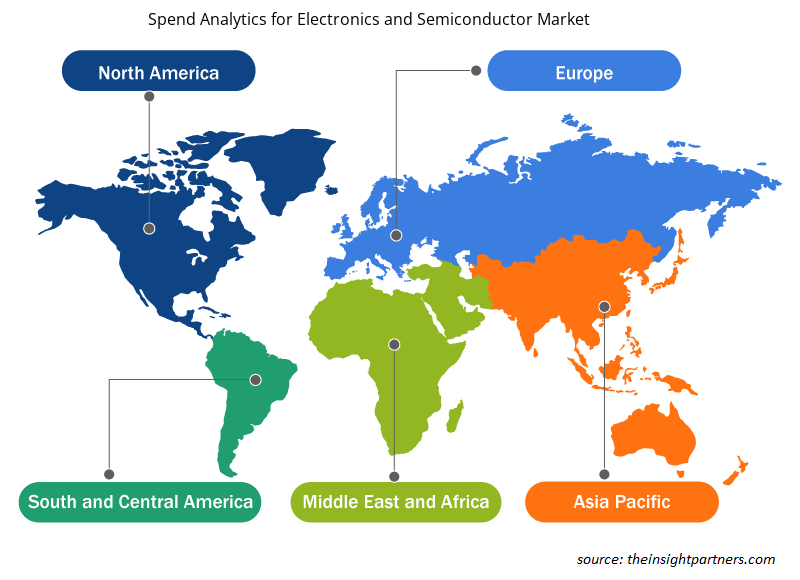
يتم تقسيم سوق تحليلات الإنفاق العالمية للإلكترونيات وأشباه الموصلات على أساس المكون والنوع والنشر والتطبيق. بناءً على المكون، يتم تقسيم السوق إلى برامج وخدمات. بناءً على النوع، يتم تقسيم السوق إلى تحليلات تنبؤية وتحليلات وصفية وتحليلات وصفية. بناءً على النشر، يتم تقسيم السوق إلى محلي وسحابي. بناءً على التطبيق، يتم تقسيم السوق إلى إدارة مالية وإدارة المخاطر وتوريد الموردين وإدارة الأداء والحوكمة وإدارة الامتثال وتوقعات العرض والطلب وغيرها. من حيث الجغرافيا، يتم تقسيم سوق تحليلات الإنفاق للإلكترونيات وأشباه الموصلات إلى أمريكا الشمالية وأوروبا وآسيا والمحيط الهادئ (APAC) والشرق الأوسط وأفريقيا (MEA) وأمريكا الجنوبية (SAM).
تتضمن برامج تحليل الإنفاق معلومات الإنفاق على مستوى المؤسسة بجميع التنسيقات عبر مصادر متعددة وأنظمة متباينة - بطاقات المشتريات والحسابات الدائنة وأوامر الشراء وكل قناة شراء أخرى. يحول البرنامج بيانات الإنفاق ويقدمها من حيث الفرص من خلال استنتاج المعنى من كتلة المعلومات. إنه يحول نشاط المشتريات من خلال الرؤية ويمكّن من التحكم بشكل أفضل في الإنفاق على مستوى المؤسسة. أدى الارتفاع المفاجئ في تصنيع المنتجات الإلكترونية وأشباه الموصلات إلى توليد سريع لكميات هائلة من البيانات. هذا يخلق الحاجة إلى تحسين جودة البيانات، والتي يمكن تحقيقها باستخدام برامج تحليل الإنفاق. أطلق العديد من اللاعبين حلولاً متقدمة لتحسين تحليلات الإنفاق الخاصة بهم لحصة سوق الإلكترونيات وأشباه الموصلات. على سبيل المثال، في فبراير 2022، أعلنت Coupa Software، وهي شركة تقدم حلول إدارة الإنفاق التجاري (BSM)، عن إطلاق Community.ai، وهي مجموعة حلول إدارة الإنفاق من الجيل التالي. تعمل Coupa على تحويل مجتمعات B2B من خلال تحسين التفاعلات بين المشترين والبائعين من خلال الجمع بين قوة الذكاء الاصطناعي القائم على البيانات والعلاقات بين الأشخاص.
تحليلات الإنفاق على سوق الإلكترونيات وأشباه الموصلات: المنطقة
تم تقييم حجم سوق تحليلات الإنفاق في منطقة آسيا والمحيط الهادئ للإلكترونيات وأشباه الموصلات بنحو 332.16 مليون دولار أمريكي في عام 2022 ومن المتوقع أن يصل إلى 1،151.18 مليون دولار أمريكي بحلول عام 2030؛ ومن المتوقع أن يسجل معدل نمو سنوي مركب بنسبة 16.8٪ من عام 2022 إلى عام 2030. ومن المتوقع أن يشهد حجم سوق تحليلات الإنفاق للإلكترونيات وأشباه الموصلات في منطقة آسيا والمحيط الهادئ نموًا سريعًا في السنوات القادمة ومن المتوقع أن تحتفظ المنطقة بأكبر حصة في سوق تحليلات الإنفاق للإلكترونيات وأشباه الموصلات طوال فترة التنبؤ. يمكن أن يُعزى تقدم السوق في هذه المنطقة إلى القبول المتزايد لأدوات التحليلات بين المستهلكين والشركات. تشهد منطقة آسيا والمحيط الهادئ طلبًا متزايدًا على برامج تحليلات الإنفاق، مدفوعًا بالاعتماد المتزايد على أدوات التحليلات؛ ونمو قطاعي البيانات الضخمة والتحليلات؛ والاحتياجات المحددة للصناعات مثل الاتصالات السلكية واللاسلكية، والخدمات المصرفية، والحكومة المركزية، والتصنيع المنفصل، والخدمات المهنية. تحتل الصين واليابان والهند طليعة تبني تحليلات الإنفاق في المنطقة، مدفوعة بتفجر البيانات والتحضر وتطوير التعلم الآلي والعديد من الشركات الصغيرة والمتوسطة الحجم. تشمل شركات تصنيع الإلكترونيات وأشباه الموصلات الرئيسية في منطقة آسيا والمحيط الهادئ شركة Powerchip Semiconductor Manufacturing (PSMC)، وشركة Taiwan Semiconductor Manufacturing Company (TSMC)، وشركة United Microelectronics (UMC)، وشركة Vanguard International Semiconductor (VIS)، التي تستخدم أو هي عملاء محتملون للحلول التي طورتها الجهات الفاعلة الرئيسية التي تم أخذها في الاعتبار في تحليلات الإنفاق لسوق الإلكترونيات وأشباه الموصلات.
إن الاستخدام المتزايد لتحليلات الإنفاق يمكّن المؤسسات في قطاع الإلكترونيات وأشباه الموصلات من تحسين عمليات الشراء واتخاذ قرارات إنفاق مستنيرة. من خلال تحليل أنماط الإنفاق، يمكن للمؤسسات تحديد الفرص لخفض التكاليف وإدارة الموردين بشكل فعال وتخفيف المخاطر الناشئة عن الاضطرابات في سلسلة التوريد. من خلال مراقبة وتحليل بيانات الإنفاق عن كثب، يمكن للمؤسسات تحديد الموردين البدلاء وإدارة التكاليف بشكل فعال وضمان إمداد مستقر من المكونات الإلكترونية وأشباه الموصلات. تعمل مثل هذه العوامل على دفع نمو حصة تحليلات الإنفاق في سوق الإلكترونيات وأشباه الموصلات في منطقة آسيا والمحيط الهادئ.
تحليلات الإنفاق على سوق الإلكترونيات وأشباه الموصلات: اللاعبون الرئيسيون
تعد Coupa Software Inc وIBM Corporation وIvalua Inc وLytica Inc وNB Ventures Inc (GEP) وSAP SE وScanmarket AS وSyertrade Inc وVortal Connecting Business SA وZycus Inc من بين اللاعبين الرئيسيين الذين تم تغطيتهم في تحليل الإنفاق على سوق الإلكترونيات وأشباه الموصلات. تم تحليل العديد من الشركات الكبرى الأخرى خلال دراسة البحث هذه للحصول على رؤية شاملة لنظام تحليل الإنفاق على سوق الإلكترونيات وأشباه الموصلات.
تحليلات الإنفاق على سوق الإلكترونيات وأشباه الموصلات: رؤى إقليمية
لقد قام المحللون في Insight Partners بشرح الاتجاهات والعوامل الإقليمية المؤثرة على Spend Analytics for Electronics and Semiconductor Market طوال فترة التوقعات بشكل شامل. يناقش هذا القسم أيضًا قطاعات Spend Analytics for Electronics and Semiconductor Market والجغرافيا في جميع أنحاء أمريكا الشمالية وأوروبا ومنطقة آسيا والمحيط الهادئ والشرق الأوسط وأفريقيا وأمريكا الجنوبية والوسطى.
- احصل على بيانات إقليمية محددة لتحليلات الإنفاق على سوق الإلكترونيات وأشباه الموصلات
نطاق تقرير تحليلات الإنفاق على سوق الإلكترونيات وأشباه الموصلات
| سمة التقرير | تفاصيل |
|---|---|
| حجم السوق في عام 2022 | 537.56 مليون دولار أمريكي |
| حجم السوق بحلول عام 2030 | 1,769.15 مليون دولار أمريكي |
| معدل النمو السنوي المركب العالمي (2022 - 2030) | 16.1% |
| البيانات التاريخية | 2020-2021 |
| فترة التنبؤ | 2023-2030 |
| القطاعات المغطاة | حسب المكون
|
| المناطق والدول المغطاة | أمريكا الشمالية
|
| قادة السوق وملفات تعريف الشركات الرئيسية |
|
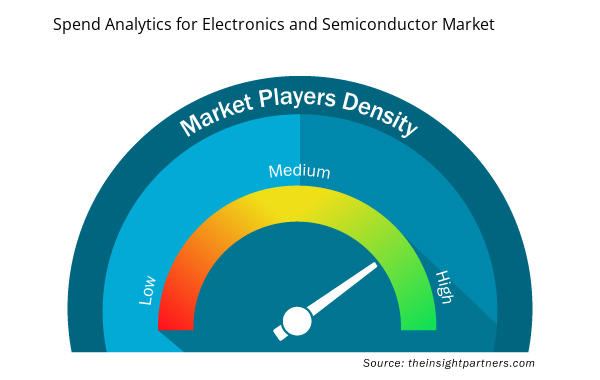
كثافة اللاعبين في السوق: فهم تأثيرها على ديناميكيات الأعمال
يشهد سوق تحليلات الإنفاق على الإلكترونيات وأشباه الموصلات نموًا سريعًا، مدفوعًا بالطلب المتزايد من المستخدم النهائي بسبب عوامل مثل تفضيلات المستهلك المتطورة والتقدم التكنولوجي والوعي المتزايد بفوائد المنتج. ومع ارتفاع الطلب، تعمل الشركات على توسيع عروضها والابتكار لتلبية احتياجات المستهلكين والاستفادة من الاتجاهات الناشئة، مما يؤدي إلى زيادة نمو السوق.
تشير كثافة اللاعبين في السوق إلى توزيع الشركات أو المؤسسات العاملة في سوق أو صناعة معينة. وهي تشير إلى عدد المنافسين (اللاعبين في السوق) الموجودين في مساحة سوق معينة نسبة إلى حجمها أو قيمتها السوقية الإجمالية.
الشركات الرئيسية العاملة في سوق تحليلات الإنفاق للإلكترونيات وأشباه الموصلات هي:
- شركة كوبيا للبرمجيات
- شركة الآلات التجارية الدولية
- شركة إيفالوا
- شركة ليتيكا
- شركة إن بي فينتشرز
إخلاء المسؤولية : الشركات المذكورة أعلاه ليست مرتبة بأي ترتيب معين.
- احصل على نظرة عامة على أهم اللاعبين الرئيسيين في سوق الإلكترونيات وأشباه الموصلات من Spend Analytics
تحليلات الإنفاق لسوق الإلكترونيات وأشباه الموصلات التطورات الأخيرة:
يعتمد المشاركون في تحليلات الإنفاق على سوق الإلكترونيات وأشباه الموصلات بشكل كبير على الاستراتيجيات غير العضوية والعضوية. فيما يلي قائمة ببعض التطورات الرئيسية في تقرير تحليلات الإنفاق على سوق الإلكترونيات وأشباه الموصلات:
- في يناير 2024، دخلت مجموعة AW Rostamani Group (AWR) وGEP في شراكة لتحويل عملية المصدر إلى الدفع (S2P). سيعمل مزود برامج المشتريات وسلسلة التوريد التي تعمل بالذكاء الاصطناعي GEP مع AWR. وقد أكدت الأخيرة أنها ستستخدم برنامج GEP للمساعدة في تحويل عملية المصدر إلى الدفع (S2P) بالكامل وتحليلات الإنفاق، بما في ذلك إدارة المصادر والموردين والعقود.
- في فبراير 2022، أعلنت شركة Coupa Software، وهي شركة تقدم حلول إدارة الأعمال التجارية، عن إطلاق Community.ai، وهي مجموعة من أدوات إدارة الإنفاق من الجيل التالي. تجمع Coupa بين ميزات الذكاء الاصطناعي القائم على البيانات والتفاعلات بين الأشخاص لتحسين مجتمعات الأعمال التجارية بين الشركات والطريقة التي يتواصل بها المشترون والبائعون.

أنكيتا خبيرة ديناميكية في أبحاث السوق والاستشارات، تتمتع بخبرة تزيد عن 8 سنوات في قطاعات التكنولوجيا والإعلام وتكنولوجيا المعلومات والاتصالات والإلكترونيات وأشباه الموصلات. وقد قادت ونفذت بنجاح أكثر من 100 مهمة استشارية وبحثية لعملاء عالميين مثل مايكروسوفت وأوراكل وشركة NEC وSAP وKPMG وExpeditors International. تشمل كفاءاتها الأساسية تقييم السوق، وتحليل البيانات، والتنبؤ، وصياغة الاستراتيجيات، والاستخبارات التنافسية، وكتابة التقارير.
أنكيتا بارعة في إدارة دورات المشاريع الكاملة، بدءًا من تصميم عروض ما قبل البيع ومناقشات العملاء، وصولًا إلى تقديم رؤى عملية بعد البيع. كما أنها ماهرة في إدارة فرق متعددة الوظائف، وهيكلة وحدات بحثية معقدة، ومواءمة الحلول مع أهداف العمل الخاصة بالعملاء. وقد مكنتها مهاراتها الممتازة في التواصل والقيادة والعرض التقديمي من تحقيق نتائج قيّمة باستمرار في بيئات سوقية سريعة التطور.
- التحليل التاريخي (سنتان)، سنة الأساس، التوقعات (7 سنوات) مع معدل النمو السنوي المركب
- تحليل PEST و SWOT
- حجم السوق والقيمة / الحجم - عالمي، إقليمي، بلد
- الصناعة والمنافسة
- مجموعة بيانات إكسل
التقارير الحديثة
شهادات العملاء
تقرير سوق أنظمة SCADA من Insight Partners شامل، ويقدم رؤى قيّمة حول الاتجاهات الحالية والتوقعات المستقبلية. تميّز الفريق باحترافية عالية وسرعة في الاستجابة ودعم مستمر طوال الوقت. نحن راضون جدًا ونوصي بشدة بخدماتهم.
ران كيديم شريك, شركة ريالي تكنولوجيز المحدودةطلبتُ تقريرًا عن سوق برمجيات محدد، وأعدّه الفريق في غضون أيام قليلة. كانت المعلومات ذات صلة وثيقة وعرضها جيد. ثم طلبتُ بعض التعديلات والإضافات على التقرير. وكان الفريق متجاوبًا للغاية، وحصلتُ على التقرير النهائي في أقل من أسبوع.
جان هيرفيه جين رئيس مجلس الإدارة, فيوتشر أناليتيكاعملنا مع شركة "إنسايت بارتنرز" لإجراء دراسة سوقية وتوقعات مهمة. زودونا برؤى واضحة حول الفرص والمخاطر، مما ساعدنا في صياغة خططنا. كانت أبحاثهم سهلة الاستخدام ومبنية على بيانات دقيقة، مما ساعدنا على اتخاذ قرارات ذكية وواثقة. نوصي بهم بشدة.
بيوش ناجبال نائب الرئيس الأول, شعاع عالي عالميقدّمت شركة Insight Partners أبحاثًا سوقية ثاقبة ومنظمة جيدًا بخبرة واسعة في هذا المجال. تميّز فريقهم بالاحترافية وسرعة الاستجابة طوال الوقت. وسهّل موقعهم الإلكتروني سهل الاستخدام الوصول إلى تقارير القطاع. نوصي بهم بشدة لخدمات بحثية موثوقة وعالية الجودة.
يوكيهيكو أداتشي المدير التنفيذي, ديب بلو، ذ.م.م.هذه أول مرة أشتري فيها تقرير سوق من The Insight Partners. رغم أنني كنت مترددًا في البداية، إلا أنني زرت موقعهم الإلكتروني وشعرت براحة أكبر للمخاطرة وشراء تقرير السوق. أنا راضٍ تمامًا عن جودة التقرير وخدمة العملاء. كانت لديّ عدة أسئلة وتعليقات حول التقرير الأولي، ولكن بعد بضع محادثات عبر البريد الإلكتروني مع محللهم، أعتقد أن لديّ تقريرًا يمكنني استخدامه كمدخل لعملية التخطيط الاستراتيجي لدينا. شكرًا جزيلاً لكم على تخصيص وقتكم الإضافي وجعل هذه التجربة إيجابية. سأوصي بخدماتكم للآخرين بالتأكيد، وستكونون أول من ألجأ إليه عندما نحتاج إلى المزيد من بيانات السوق.
جون سوزوكي الرئيس والرئيس التنفيذي وعضو مجلس الإدارة, بي كيه تكنولوجيزأود أن أقدّر دعمكم واحترافيتكم في الاستجابة لطلبي للحصول على معلومات بشأن سوق التشخيص المخبري للأمراض المعدية في نيجيريا. كما أُقدّر صبركم وتوجيهكم، واستعدادكم لتقديم خصم، مما مكّننا في النهاية من إتمام الصفقة. أتطلع إلى التعامل مع "ذا إنسايت بارتنرز" مستقبلًا، كل ذلك بفضل الانطباع الذي تركتموه لديّ نتيجةً لهذا اللقاء الأول.
الدكتور تشيجيوك أونيا المدير الإداري, شركة باينكريست للرعاية الصحية المحدودةسبب الشراء
- اتخاذ قرارات مدروسة
- فهم ديناميكيات السوق
- تحليل المنافسة
- رؤى العملاء
- توقعات السوق
- تخفيف المخاطر
- التخطيط الاستراتيجي
- مبررات الاستثمار
- تحديد الأسواق الناشئة
- تحسين استراتيجيات التسويق
- تعزيز الكفاءة التشغيلية
- مواكبة التوجهات التنظيمية


 احصل على عينة مجانية ل - تحليلات الإنفاق لسوق الإلكترونيات وأشباه الموصلات