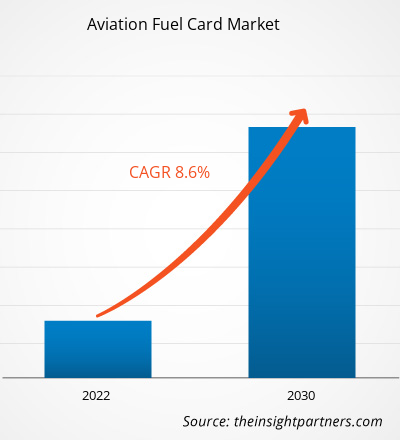
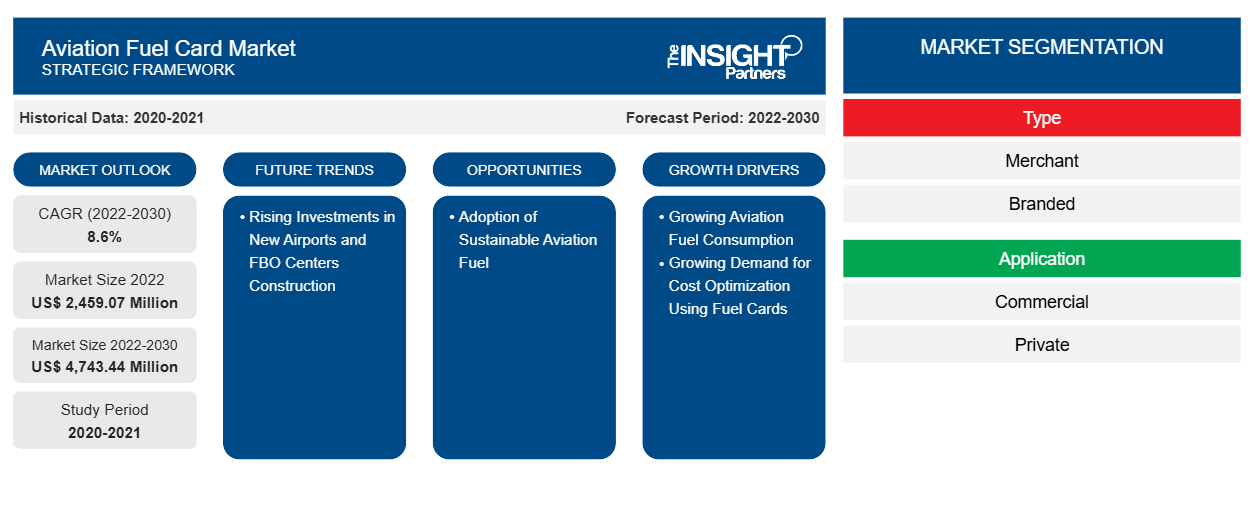
Das Marktvolumen für Flugtankkarten soll von 2.459,07 Millionen US-Dollar im Jahr 2022 auf 4.743,44 Millionen US-Dollar im Jahr 2030 anwachsen. Für den Markt wird für den Zeitraum 2022–2030 eine durchschnittliche jährliche Wachstumsrate (CAGR) von 8,6 % erwartet.
Traditionell hat die Luftfahrtindustrie ihre Zahlungen für Treibstoff auf verschiedene Arten getätigt, je nach den wirtschaftlichen Bedingungen und bestehenden Vereinbarungen der Treibstoffindustrie und der Fluggesellschaft. Fluggesellschaften und andere Luftfahrtunternehmen kaufen Treibstoff häufig auf dem Spotmarkt, entweder direkt von Ölfirmen oder über Treibstoffmakler. In solchen Situationen wird das Luftfahrtunternehmen den Treibstoff höchstwahrscheinlich mit einer Mischung aus Bargeld und Kredit bezahlen. Insgesamt wird die von der Luftfahrtindustrie verwendete Zahlungsmethode für den Treibstoffkauf von einer Vielzahl von Kriterien bestimmt, wie z. B. der Größe des Unternehmens, seinem Standort, seiner Einkaufsstrategie, den Marktbedingungen und den verfügbaren Möglichkeiten. Firmenkarten mit hohem Limit und integrierter Kostenmanagementsoftware können die Überwachung der Treibstoffzahlungen erheblich erleichtern. Karten mit hohem Limit bieten Unternehmen viel mehr Zahlungsflexibilität, was bedeutet, dass sie ihren Betrieb ohne Bankverzögerungen und Kreditgebühren aufrechterhalten können. Darüber hinaus bieten Firmenkreditkarten mit hohem Limit von Ausgabenmanagementunternehmen im Gegensatz zu Tankkarten, die selten mit Kostenmanagementsoftware verknüpft sind , ein vollständig integriertes Erlebnis. Firmenkreditkarten haben es einfach gemacht, Treibstoffrechnungen zu zentralisieren und den gesamten Kostenmanagementprozess zu rationalisieren. Anstatt sich auf verschiedene Zahlungsmethoden oder Rückerstattungen zu verlassen, kann eine einzige Kreditkarte für alle kraftstoffbezogenen Einkäufe verwendet werden, was die Nachverfolgung und Verwaltung der Ausgaben erleichtert. Die Konsolidierung der Kraftstoffausgaben mit einer Geschäftskreditkarte kann zur Entwicklung stärkerer Verbindungen mit Kraftstoffanbietern beitragen. Luftfahrtunternehmen, die häufig eine einzige Karte für Kraftstofftransaktionen verwenden, können in Bezug auf Mengenrabatte oder günstige Konditionen eine stärkere Verhandlungsposition gegenüber Kraftstoffanbietern haben. Daher behindern die Vorteile, die andere alternative Methoden bieten, das Wachstum des Marktes für Kraftstoffkarten für Luftfahrtunternehmen .
Marktanalyse für Flugbenzinkarten
Viele Kraftstoffhersteller und Fluglinienbetreiber ergreifen Initiativen zur Entwicklung und Einführung von nachhaltigem Flugkraftstoff. 2023 unterzeichneten Vertreter von Boeing und Zero Petroleum auf der Dubai Airshow eine Vereinbarung zur Beschleunigung der Entwicklung von synthetischem nachhaltigem Flugkraftstoff (SAF). 2023 unterstützte Neste den Flughafen Trollhättan-Vänersborg und die Fluglinie Västflyg dabei, die weltweit erste Fluglinie zu werden, die auf allen Flügen nachhaltigen Flugkraftstoff einsetzt. 2023 erklärte sich Emirates bereit, im Rahmen einer Partnerschaft mit Shell Aviation etwa 300.000 Gallonen gemischten nachhaltigen Flugkraftstoff (SAF) an das internationale Drehkreuz der Fluglinie in Dubai (DXB) zu liefern. Solche Initiativen sollen die Einführung von nachhaltigem Flugkraftstoff erhöhen. Anbieter von Flugkraftstoffkarten können ihr Geschäft ausbauen, indem sie attraktive Angebote und Rabatte beim Kauf von nachhaltigem Flugkraftstoff anbieten. Dies wird letztendlich zu einer stärkeren Einführung und Nutzung von Flugkraftstoffkarten führen. Darüber hinaus können Tankkartendienstleister durch Partnerschaften mit Festnetzbetreibern das Netzwerk zur Versorgung mit nachhaltigem Flugkraftstoff erweitern. Daher wird erwartet, dass der Anstieg der Transaktionen mit nachhaltigem Flugkraftstoff im Prognosezeitraum reichlich Chancen für das Wachstum des Marktes für Flugkraftstoffkarten bietet.
Marktübersicht für Flugbenzinkarten
Die Rolle der Tankkartenanbieter im Ökosystem des Marktes für Flugbenzinkarten ist entscheidend, um das reibungslose Funktionieren und die Zuverlässigkeit von Tankkarten zu gewährleisten. Tankkartenanbieter spielen eine wichtige Rolle bei der Bereitstellung von Tankkartendiensten für Endverbraucher wie kommerzielle und private Fluggesellschaften. Tankkartenanbieter gewährleisten eine sichere und effiziente Rolle bei Zahlungsprozessen für Flugbenzin. Große Tankkartenanbieter, die Tankkartendienste anbieten, werden als Markentankkartenanbieter bezeichnet. Dazu gehören BP plc, Shell Global, ExxonMobil, Titan Aviation Fuels, Jio-BP, AEGFUELS und TotalEnergies Aviation. Diese Unternehmen sind selbst für die Bereitstellung von Flugbenzin und Flugbenzinkarten verantwortlich und gewährleisten so eine zuverlässige Lieferkette für Flugbenzinkarten. Dritte und private Unternehmen, die Tankkartendienste anbieten, werden als Handelstankkartenanbieter bezeichnet. Dazu gehören World Fuel Services, CSI global-fleet, Aviation Pros und Avfuel Corporation. Handelstankkartenanbieter sind Unternehmen, die eine Partnerschaft oder Zusammenarbeit mit großen Flugbenzinanbietern eingehen und einen reibungslosen und sicheren Zahlungsprozess gewährleisten. Diese Partnerschaft oder Zusammenarbeit beinhaltet die Integration von Systemen, um effiziente Transaktionen zu ermöglichen und eine zuverlässige Kraftstoffversorgung aufrechtzuerhalten.
Passen Sie diesen Bericht Ihren Anforderungen an
Sie erhalten kostenlos individuelle Anpassungen an jedem Bericht, einschließlich Teilen dieses Berichts oder einer Analyse auf Länderebene, eines Excel-Datenpakets sowie tolle Angebote und Rabatte für Start-ups und Universitäten.
-
Holen Sie sich die wichtigsten Markttrends aus diesem Bericht.Dieses KOSTENLOSE Beispiel umfasst eine Datenanalyse von Markttrends bis hin zu Schätzungen und Prognosen.
Treiber und Chancen auf dem Markt für Flugtankkarten
Steigender Treibstoffverbrauch
Aufgrund der hohen Nachfrage nach Flugreisen ist der Gesamttreibstoffverbrauch gestiegen. Im Jahr 2022 beförderten US-Fluggesellschaften 194 Millionen mehr Passagiere als im Jahr 2021, ein Anstieg von 30 % gegenüber dem Vorjahr. Von Januar bis Dezember 2022 beförderten US-Fluggesellschaften 853 Millionen Passagiere, gegenüber 658 Millionen im Jahr 2021 und 388 Millionen im Jahr 2020. Im Jahr 2021 erlebte die Europäische Union (EU) einen deutlichen Aufschwung im Flugverkehr, da die Gesamtzahl der Passagiere 373 Millionen erreichte. Diese Zahl spiegelt einen bemerkenswerten Anstieg von 34,9 % gegenüber dem Vorjahr 2020 wider. Der Anstieg der Fluggastzahlen war in Kroatien zu beobachten, das im Vergleich zum Jahr 2021 einen bemerkenswerten Anstieg von 84 % verzeichnete. Darüber hinaus verzeichneten Zypern und Griechenland erhebliche Wachstumsraten von 104,8 % bzw. 85,9 %. Dieser starke Anstieg der Passagierzahlen, insbesondere in Ländern wie Kroatien, Zypern und Griechenland, unterstreicht die wachsende Nachfrage nach Flugreisen und den damit verbundenen Treibstoffbedarf.
Steigende Investitionen in den Bau neuer Flughäfen und stationärer Betreiberzentren
Verschiedene Industrie- und Entwicklungsländer auf der ganzen Welt konzentrieren sich darauf, die Gesamtzahl ihrer Flughäfen zu erhöhen. Im Jahr 2023 beabsichtigt die Regierung Vietnams, bis 2030 mehr als 30 Flughäfen zu bauen, um Tourismus und Handel anzukurbeln. Das Land hat 22 Flughäfen errichtet; die Regierung konzentriert sich jedoch auf den Bau neuer Flughäfen, um der wachsenden Zahl von Flugzeugen gerecht zu werden. Die vietnamesische Regierung genehmigte 2021 den Bau des internationalen Flughafens Long Thanh, die Fertigstellung ist für 2025 geplant. Der internationale Flughafen Long Thanh wird Vietnams größter Flughafen sein und eine Kapazität von bis zu 100 Millionen Menschen pro Jahr haben. Die Regierung beabsichtigt, bis 2030 auf mehr als 30 Flughäfen zu expandieren, was das Engagement des Landes für die Entwicklung seiner Luftfahrtindustrie zeigt. Im Jahr 2023 kündigte Saudi-Arabien den Ausbau seiner inländischen Luftfahrtindustrie an, der eine Investition von 100 Milliarden US-Dollar erfordern wird. Im Jahr 2023 kündigte Indien Investitionen in Höhe von 12 Milliarden US-Dollar in den nächsten zwei Jahren in Flughäfen an, darunter die Bestellung von Hunderten neuer Flugzeuge, um der steigenden Nachfrage nach Reisen gerecht zu werden, die eine Belastung für die derzeitige Infrastruktur darstellt.
Segmentierungsanalyse des Marktberichts für Treibstoffkarten für Flugzeuge
Wichtige Segmente, die zur Ableitung der Marktanalyse für Flugtankkarten beigetragen haben, sind Typ, Anwendung und Geografie.
- Basierend auf dem Typ wurde der Markt für Flugbenzinkarten in Händler- und Markenprodukte segmentiert. Das Händlersegment hatte im Jahr 2022 einen größeren Marktanteil.
- Nach Anwendung wurde der Markt für Flugtankkarten in gewerblich und privat unterteilt. Das gewerbliche Segment hatte im Jahr 2022 den größten Marktanteil.
Marktanteilsanalyse für Flugkraftstoffkarten nach geografischer Lage
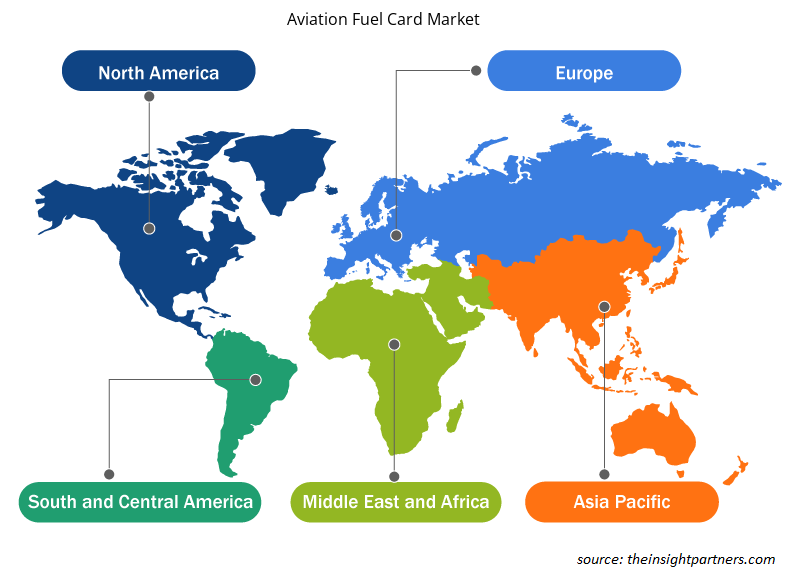
Der geografische Umfang des Marktberichts für Flugtankkarten ist hauptsächlich in fünf Regionen unterteilt: Nordamerika, Europa, Asien-Pazifik, Naher Osten und Afrika sowie Südamerika.
Nordamerika hat den Markt für Flugtankkarten im Jahr 2022 dominiert und wird seine Dominanz voraussichtlich auch im Prognosezeitraum beibehalten. Die nordamerikanische Flugtankkartenbranche wird hauptsächlich durch die wachsende Bekanntheit des Tankkartenkonzepts vorangetrieben. Darüber hinaus treibt die wachsende Luftfahrtindustrie in Ländern wie den USA und Kanada den Markt für Flugtankkarten weiter an. Die Luftfahrtindustrie ist eine der bemerkenswertesten Branchen in den USA. Laut den von Airlines for America im Jahr 2023 veröffentlichten Daten machte die kommerzielle Luftfahrt 5 % des US-BIP und 1,25 Billionen US-Dollar im Jahr 2022 aus. Darüber hinaus hat ein großes Netzwerk von Flughäfen und Festnetzbetreibern in den USA die zunehmende Nutzung von Flugtankkarten unterstützt. Im Jahr 2022 betrieben die USA mehr als 5.100 öffentliche Flughäfen und 14.850 private Flughäfen. Die Luftverkehrsbranche trägt erheblich zur kanadischen Wirtschaft bei. Laut der International Air Transport Association (IATA) trug die Branche 2018 37 Milliarden US-Dollar zum kanadischen BIP bei. Der steigende Verbrauch von Flugbenzin und die steigenden Flugpreise treiben den Markt für Flugbenzinkarten in Mexiko an. Im Juni 2022 stiegen die Großhandelspreise des staatlichen Unternehmens Pemex dramatisch an. Die USA hatten 2022 den größten Anteil am nordamerikanischen Markt für Flugbenzinkarten.
Regionale Einblicke in den Markt für Flugtankkarten
Die regionalen Trends und Faktoren, die den Markt für Flugtankkarten im Prognosezeitraum beeinflussen, wurden von den Analysten von Insight Partners ausführlich erläutert. In diesem Abschnitt werden auch die Marktsegmente und die Geografie von Flugtankkarten in Nordamerika, Europa, im asiatisch-pazifischen Raum, im Nahen Osten und Afrika sowie in Süd- und Mittelamerika erörtert.

- Erhalten Sie regionale Daten zum Markt für Flugtankkarten
Umfang des Marktberichts über Treibstoffkarten für Flugzeuge
| Berichtsattribut | Details |
|---|---|
| Marktgröße im Jahr 2022 | 2.459,07 Millionen US-Dollar |
| Marktgröße bis 2030 | 4.743,44 Millionen US-Dollar |
| Globale CAGR (2022-2030) | 8,6 % |
| Historische Daten | 2020-2021 |
| Prognosezeitraum | 2022–2030 |
| Abgedeckte Segmente |
Nach Typ
|
| Abgedeckte Regionen und Länder |
Nordamerika
|
| Marktführer und wichtige Unternehmensprofile |
|
Dichte der Marktteilnehmer für Flugbenzinkarten: Auswirkungen auf die Geschäftsdynamik verstehen
Der Markt für Flugbenzinkarten wächst rasant, angetrieben durch die steigende Nachfrage der Endnutzer aufgrund von Faktoren wie sich entwickelnden Verbraucherpräferenzen, technologischen Fortschritten und einem größeren Bewusstsein für die Vorteile des Produkts. Mit steigender Nachfrage erweitern Unternehmen ihr Angebot, entwickeln Innovationen, um die Bedürfnisse der Verbraucher zu erfüllen, und nutzen neue Trends, was das Marktwachstum weiter ankurbelt.
Die Marktteilnehmerdichte bezieht sich auf die Verteilung der Firmen oder Unternehmen, die in einem bestimmten Markt oder einer bestimmten Branche tätig sind. Sie gibt an, wie viele Wettbewerber (Marktteilnehmer) in einem bestimmten Marktraum im Verhältnis zu seiner Größe oder seinem gesamten Marktwert präsent sind.
Die wichtigsten auf dem Markt für Flugtankkarten tätigen Unternehmen sind:
- Shell Plc
- BP Plc
- Die Associated Energy Group LLC
- Viva Energy Group Ltd
- TITAN Aviation Fuels Inc
Haftungsausschluss : Die oben aufgeführten Unternehmen sind nicht in einer bestimmten Reihenfolge aufgeführt.

- Überblick über die wichtigsten Akteure auf dem Markt für Flugbenzinkarten
Neuigkeiten und aktuelle Entwicklungen zum Markt für Flugtankkarten
Der Markt für Flugbenzinkarten wird durch die Erhebung qualitativer und quantitativer Daten nach Primär- und Sekundärforschung bewertet, die wichtige Unternehmensveröffentlichungen, Verbandsdaten und Datenbanken umfasst. Im Folgenden finden Sie eine Liste der Entwicklungen auf dem Markt für Flugbenzinkarten und Strategien:
- Im September 2023 startete Air bp, der internationale Anbieter von Flugkraftstoffprodukten und -dienstleistungen, im Rahmen einer neu vereinbarten Agenturkooperation mit ExecuJet das Angebot von Jet-A1-Kraftstoff am Terminal der Allgemeinen Luftfahrt (GA) des Flughafens Berlin Brandenburg (BER). (Quelle: Air BP, Pressemitteilung/Unternehmenswebsite/Newsletter)
- Im Oktober 2022 startete TreviPay, das globale B2B-Zahlungs- und Rechnungsnetzwerk, das TreviPay Aviation Network, betrieben von KHI, um eine Co-Branding-, Closed-Loop-Kartenlösung anzubieten, die auf die Bedürfnisse von FBOs (Fixed-Base Operators) und Flugunterstützungsdienstleistungsorganisationen zugeschnitten ist, die die allgemeine und militärische Luftfahrtindustrie und deren Kunden bedienen. (Quelle: TreviPay, Pressemitteilung/Unternehmenswebsite/Newsletter)
Marktbericht zu Treibstoffkarten für Flugzeuge – Umfang und Ergebnisse
Der Bericht „Marktgröße und Prognose für Treibstoffkarten im Flugverkehr (2020–2030)“ bietet eine detaillierte Analyse des Marktes, die die folgenden Bereiche abdeckt:
- Marktgröße und Prognose auf globaler, regionaler und Länderebene für alle wichtigen Marktsegmente, die im Rahmen des Projekts abgedeckt sind
- Marktdynamik wie Treiber, Beschränkungen und wichtige Chancen
- Wichtige Zukunftstrends
- Detaillierte Porter's Five Forces Analyse
- Globale und regionale Marktanalyse mit wichtigen Markttrends, wichtigen Akteuren, Vorschriften und aktuellen Marktentwicklungen
- Branchenlandschaft und Wettbewerbsanalyse, einschließlich Marktkonzentration, Heatmap-Analyse, prominenten Akteuren und aktuellen Entwicklungen
- Detaillierte Firmenprofile mit SWOT-Analyse
- Historische Analyse (2 Jahre), Basisjahr, Prognose (7 Jahre) mit CAGR
- PEST- und SWOT-Analyse
- Marktgröße Wert/Volumen – Global, Regional, Land
- Branchen- und Wettbewerbslandschaft
- Excel-Datensatz
Aktuelle Berichte
Erfahrungsberichte
Grund zum Kauf
- Fundierte Entscheidungsfindung
- Marktdynamik verstehen
- Wettbewerbsanalyse
- Kundeneinblicke
- Marktprognosen
- Risikominimierung
- Strategische Planung
- Investitionsbegründung
- Identifizierung neuer Märkte
- Verbesserung von Marketingstrategien
- Steigerung der Betriebseffizienz
- Anpassung an regulatorische Trends


 Kostenlose Probe anfordern für - Markt für Flugkraftstoffkarten