Markt für hydrografische Vermessungen – Erkenntnisse durch globale und regionale Analyse – Prognose bis 2031
Historische Daten : 2021-2022 | Basisjahr : 2023 | Prognosezeitraum : 2023-2031Marktgröße und Prognose für hydrografische Vermessungen (2021 – 2031), Bericht über globale und regionale Anteile, Trends und Wachstumschancenanalysen: Nach Komponente (Software, Dienstleistungen), Endbenutzer (Marine und Öl & Gas) und Geografie
- Status : Veröffentlichte Daten
- Berichtscode : TIPRE00019125
- Kategorie : Technologie, Medien und Telekommunikation
- Anzahl der Seiten : 150
- Verfügbare Berichtsformate :


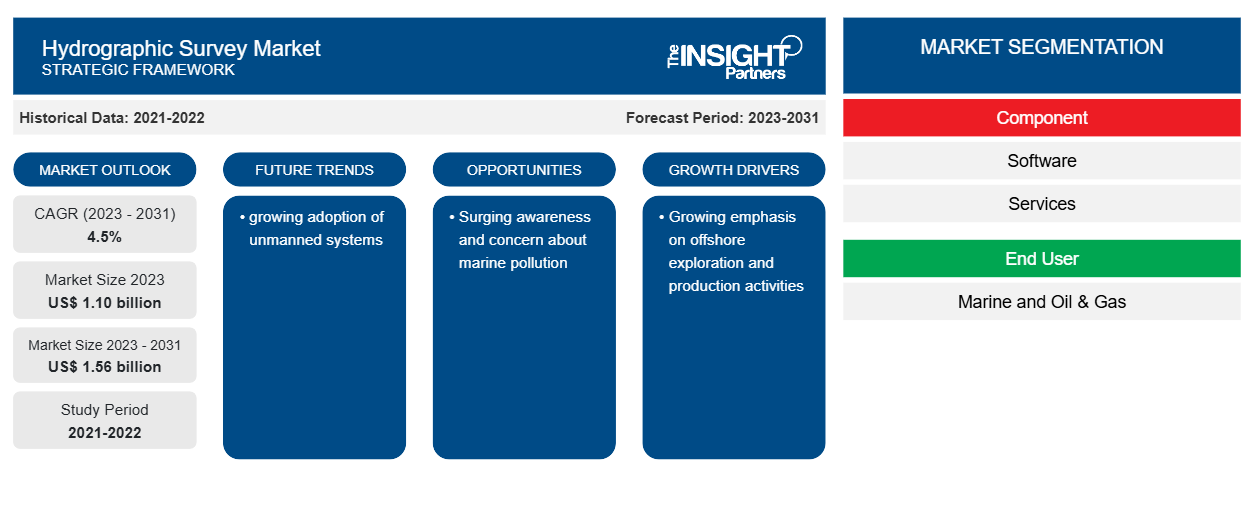
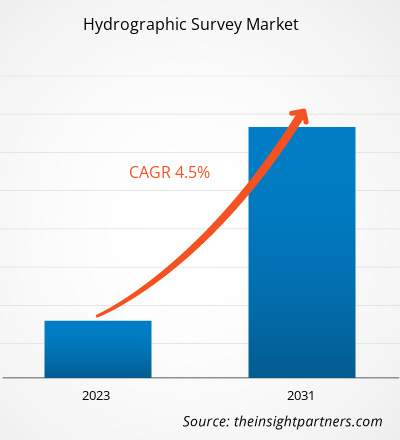
Der Markt für hydrografische Vermessungen soll von 1,10 Milliarden US-Dollar im Jahr 2023 auf 1,56 Milliarden US-Dollar im Jahr 2031 wachsen; von 2023 bis 2031 wird mit einer durchschnittlichen jährlichen Wachstumsrate von 4,5 % gerechnet. Die zunehmende Einführung unbemannter Systeme dürfte ein wichtiger Markttrend für hydrografische Vermessungen bleiben.
Marktanalyse für hydrografische Vermessungen
Der steigende Bedarf an genauen und aktuellen Seekarten und -plänen. Diese sind für eine sichere Navigation sowie für Offshore-Explorations- und Produktionsaktivitäten unerlässlich und ein wichtiger Wachstumstreiber für den Markt für hydrografische Vermessungen.
Marktübersicht für hydrografische Vermessungen
Eine hydrografische Vermessung, auch bathymetrische Vermessung genannt, ist ein Verfahren, bei dem verschiedene Faktoren unter der Wasseroberfläche gemessen werden. Diese Vermessung kann sowohl in stehendem als auch in fließendem Wasser durchgeführt werden. Die Hauptziele der hydrografischen Vermessungsgeräte sind die Messung der Gezeiten an Meeresküsten, die Unterstützung beim Bau von Küstenschutzanlagen und Häfen, die Errichtung von Nivellierungsdämmen und die Bestimmung der Sohlentiefe. Darüber hinaus können hydrografische Vermessungen Lotungen für die Navigation identifizieren, Felsen und Sandbänke lokalisieren und das Volumen von Unterwasserausgrabungen messen . Diese Vermessungen werden auch in Bewässerungs- und Landentwässerungssystemen verwendet, um die Richtung und Strömung des Wassers zu bestimmen, sowie für Wassersysteme und Hochwasserschutz.
Passen Sie diesen Bericht Ihren Anforderungen an
Sie erhalten kostenlose Anpassungen an jedem Bericht, einschließlich Teilen dieses Berichts oder einer Analyse auf Länderebene, eines Excel-Datenpakets sowie tolle Angebote und Rabatte für Start-ups und Universitäten.
Markt für hydrografische Vermessungen: Strategische Einblicke
-
Holen Sie sich die wichtigsten Markttrends aus diesem Bericht.Dieses KOSTENLOSE Beispiel umfasst eine Datenanalyse von Markttrends bis hin zu Schätzungen und Prognosen.
Treiber und Chancen auf dem Markt für hydrografische Vermessungen
Zunehmende Betonung von Offshore-Explorations- und Produktionsaktivitäten begünstigt den Markt
Hydrographische Vermessungen spielen eine entscheidende Rolle bei der Unterstützung von Offshore-Explorations- und -Produktionsaktivitäten. Diese Vermessungen umfassen die Messung und Beschreibung von Merkmalen, die sich auf die Seeschifffahrt, den Meeresbau, Baggerarbeiten, Offshore-Ölexploration und -bohrungen sowie ähnliche Aktivitäten auswirken. Offshore-Explorations- und -Produktionsaktivitäten erfordern detaillierte Vermessungen des Meeresbodens und der Unterwasserstrukturen, um einen sicheren und effizienten Betrieb zu gewährleisten. Hydrographische Vermessungen liefern wichtige Informationen über die physikalischen Eigenschaften der Unterwasserumgebung, einschließlich Tiefenmessungen, Küstenlinien, Gezeiten, Strömungen, Meeresbodenbedingungen und Unterwasserhindernisse.
Wachsendes Bewusstsein und Besorgnis über die Meeresverschmutzung
Das zunehmende Bewusstsein und die Besorgnis über die Meeresverschmutzung haben zu einer wachsenden Nachfrage nach hydrografischen Untersuchungen geführt. Diese Untersuchungen spielen eine entscheidende Rolle bei der Überwachung und Bewertung der Auswirkungen der Verschmutzung auf die Meeresökosysteme. Die Meeresverschmutzung hat vielfältige negative Auswirkungen auf die Meeresökosysteme. Beispielsweise verringern Schadstoffe auf Erdölbasis die Photosynthese in Meeresmikroorganismen, die Sauerstoff erzeugen. Darüber hinaus führt die zunehmende Aufnahme von Kohlendioxid in die Meere zur Versauerung der Ozeane, die Korallenriffe zerstört, die Entwicklung von Schalentieren beeinträchtigt, kalziumhaltige Mikroorganismen an der Basis des marinen Nahrungsnetzes auflöst und die Toxizität einiger Schadstoffe erhöht. Hydrografische Untersuchungen sind wichtige Instrumente zur Überwachung und Bewertung der Auswirkungen der Verschmutzung auf die Meeresökosysteme. Diese Untersuchungen liefern wertvolle Daten zu den physikalischen Eigenschaften der Meeresumwelt, einschließlich Wassertiefe, Meeresbodentopografie und Vorhandensein von Schadstoffen.
Segmentierungsanalyse des Marktberichts zur hydrographischen Vermessung
Wichtige Segmente, die zur Ableitung der Marktanalyse für hydrografische Vermessungen beigetragen haben, sind Komponenten und Endbenutzer.
- Basierend auf den Komponenten ist der Markt in Software und Dienstleistungen unterteilt. Das Softwaresegment hatte im Jahr 2023 einen größeren Marktanteil.
- In Bezug auf den Endverbraucher ist der Markt in die Bereiche Schifffahrt sowie Öl und Gas unterteilt. Das Schifffahrtssegment hatte im Jahr 2023 einen größeren Marktanteil.
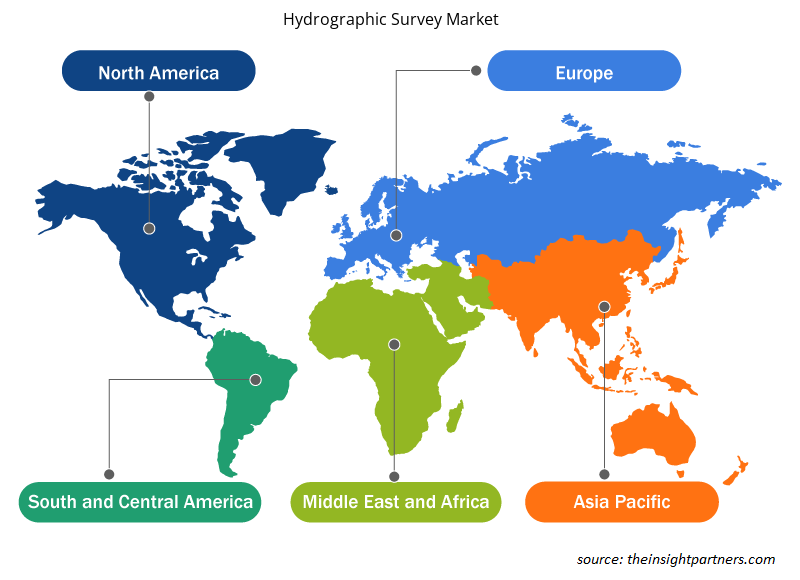
Marktanteilsanalyse für hydrographische Vermessungen nach geografischer Lage
Der geografische Umfang des Marktberichts zur hydrografischen Vermessung ist hauptsächlich in fünf Regionen unterteilt: Nordamerika, Asien-Pazifik, Europa, Naher Osten und Afrika sowie Südamerika/Süd- und Mittelamerika. Nordamerika dominierte den Markt für hydrografische Vermessungen im Jahr 2023. Nordamerika setzt in hohem Maße Software und Dienste für hydrografische Vermessungen ein, um Daten über die Wassertiefe, die Form des Meeresbodens und der Küstenlinie sowie andere physikalische Merkmale von Gewässern zu erhalten. Diese Einführung wird durch die Notwendigkeit vorangetrieben, die Gewässer zu verbessern und sicherzustellen, dass sie frei von größeren Problemen sind, die in Zukunft zu einem hohen Wartungsaufwand führen könnten. Darüber hinaus treiben kontinuierliche technologische Fortschritte, einschließlich der Entwicklung innovativer Sonarsysteme, LiDAR und unbemannter Systeme, den Markt für hydrografische Vermessungen in Nordamerika an.
Regionale Einblicke in den Markt für hydrografische Vermessungen
Die regionalen Trends und Faktoren, die den Markt für hydrografische Vermessungen im Prognosezeitraum beeinflussen, wurden von den Analysten von Insight Partners ausführlich erläutert. In diesem Abschnitt werden auch die Marktsegmente und die Geografie für hydrografische Vermessungen in Nordamerika, Europa, im asiatisch-pazifischen Raum, im Nahen Osten und Afrika sowie in Süd- und Mittelamerika erörtert.
- Erhalten Sie regionalspezifische Daten zum Markt für hydrografische Vermessungen
Umfang des Marktberichts zur hydrographischen Vermessung
| Berichtsattribut | Details |
|---|---|
| Marktgröße im Jahr 2023 | 1,10 Milliarden US-Dollar |
| Marktgröße bis 2031 | 1,56 Milliarden US-Dollar |
| Globale CAGR (2023 - 2031) | 4,5 % |
| Historische Daten | 2021-2022 |
| Prognosezeitraum | 2023–2031 |
| Abgedeckte Segmente |
Nach Komponente
|
| Abgedeckte Regionen und Länder |
Nordamerika
|
| Marktführer und wichtige Unternehmensprofile |
|
Marktteilnehmerdichte: Der Einfluss auf die Geschäftsdynamik
Der Markt für hydrografische Vermessungen wächst rasant, angetrieben durch die steigende Nachfrage der Endnutzer aufgrund von Faktoren wie sich entwickelnden Verbraucherpräferenzen, technologischen Fortschritten und einem größeren Bewusstsein für die Vorteile des Produkts. Mit steigender Nachfrage erweitern Unternehmen ihr Angebot, entwickeln Innovationen, um die Bedürfnisse der Verbraucher zu erfüllen, und nutzen neue Trends, was das Marktwachstum weiter ankurbelt.
Die Marktteilnehmerdichte bezieht sich auf die Verteilung von Firmen oder Unternehmen, die in einem bestimmten Markt oder einer bestimmten Branche tätig sind. Sie gibt an, wie viele Wettbewerber (Marktteilnehmer) in einem bestimmten Marktraum im Verhältnis zu seiner Größe oder seinem gesamten Marktwert präsent sind.
Die wichtigsten auf dem Markt für hydrografische Vermessungen tätigen Unternehmen sind:
- BeamworX BV
- Hydromagisch
- Xylem Inc.
- Wollpert
- Norcom Technology Limited
- Teledyne Marine (Teledyne Technologies Incorporated)
Haftungsausschluss : Die oben aufgeführten Unternehmen sind nicht in einer bestimmten Reihenfolge aufgeführt.
- Überblick über die wichtigsten Akteure auf dem Markt für hydrografische Vermessungen
Neuigkeiten und aktuelle Entwicklungen zum Markt für hydrografische Vermessungen
Der Markt für hydrografische Vermessungen wird durch die Erhebung qualitativer und quantitativer Daten nach Primär- und Sekundärforschung bewertet, die wichtige Unternehmensveröffentlichungen, Verbandsdaten und Datenbanken umfasst. Im Folgenden finden Sie eine Liste der Entwicklungen auf dem Markt:
- Im Februar 2022 übernahm Woolpert, ein in den USA ansässiges Unternehmen, das auf hydrografisches Ingenieurwesen und Vermessung spezialisiert ist, eTrac Inc., ein schiffsbasiertes Unternehmen für hydrografische Vermessung und Meerestechnik. Ziel der Übernahme war es, Woolperts Lösungen in den Bereichen integrierte Architektur, Ingenieurwesen und Geodaten (AEG) zu verbessern. Die spezifischen finanziellen Details der Übernahme wurden nicht bekannt gegeben.
(Quelle: Woolpert, Pressemitteilung, 2022)
Marktbericht zur hydrografischen Vermessung – Umfang und Ergebnisse
Der Bericht „Marktgröße und Prognose für hydrografische Untersuchungen (2021–2031)“ bietet eine detaillierte Analyse des Marktes, die die folgenden Bereiche abdeckt:
- Marktgröße und Prognose auf globaler, regionaler und Länderebene für alle wichtigen Marktsegmente, die im Rahmen des Projekts abgedeckt sind
- Marktdynamik wie Treiber, Beschränkungen und wichtige Chancen
- Wichtige Zukunftstrends
- Detaillierte PEST/Porters Five Forces- und SWOT-Analyse
- Globale und regionale Marktanalyse mit wichtigen Markttrends, wichtigen Akteuren, Vorschriften und aktuellen Marktentwicklungen
- Branchenlandschaft und Wettbewerbsanalyse, einschließlich Marktkonzentration, Heatmap-Analyse, prominenten Akteuren und aktuellen Entwicklungen
- Detaillierte Firmenprofile

Ankita ist eine dynamische Marktforschungs- und Beratungsexpertin mit über 8 Jahren Erfahrung in den Bereichen Technologie, Medien, IKT sowie Elektronik und Halbleiter. Sie hat über 100 Beratungs- und Forschungsaufträge für globale Kunden wie Microsoft, Oracle, NEC Corporation, SAP, KPMG und Expeditors International erfolgreich geleitet und durchgeführt. Zu ihren Kernkompetenzen gehören Marktbewertung, Datenanalyse, Prognose, Strategieformulierung, Wettbewerbsbeobachtung und das Verfassen von Berichten. Ankita ist versiert in der Abwicklung kompletter Projektzyklen – von der Angebotserstellung vor dem Verkauf und Kundengesprächen bis hin zur Bereitstellung umsetzbarer Erkenntnisse nach dem Verkauf. Sie ist versiert in der Leitung funktionsübergreifender Teams, der Strukturierung komplexer Forschungsmodule und der Ausrichtung von Lösungen an kundenspezifischen Geschäftszielen. Ihre ausgezeichneten Kommunikationsfähigkeiten, Führungsqualitäten und Präsentationsfähigkeiten haben es ihr ermöglicht, in einem schnelllebigen und sich entwickelnden Marktumfeld stets wertorientierte Ergebnisse zu liefern.
- Historische Analyse (2 Jahre), Basisjahr, Prognose (7 Jahre) mit CAGR
- PEST- und SWOT-Analyse
- Marktgröße Wert/Volumen – Global, Regional, Land
- Branchen- und Wettbewerbslandschaft
- Excel-Datensatz
Erfahrungsberichte
Der SCADA-Systemmarktbericht von Insight Partners ist umfassend und bietet wertvolle Einblicke in aktuelle Trends und Zukunftsprognosen. Das Team war durchweg hochprofessionell, reaktionsschnell und hilfsbereit. Wir sind sehr zufrieden und können die Dienstleistungen wärmstens empfehlen.
RAN KEDEM Partner, Reali Technologies LTDsIch habe einen Bericht über einen sehr spezifischen Softwaremarkt angefordert, und das Team hat ihn innerhalb weniger Tage erstellt. Die Informationen waren sehr relevant und gut präsentiert. Anschließend habe ich einige Änderungen und Ergänzungen zum Bericht angefordert. Das Team reagierte erneut sehr schnell, und ich erhielt den Abschlussbericht in weniger als einer Woche.
JEAN-HERVE JENN Vorsitzende, Future AnalyticaWir haben mit The Insight Partners für eine wichtige Marktstudie und Prognose zusammengearbeitet. Sie gaben uns klare Einblicke in Chancen und Risiken, die uns bei der Gestaltung unserer Pläne halfen. Ihre Recherchen waren benutzerfreundlich und basierten auf soliden Daten. Sie halfen uns, kluge und sichere Entscheidungen zu treffen. Wir können sie wärmstens empfehlen.
PIYUSH NAGPAL Sr. Vizepräsident, Fernlicht GlobalDie Insight Partners lieferten aufschlussreiche, gut strukturierte Marktforschung mit fundierter Fachkompetenz. Ihr Team war durchweg professionell und reaktionsschnell. Die benutzerfreundliche Website ermöglichte den Zugriff auf Branchenberichte. Wir empfehlen sie wärmstens für zuverlässige und hochwertige Forschungsdienstleistungen.
YUKIHIKO ADACHI Geschäftsführer, Deep Blue, LLC.Dies ist das erste Mal, dass ich einen Marktbericht von The Insight Partners erworben habe. Obwohl ich zunächst unsicher war, besuchte ich die Website und fühlte mich dann sicherer, das Risiko einzugehen und einen Marktbericht zu kaufen. Ich bin mit der Qualität des Berichts und dem Kundenservice rundum zufrieden. Ich hatte einige Fragen und Anmerkungen zum ersten Bericht, aber nach einigen E-Mail-Gesprächen mit dem Analysten bin ich überzeugt, dass ich einen Bericht habe, den ich als Input für unseren strategischen Planungsprozess verwenden kann. Vielen Dank, dass Sie sich die Zeit genommen und dies zu einer positiven Erfahrung gemacht haben. Ich werde Ihren Service auf jeden Fall weiterempfehlen und Sie werden meine erste Anlaufstelle sein, wenn wir weitere Marktdaten benötigen.
JOHN SUZUKI Präsident und Chief Executive Officer, Vorstandsmitglied, BK TechnologiesIch möchte mich für Ihre Unterstützung und die Professionalität bedanken, die Sie bei der Bearbeitung meiner Informationsanfrage zum IVD-Markt für Infektionskrankheiten in Nigeria gezeigt haben. Ich schätze Ihre Geduld, Ihre Beratung und die Tatsache, dass Sie bereit waren, einen Rabatt anzubieten, der uns schließlich den Abschluss eines Geschäfts ermöglichte. Ich freue mich darauf, The Insight Partners in Zukunft wieder zu beauftragen, dank des Eindrucks, den Sie bei dieser ersten Begegnung bei mir hinterlassen haben.
DR. CHIJIOKE ONYIA GESCHÄFTSFÜHRERIN, PineCrest Healthcare Ltd.Grund zum Kauf
- Fundierte Entscheidungsfindung
- Marktdynamik verstehen
- Wettbewerbsanalyse
- Kundeneinblicke
- Marktprognosen
- Risikominimierung
- Strategische Planung
- Investitionsbegründung
- Identifizierung neuer Märkte
- Verbesserung von Marketingstrategien
- Steigerung der Betriebseffizienz
- Anpassung an regulatorische Trends


Exklusive Berichtsrabatte freischalten
Jetzt anfragen


 Kostenlose Probe anfordern für - Markt für hydrografische Vermessungen