Marktübersicht und Prognose für Massenspektrometrie-Software (2025-2031)
Historische Daten : 2021-2024 | Basisjahr : 2025 | Prognosezeitraum : 2026-2034Marktgröße und Prognose für Massenspektrometrie-Software (2021 - 2034), globaler und regionaler Marktanteil, Trend- und Wachstumschancenanalyse. Berichtsabdeckung: Nach Bereitstellungstyp (Cloud-basiert und On-Premises) und Anwendung (Pharmazeutische Unternehmen, Forschungsorganisationen und -institutionen sowie Sonstige).
- Status : Veröffentlichte Daten
- Berichtscode : TIPRE00016153
- Kategorie : Technologie, Medien und Telekommunikation
- Anzahl der Seiten : 150
- Verfügbare Berichtsformate :


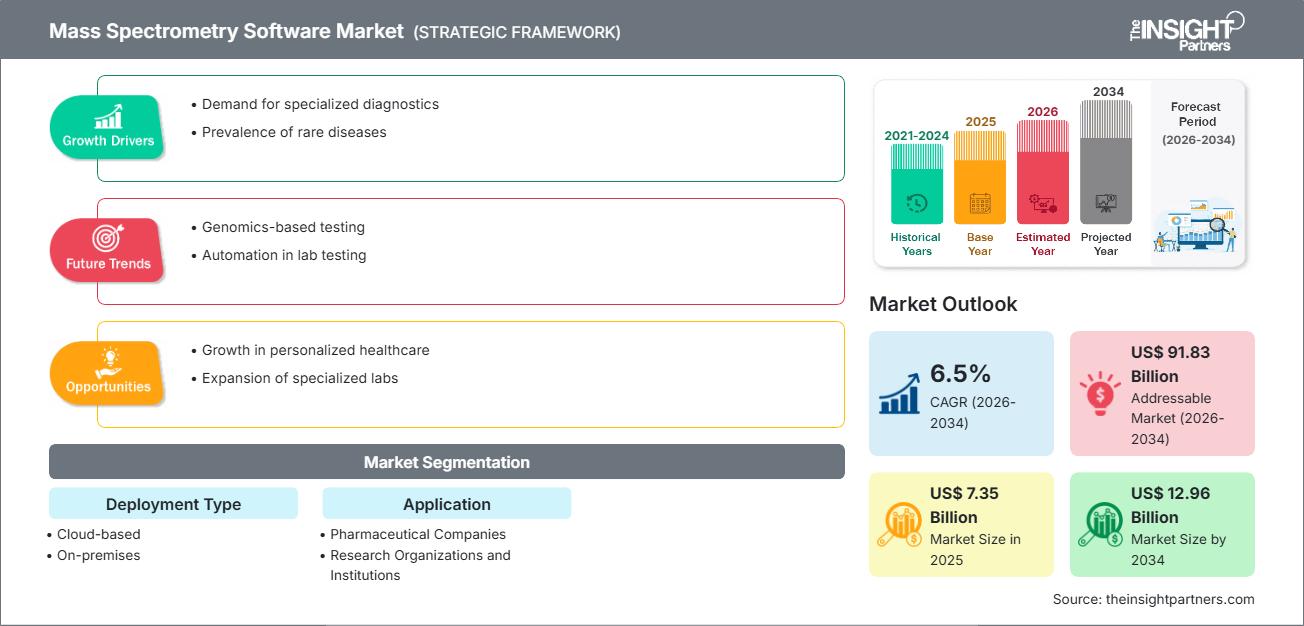
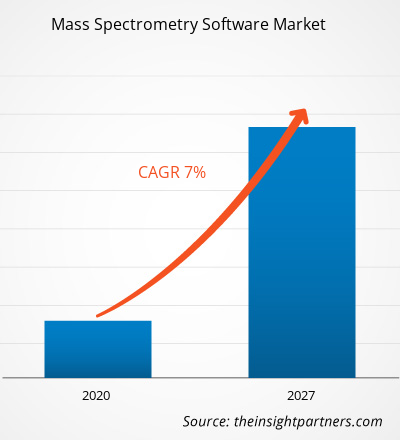
Es wird erwartet, dass der Markt für Massenspektrometrie-Software von 7,35 Mrd. US-Dollar im Jahr 2025 auf 12,96 Mrd. US-Dollar im Jahr 2034 anwachsen wird, was einer durchschnittlichen jährlichen Wachstumsrate (CAGR) von 6,5 % im Zeitraum 2026–2034 entspricht.
Marktanalyse für Massenspektrometrie-Software
Die Prognose für den Markt für Massenspektrometrie-Software deutet auf ein anhaltendes Wachstum hin, begünstigt durch vermehrte Anwendungen in der Genomik und Proteomik sowie die steigende Nachfrage in Forschung und Pharmazie. Treiber des Marktes sind der Bedarf an hoher Datendurchsatzrate und präziser Datenverarbeitung sowie die zunehmende Nutzung cloudbasierter Lösungen zur Bewältigung von Skalierbarkeits- und Fernzugriffsproblemen. Darüber hinaus fördern KI/ML-gestützte Fortschritte in der Dateninterpretation und -automatisierung das Marktwachstum zusätzlich. Die Integration von Massenspektrometern und steigende Investitionen in Forschung und Entwicklung in den Lebenswissenschaften tragen wesentlich zur Marktdynamik bei.
Marktübersicht für Massenspektrometrie-Software
Software für die Massenspektrometrie unterstützt den Arbeitsablauf in diesem Bereich. Sie übernimmt wichtige Aufgaben wie Datenerfassung, Datenverarbeitung, Visualisierung und die Steuerung von Massenspektrometern. Dank dieser Funktionen ermöglicht die Software Wissenschaftlern, Forschern und Analysten die Interpretation komplexer Spektren, die Identifizierung von Biomarkern, die Quantifizierung von Analyten und die Gewinnung verwertbarer Erkenntnisse aus Rohdaten der Massenspektrometrie. Dies führt zu höherer Effizienz in der Forschung, verbesserter Genauigkeit in proteomischen und metabolomischen Studien sowie einer besseren Integration der Massenspektrometrie in pharmazeutische, klinische und akademische Einrichtungen.
Passen Sie diesen Bericht Ihren Anforderungen an.
Sie erhalten eine kostenlose Anpassung aller Berichte – einschließlich Teilen dieses Berichts, Länderanalysen und Excel-Datenpaketen – sowie attraktive Angebote und Rabatte für Start-ups und Universitäten.
Markt für Massenspektrometrie-Software: Strategische Einblicke
-
Ermitteln Sie die wichtigsten Markttrends dieses Berichts.Diese KOSTENLOSE Probe beinhaltet eine Datenanalyse, die von Markttrends bis hin zu Schätzungen und Prognosen reicht.
Markttreiber und Chancen für Massenspektrometrie-Software
Markttreiber:
- Zunehmende Anwendungen in der Genomik und Proteomik: Der Anstieg der Genomik- und Proteomikforschung führt zu einer verstärkten Abhängigkeit von Massenspektrometrie-Software für die genaue Biomarkeridentifizierung.
- Zunehmende Forschung und Entwicklung in der Pharmabranche: Pharmaunternehmen investieren verstärkt in die Arzneimittelforschung, was fortschrittliche Datenverarbeitungs- und Analysefähigkeiten erfordert.
- Cloud-Einführung: Die Migration zu cloudbasierten Bereitstellungslösungen für Massensoftware bietet Skalierbarkeit, Zugänglichkeit und verkürzte Bereitstellungszeiten und fördert so die Akzeptanz.
- Technologische Innovation: Künstliche Intelligenz, Algorithmen des maschinellen Lernens und Automatisierung verbessern die Genauigkeit der Datenanalyse und reduzieren den manuellen Arbeitsaufwand.
Marktchancen:
- Expansion in aufstrebenden Forschungsmärkten: Die zunehmende Forschungsförderung und die Infrastruktur der Lebenswissenschaften in Schwellenländern bergen ein großes Potenzial.
- Integration mit Multi-Omics-Plattformen: Software, die Massenspektrometrie-Daten nahtlos mit Genomik-, Transkriptomik- und Metabolomik-Daten integriert, eröffnet neue Anwendungsfälle.
- Hybrid- und SaaS-Modelle: Das Angebot einer hybriden On-Premise-/Cloud-Bereitstellung und abonnementbasierter Software könnte mehr Nutzer anziehen, insbesondere kleinere Labore und Institutionen.
- KI-gestützte Analytik: Die Entwicklung KI-gestützter Module für Spektraldekonvolution, Peak-Picking und Quantifizierung könnte ein entscheidender Wettbewerbsvorteil sein.
Marktbericht für Massenspektrometrie-Software: Segmentierungsanalyse
Nach Bereitstellungstyp:
- Cloud-basiert
- Vor Ort
Auf Antrag:
- Pharmaunternehmen
- Forschungsorganisationen und akademische Einrichtungen
Nach Geographie:
- Nordamerika
- Europa
- Asien-Pazifik
- Naher Osten und Afrika
- Süd- und Mittelamerika
Markt für Massenspektrometrie-Software: Regionale Einblicke
Die regionalen Trends und Einflussfaktoren auf den Markt für Massenspektrometrie-Software im gesamten Prognosezeitraum wurden von den Analysten von The Insight Partners eingehend erläutert. Dieser Abschnitt behandelt außerdem die Marktsegmente und die geografische Verteilung des Massenspektrometrie-Softwaremarktes in Nordamerika, Europa, Asien-Pazifik, dem Nahen Osten und Afrika sowie Süd- und Mittelamerika.
Umfang des Marktberichts zu Software für Massenspektrometrie
| Berichtattribute | Details |
|---|---|
| Marktgröße im Jahr 2025 | 7,35 Milliarden US-Dollar |
| Marktgröße bis 2034 | 12,96 Milliarden US-Dollar |
| Globale durchschnittliche jährliche Wachstumsrate (2026 - 2034) | 6,5 % |
| Historische Daten | 2021-2024 |
| Prognosezeitraum | 2026–2034 |
| Abgedeckte Segmente |
Nach Bereitstellungstyp
|
| Abgedeckte Regionen und Länder |
Nordamerika
|
| Marktführer und wichtige Unternehmensprofile |
|
Marktdichte der Akteure im Bereich Massenspektrometrie-Software: Auswirkungen auf die Geschäftsdynamik verstehen
Der Markt für Massenspektrometrie-Software wächst rasant, angetrieben durch die steigende Nachfrage der Endnutzer. Gründe hierfür sind unter anderem sich wandelnde Verbraucherpräferenzen, technologische Fortschritte und ein wachsendes Bewusstsein für die Vorteile des Produkts. Mit steigender Nachfrage erweitern Unternehmen ihr Angebot, entwickeln innovative Lösungen, um den Kundenbedürfnissen gerecht zu werden, und nutzen neue Trends, was das Marktwachstum zusätzlich beflügelt.
- Verschaffen Sie sich einen Überblick über die wichtigsten Akteure im Markt für Massenspektrometrie-Software.
Marktanteilsanalyse für Massenspektrometrie-Software nach Regionen
- Nordamerika: Historisch gesehen dominant aufgrund einer starken Infrastruktur für die Forschung im Bereich der Lebenswissenschaften, einer großen pharmazeutischen Präsenz und der frühen Einführung von Cloud- und KI-Technologien.
- Europa: In dieser Region besteht eine erhebliche Nachfrage, die durch akademische Forschung, strenge Regulierungen und eine ausgereifte Biotechnologiebranche bedingt ist.
- APAC: Der am schnellsten wachsende Markt, angetrieben durch steigende F&E-Ausgaben, die zunehmende Anzahl von Biotech-Unternehmen und staatliche Unterstützung für den Aufbau einer Forschungsinfrastruktur.
- Naher Osten & Afrika sowie Süd- & Mittelamerika: Diese Region bietet aufstrebende Märkte, in denen die Investitionen in Forschungseinrichtungen und Life-Science-Kapazitäten zunehmen. Cloud-Lösungen und SaaS-Modelle eröffnen zukünftige Wachstumschancen.
Marktdichte der Akteure im Bereich Massenspektrometrie-Software: Auswirkungen auf die Geschäftsdynamik verstehen
Der Markt für Massenspektrometrie-Software ist relativ konzentriert, wobei einige wenige Hauptakteure den Markt dominieren, es aber auch mehrere Nischenanbieter gibt.
Wettbewerbsdifferenzierungsstrategien:
- Entwicklung von KI/ML-fähigen Modulen zur Verbesserung der Spektraldateninterpretation.
- Wir bieten cloudbasierte, skalierbare Software für Forschungslabore unterschiedlicher Größe.
- Strategische Partnerschaften oder Fusionen und Übernahmen zur Integration von Fähigkeiten über Multi-Omics-Datenplattformen hinweg.
- Bereitstellung spezialisierter Datenverarbeitungswerkzeuge für Proteomik, Metabolomik und Biomarker-Entdeckung.
Chancen und strategische Schritte:
- Partnerschaft mit pharmazeutischen Forschungs- und Entwicklungslaboren zur gemeinsamen Entwicklung maßgeschneiderter Softwarelösungen.
- Investitionen in Forschung und Entwicklung zur Bereitstellung von prädiktiven Analysen und spektralem Echtzeit-Feedback.
- Expansion in unterversorgte Märkte durch lokale Bereitstellung, Schulung und Cloud-Plattformen.
- Wir bieten modulare Plattformen an, die eine schrittweise Einführung ermöglichen (z. B. beginnend mit der Datenanalyse und später Hinzufügung von Steuerung und Visualisierung).
Wichtigste Unternehmen auf dem Markt für Massenspektrometrie-Software:
- Thermo Fisher Scientific Inc.
- Agilent Technologies, Inc.
- Waters Corporation
- Bruker Corporation
- Sciex (Danaher Corporation)
- Shimadzu Wissenschaftliche Instrumente
- Fortgeschrittene Chemieentwicklung
- Adaptas-Lösungen
- SpectralWorks Ltd.
Weitere Unternehmen, die im Rahmen dieser Marktforschung analysiert wurden, können sein:
- ACD/Labore
- Advion, Inc.
- Genedata AG
- JEOL Ltd.
- LECO Corporation
- OpenMS
- Proteome Software Inc.
- MassTech Inc.
- Nichtlineare Dynamik
- Cerno Bioscience
Neuigkeiten und aktuelle Entwicklungen auf dem Markt für Massenspektrometrie-Software
- Die Nutzung cloudbasierter Bereitstellungslösungen gewinnt zunehmend an Bedeutung, wobei viele Anbieter die Zugänglichkeit, niedrigere Energiekosten und skalierbare Infrastruktur als wesentliche Vorteile hervorheben.
- Im technologischen Bereich werden KI-gestützte Datenanalysen zur Peak-Erkennung, Dekonvolution und Interpretation bei Softwareanbietern immer gängiger, mit dem Ziel, den Durchsatz zu verbessern und manuelle Eingriffe zu reduzieren.
- Strategische Schritte: Anbieter gehen zunehmend Partnerschaften mit akademischen und pharmazeutischen Laboren ein, um gemeinsam domänenspezifische Werkzeuge zu entwickeln, insbesondere für Anwendungen in der Proteomik und Metabolomik.
Marktbericht für Massenspektrometrie-Software: Abdeckung und Ergebnisse
Der Bericht „Marktprognose für Massenspektrometrie-Software (2021–2034)“ von The Insight Partners bietet eine umfassende und detaillierte Analyse folgender Punkte:
- Globale und regionale Marktgröße und Prognosen für alle wichtigen Segmente.
- Detaillierte Marktanalysen sowie deren Treiber, Hemmnisse und Chancen.
- Detaillierte PEST- (politische, wirtschaftliche, soziale, technologische) und SWOT-Analysen (Stärken, Schwächen, Chancen, Risiken)
- Wettbewerbsumfeld: Marktkonzentration, Profilierung prominenter Akteure und deren jüngste strategische Initiativen.
- Entwicklungen in den Bereichen Fusionen und Übernahmen, Partnerschaften und Produkteinführungen.
- Unternehmensprofile führender und aufstrebender Akteure mit Einblicken in deren Produktportfolios, Geschäftsstrategien und Marktpositionierung.

Ankita ist eine dynamische Marktforschungs- und Beratungsexpertin mit über 8 Jahren Erfahrung in den Bereichen Technologie, Medien, IKT sowie Elektronik und Halbleiter. Sie hat über 100 Beratungs- und Forschungsaufträge für globale Kunden wie Microsoft, Oracle, NEC Corporation, SAP, KPMG und Expeditors International erfolgreich geleitet und durchgeführt. Zu ihren Kernkompetenzen gehören Marktbewertung, Datenanalyse, Prognose, Strategieformulierung, Wettbewerbsbeobachtung und das Verfassen von Berichten. Ankita ist versiert in der Abwicklung kompletter Projektzyklen – von der Angebotserstellung vor dem Verkauf und Kundengesprächen bis hin zur Bereitstellung umsetzbarer Erkenntnisse nach dem Verkauf. Sie ist versiert in der Leitung funktionsübergreifender Teams, der Strukturierung komplexer Forschungsmodule und der Ausrichtung von Lösungen an kundenspezifischen Geschäftszielen. Ihre ausgezeichneten Kommunikationsfähigkeiten, Führungsqualitäten und Präsentationsfähigkeiten haben es ihr ermöglicht, in einem schnelllebigen und sich entwickelnden Marktumfeld stets wertorientierte Ergebnisse zu liefern.
- Historische Analyse (2 Jahre), Basisjahr, Prognose (7 Jahre) mit CAGR
- PEST- und SWOT-Analyse
- Marktgröße Wert/Volumen – Global, Regional, Land
- Branchen- und Wettbewerbslandschaft
- Excel-Datensatz
Erfahrungsberichte
Der SCADA-Systemmarktbericht von Insight Partners ist umfassend und bietet wertvolle Einblicke in aktuelle Trends und Zukunftsprognosen. Das Team war durchweg hochprofessionell, reaktionsschnell und hilfsbereit. Wir sind sehr zufrieden und können die Dienstleistungen wärmstens empfehlen.
RAN KEDEM Partner, Reali Technologies LTDsIch habe einen Bericht über einen sehr spezifischen Softwaremarkt angefordert, und das Team hat ihn innerhalb weniger Tage erstellt. Die Informationen waren sehr relevant und gut präsentiert. Anschließend habe ich einige Änderungen und Ergänzungen zum Bericht angefordert. Das Team reagierte erneut sehr schnell, und ich erhielt den Abschlussbericht in weniger als einer Woche.
JEAN-HERVE JENN Vorsitzende, Future AnalyticaWir haben mit The Insight Partners für eine wichtige Marktstudie und Prognose zusammengearbeitet. Sie gaben uns klare Einblicke in Chancen und Risiken, die uns bei der Gestaltung unserer Pläne halfen. Ihre Recherchen waren benutzerfreundlich und basierten auf soliden Daten. Sie halfen uns, kluge und sichere Entscheidungen zu treffen. Wir können sie wärmstens empfehlen.
PIYUSH NAGPAL Sr. Vizepräsident, Fernlicht GlobalDie Insight Partners lieferten aufschlussreiche, gut strukturierte Marktforschung mit fundierter Fachkompetenz. Ihr Team war durchweg professionell und reaktionsschnell. Die benutzerfreundliche Website ermöglichte den Zugriff auf Branchenberichte. Wir empfehlen sie wärmstens für zuverlässige und hochwertige Forschungsdienstleistungen.
YUKIHIKO ADACHI Geschäftsführer, Deep Blue, LLC.Dies ist das erste Mal, dass ich einen Marktbericht von The Insight Partners erworben habe. Obwohl ich zunächst unsicher war, besuchte ich die Website und fühlte mich dann sicherer, das Risiko einzugehen und einen Marktbericht zu kaufen. Ich bin mit der Qualität des Berichts und dem Kundenservice rundum zufrieden. Ich hatte einige Fragen und Anmerkungen zum ersten Bericht, aber nach einigen E-Mail-Gesprächen mit dem Analysten bin ich überzeugt, dass ich einen Bericht habe, den ich als Input für unseren strategischen Planungsprozess verwenden kann. Vielen Dank, dass Sie sich die Zeit genommen und dies zu einer positiven Erfahrung gemacht haben. Ich werde Ihren Service auf jeden Fall weiterempfehlen und Sie werden meine erste Anlaufstelle sein, wenn wir weitere Marktdaten benötigen.
JOHN SUZUKI Präsident und Chief Executive Officer, Vorstandsmitglied, BK TechnologiesIch möchte mich für Ihre Unterstützung und die Professionalität bedanken, die Sie bei der Bearbeitung meiner Informationsanfrage zum IVD-Markt für Infektionskrankheiten in Nigeria gezeigt haben. Ich schätze Ihre Geduld, Ihre Beratung und die Tatsache, dass Sie bereit waren, einen Rabatt anzubieten, der uns schließlich den Abschluss eines Geschäfts ermöglichte. Ich freue mich darauf, The Insight Partners in Zukunft wieder zu beauftragen, dank des Eindrucks, den Sie bei dieser ersten Begegnung bei mir hinterlassen haben.
DR. CHIJIOKE ONYIA GESCHÄFTSFÜHRERIN, PineCrest Healthcare Ltd.Grund zum Kauf
- Fundierte Entscheidungsfindung
- Marktdynamik verstehen
- Wettbewerbsanalyse
- Kundeneinblicke
- Marktprognosen
- Risikominimierung
- Strategische Planung
- Investitionsbegründung
- Identifizierung neuer Märkte
- Verbesserung von Marketingstrategien
- Steigerung der Betriebseffizienz
- Anpassung an regulatorische Trends


Exklusive Berichtsrabatte freischalten
Jetzt anfragen


 Kostenlose Probe anfordern für - Markt für Massenspektrometrie-Software