
Mass Spectrometry Software Market Overview and Forecast (2026-2034)
Coverage: By Deployment Type (Cloud-based and On-premises) and Application (Pharmaceutical Companies, Research Organizations and Institutions, and Others)
- Status : Data Released
- Report Code : TIPRE00016153
- Category : Technology, Media and Telecommunications
- No. of Pages : 150
- Available Report Formats :


- Last update date : December 26, 2025

2025 Market Size
US$ 7.35 Bn
Base year value
2034 Forecast
US$ 12.96 Bn
Projected by 2034
CAGR 2026-2034
6.5 %
Growth rate
Addressable Market
US$ 91.83 Bn
(2026-2034)
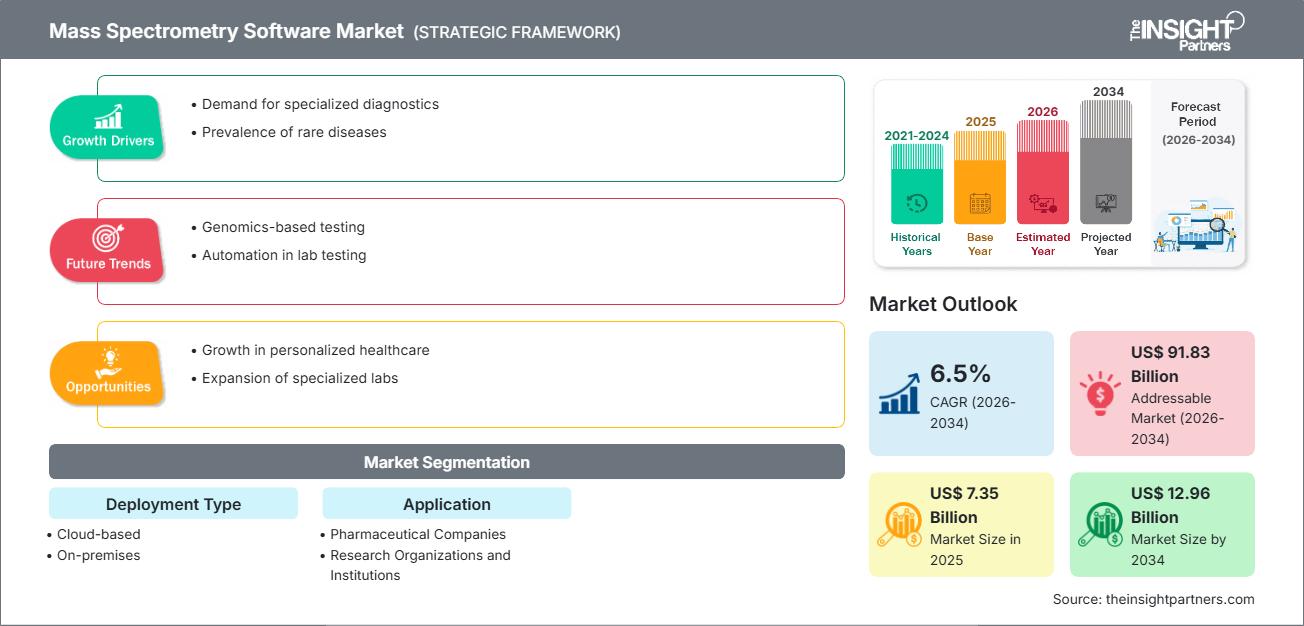
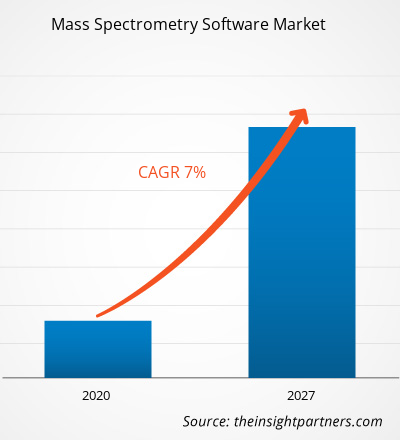
The mass spectrometry software market size is expected to grow from US$7.35 Bn in 2025 to US$12.96 Bn in 2034, registering a CAGR of 6.5% during 2026–2034.
Mass Spectrometry Software Market Analysis
The forecast for the mass spectrometry software market indicates sustained growth, helped by increased applications in genomics and proteomics, along with growing demand in research and pharmaceutical domains. The market is powered by the demand for high-throughput and accurate data processing and the rising usage of cloud-based solutions to address scalability and remote access issues. Additionally, AI/ML-driven advancements in data interpretation and automation spur further market growth. Integration of mass spectrometry instruments and increasing investments in R&D in life sciences add significantly to the market dynamics.
Mass Spectrometry Software Market Overview
Mass spectrometry software is a class of software designed to support the workflow of mass spectrometry. These tools take on critical tasks such as data acquisition, data processing, visualization, and the control of mass spectrometers. By offering these capabilities, the software enables scientists, researchers, and analysts to interpret complex spectra, identify biomarkers, quantify analytes, and derive actionable insights from raw mass spectrometry data. The result is increased efficiency in research, enhanced accuracy in proteomic and metabolomic studies, and better integration of mass spectrometry in pharmaceutical, clinical, and academic settings.
Market Assessment and Insights
- Global market for Mass Spectrometry Software was valued at US$ 7.35 Billion in 2025
- Annual market size is expected to reach US$ 12.96 Billion by 2034
- Total addressable market (TAM) during 2026-2034 is projected to reach approximately US$ 91.83 Billion
- Market is anticipated to register a CAGR of 6.5% during the forecast period
- The United States represents a key market, supported by Demand for specialized diagnostics, Prevalence of rare diseases, as well as evolving industry dynamics
- Market analysis covers North America, Europe, Asia-Pacific, South and Central America, Middle East and Africa, with growth evaluated across the forecast period
- Market opportunities such as Growth in personalized healthcare, Expansion of specialized labs are expected to influence market dynamics and addressable market
- Report profiles industry participants, including Waters. Corporation, Thermo Fisher Scientific Inc., Agilent Technologies, Inc., Sciex (Danaher Corporation), Advanced Chemistry Development, Bruker, Adaptas Solutions, SpectralWorks Ltd., Shimadzu Scientific Instruments, PerkinElmer, Inc., while analyzing competitive strategies and innovation developments
-
Source: The Insight Partners' analysis based on proprietary research, government publications, company annual reports, investor presentations, industry databases, and expert interviews.
● REPORT CUSTOMIZATION
Tailor This Report To Align With Your Specific Business Requirements
This report can be customized to align precisely with your business objectives, scope, and target markets. Customization options include tailored segmentation, geography, competitive analysis, and strategic insights to support informed decision-making.
Customize This Report →WHAT YOU CAN ADJUST
- ● Segmentations
- ● Geography
- ● Competitive Analysis
- ● Language Preferences
Mass Spectrometry Software Market: Strategic Insights
-
Get Top Key Market Trends of this report.This FREE sample will include data analysis, ranging from market trends to estimates and forecasts.
Mass Spectrometry Software Market Drivers and Opportunities
Market Drivers:
- Growing Applications in Genomics & Proteomics: The surge in genomics and proteomics research is increasing reliance on mass spectrometry software for accurate biomarker identification.
- Rising R&D in Pharmaceuticals: Pharmaceutical companies are investing more in drug discovery, requiring advanced data processing and analytics capabilities.
- Cloud Adoption: The migration to cloud-based deployment for mass spec software offers scalability, accessibility, and reduced deployment time, pushing adoption.
- Technological Innovation: AI, machine-learning algorithms, and automation are improving data analysis precision and reducing manual workload.
Market Opportunities:
- Expansion in Emerging Research Markets: Increasing research funding and life science infrastructure in emerging economies present major potential.
- Integration with Multi-Omics Platforms: Software that seamlessly integrates mass spec data with genomics, transcriptomics, and metabolomics data opens new use cases.
- Hybrid and SaaS Models: Offering hybrid on-premise/cloud deployment and subscription-based software could attract more users, especially smaller labs and institutions.
- AI‑Driven Analytics: Developing AI-powered modules for spectral deconvolution, peak picking, and quantitation could be a key differentiator.
Mass Spectrometry Software Market Report Segmentation Analysis
By Deployment Type:
- Cloud‑based
- On‑premises
By Application:
- Pharmaceutical companies
- Research organizations & academic institutions
By Geography:
- North America
- Europe
- Asia Pacific
- Middle East & Africa
- South & Central America
Mass Spectrometry Software Market Report Scope
| Report Attribute | Details |
|---|---|
| Market size in 2025 | US$ 7.35 Billion |
| Market Size by 2034 | US$ 12.96 Billion |
| Global CAGR (2026 - 2034) | 6.5% |
| Historical Data | 2021-2024 |
| Forecast period | 2026-2034 |
| Segments Covered |
By Deployment Type
|
| Regions and Countries Covered |
North America
|
| Market leaders and key company profiles |
|
Mass Spectrometry Software Market Players Density: Understanding Its Impact on Business Dynamics
The Mass Spectrometry Software Market is growing rapidly, driven by increasing end-user demand due to factors such as evolving consumer preferences, technological advancements, and greater awareness of the product's benefits. As demand rises, businesses are expanding their offerings, innovating to meet consumer needs, and capitalizing on emerging trends, which further fuels market growth.
Mass Spectrometry Software Market Share Analysis by Geography
- North America: Historically dominant owing to strong life science research infrastructure, large pharmaceutical presence, and early adoption of cloud and AI technologies.
- Europe: This region has significant demand driven by academic research, stringent regulation, and a mature biotech industry.
- APAC: The fastest-growing market, driven by the rise in R&D expenditure, the increasing number of biotech companies, and government support for establishing research infrastructure.
- Middle East & Africa and South & Central America: This region provides emerging markets where investments in research institutions and life-science capabilities are growing. Cloud solutions and SaaS models will present future growth opportunities.
Mass Spectrometry Software Market Players Density: Understanding Its Impact on Business Dynamics
The mass spectrometry software market is relatively concentrated, with a few key players dominating, but also featuring several niche providers.
Competitive differentiation strategies:
- Developing AI/ML‑enabled modules to improve spectral data interpretation.
- Offering cloud-based, scalable software to cater to research labs of different sizes.
- Strategic partnerships or M&A to integrate capabilities across multi-omics data platforms.
- Providing specialized data processing tools for proteomics, metabolomics, and biomarker discovery.
Opportunities & Strategic Moves:
- Partnering with pharmaceutical R&D labs to co-develop tailored software solutions.
- Investing in R&D to deliver predictive analytics and real‑time spectral feedback.
- Expanding into underpenetrated markets via localized deployment, training, and cloud platforms.
- Offering modular platforms allowing incremental adoption (e.g., starting with data analysis, adding control & visualization later).
Mass Spectrometry Software Market Major Companies:
- Thermo Fisher Scientific Inc.
- Agilent Technologies, Inc.
- Waters Corporation
- Bruker Corporation
- Sciex (Danaher Corporation)
- Shimadzu Scientific Instruments
- Advanced Chemistry Development
- Adaptas Solutions
- SpectralWorks Ltd.
Other companies analyzed in the context of this market research may include:
- ACD/Labs
- Advion, Inc.
- Genedata AG
- JEOL Ltd.
- LECO Corporation
- OpenMS
- Proteome Software Inc.
- MassTech Inc.
- Nonlinear Dynamics
- Cerno Bioscience
Mass Spectrometry Software Market News and Recent Developments
- There is increasing traction in cloud-based deployment, with many providers emphasizing accessibility, lower energy costs, and scalable infrastructure as major advantages
- On the technology front, AI-driven data analytics for peak detection, deconvolution, and interpretation are becoming more mainstream among software providers, aimed at improving throughput and reducing manual intervention.
- Strategic moves: vendors are increasingly forming partnerships with academic and pharmaceutical labs to co-develop domain-specific tools, especially for proteomics and metabolomics applications.
Mass Spectrometry Software Market Report Coverage and Deliverables
The "Mass Spectrometry Software Market Forecast (2021-2034)" report by The Insight Partners provides a comprehensive and detailed analysis covering:
- Global and regional market size and forecasts for all key segments.
- In-depth market trends, along with drivers, restraints, and opportunities.
- Detailed PEST (Political, Economic, Social, Technological) and SWOT (Strengths, Weaknesses, Opportunities, Threats) analyses
- Competitive landscape: market concentration, profiling of prominent players, and their recent strategic initiatives.
- M&A, partnership, and product launch developments.
- Company profiles of leading and emerging players, with insights into their product portfolios, business strategies, and market positioning.
Frequently Asked Questions
2. Shortage of skilled professionals versed in mass spectrometry data analysis.
3. Data security and regulatory compliance in cloud deployments.
2. Rising R&D investment in pharmaceuticals.
3. Adoption of cloud-based deployment for scalability.
4. Innovation via AI/ML for data interpretation.
2. Asia-Pacific is emerging strongly, driven by increasing biotech investment and research infrastructure.

- Comprehensive Market Sizing and Forecast Analysis
- Detailed Segmentation Analysis
- In-Depth Market Dynamics Assessment
- Regional and Country-Level Insights
- Competitive Landscape and Company Benchmarking
- Strategic Business Intelligence
Recent Reports
Testimonials
The Insight Partners' SCADA System Market report is comprehensive, with valuable insights on current trends and future forecasts. The team was highly professional, responsive, and supportive throughout. We are very satisfied and highly recommend their services.
RAN KEDEM Partner, Reali Technologies LTDsI requested a report on a very specific software market and the team produced the report in a few days. The information was very relevant and well presented. I then requested some changes and additions to the report. The team was again very responsive and I got the final report in less than a week.
JEAN-HERVE JENN Chairman, Future AnalyticaWe worked with The Insight Partners for an important market study and forecast. They gave us clear insights into opportunities and risks, which helped shape our plans. Their research was easy to use and based on solid data. It helped us make smart, confident decisions. We highly recommend them.
PIYUSH NAGPAL Sr. Vice President, High Beam GlobalThe Insight Partners delivered insightful, well-structured market research with strong domain expertise. Their team was professional and responsive throughout. The user-friendly website made accessing industry reports seamless. We highly recommend them for reliable, high-quality research services
YUKIHIKO ADACHI CEO, Deep Blue, LLC.This is the first time I have purchased a market report from The Insight Partners.While I was unsure at first, I visited their web site and felt more comfortable to take the risk and purchase a market report.I am completely satisfied with the quality of the report and customer service. I had several questions and comments with the initial report, but after a couple of dialogs over email with their analyst I believe I have a report that I can use as input to our strategic planning process.Thank you so much for taking the extra time and making this a positive experience.I will definitely recommend your service to others and you will be my first call when we need further market data.
JOHN SUZUKI President and Chief Executive Officer, Board Director, BK TechnologiesI wish to appreciate your support and the professionalism you displayed in the course of attending to my request for information regarding to infectious disease IVD market in Nigeria. I appreciate your patience, your guidance, and the fact that you were willing to offer a discount, which eventually made it possible for us to close a deal. I look forward to engaging The Insight Partners in the future, all thanks to the impression you have created in me as a result of this first encounter.
DR CHIJIOKE ONYIA MANAGING DIRECTOR, PineCrest Healthcare Ltd.Reason to Buy
- Informed Decision-Making
- Understanding Market Dynamics
- Competitive Analysis
- Identifying Emerging Markets
- Customer Insights
- Market Forecasts
- Risk Mitigation
- Boosting Operational Efficiency
- Strategic Planning
- Investment Justification
- Tracking Industry Innovations
- Aligning with Regulatory Trends


