Panorama y pronóstico del mercado de software de espectrometría de masas (2026-2034)
Datos históricos : 2021-2024 | Año base : 2025 | Período de pronóstico : 2026-2034Tamaño y pronóstico del mercado de software de espectrometría de masas (2021-2034), participación global y regional, tendencias y análisis de oportunidades de crecimiento. Cobertura del informe: por tipo de implementación (en la nube y local) y aplicación (empresas farmacéuticas, organizaciones e instituciones de investigación, entre otras).
- Estado : Datos publicados
- Código de informe : TIPRE00016153
- Categoría : Tecnología, medios y telecomunicaciones
- Número de páginas : 150
- Formatos de informe disponibles :


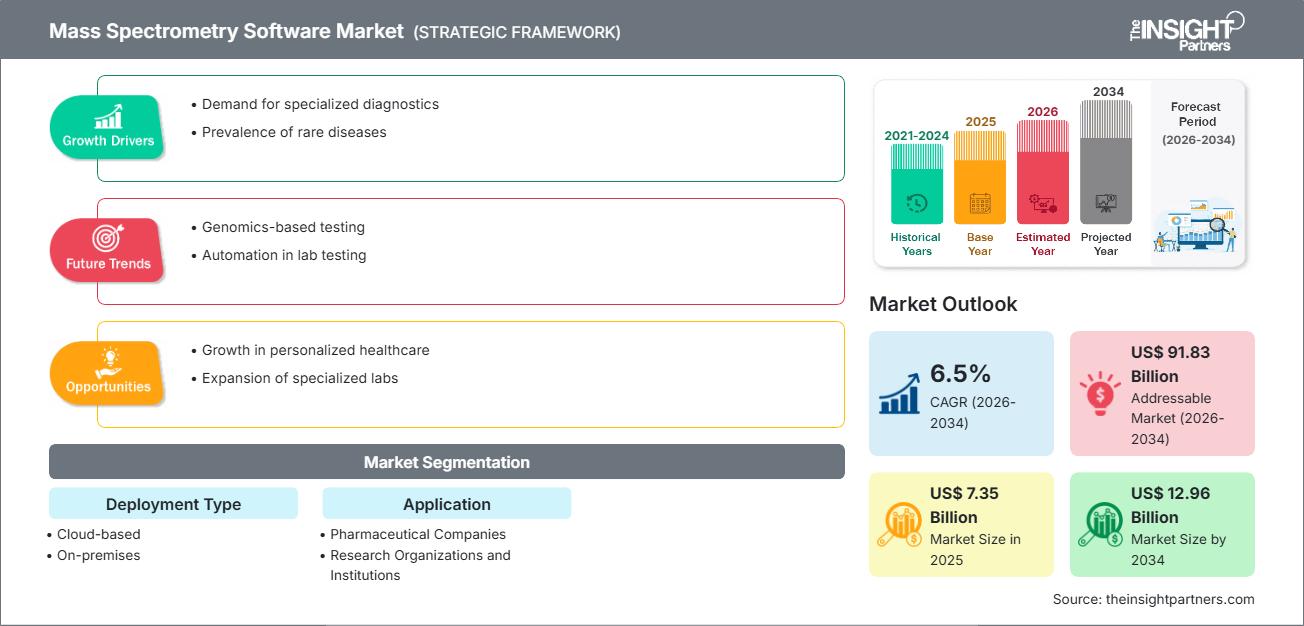
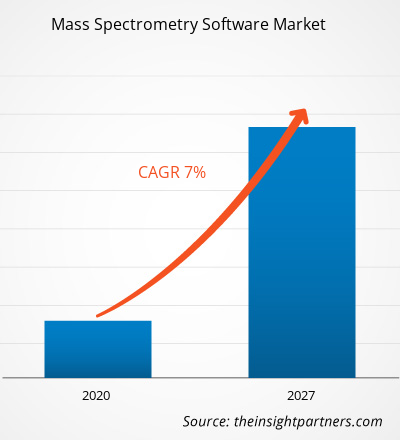
Se espera que el tamaño del mercado de software de espectrometría de masas crezca de US$7.350 millones en 2025 a US$12.960 millones en 2034, registrando una CAGR del 6,5 % durante 2026-2034.
Análisis del mercado de software de espectrometría de masas
Las previsiones para el mercado de software de espectrometría de masas indican un crecimiento sostenido, impulsado por el aumento de las aplicaciones en genómica y proteómica, junto con la creciente demanda en los sectores de investigación y farmacéutico. El mercado se ve impulsado por la demanda de procesamiento de datos preciso y de alto rendimiento, así como por el creciente uso de soluciones en la nube para abordar los problemas de escalabilidad y acceso remoto. Además, los avances en la interpretación y automatización de datos impulsados por IA/ML impulsan un mayor crecimiento del mercado. La integración de instrumentos de espectrometría de masas y el aumento de la inversión en I+D en ciencias de la vida contribuyen significativamente a la dinámica del mercado.
Descripción general del mercado de software de espectrometría de masas
El software de espectrometría de masas es un tipo de software diseñado para facilitar el flujo de trabajo de la espectrometría de masas. Estas herramientas se encargan de tareas cruciales como la adquisición y el procesamiento de datos, la visualización y el control de espectrómetros de masas. Al ofrecer estas capacidades, el software permite a científicos, investigadores y analistas interpretar espectros complejos, identificar biomarcadores, cuantificar analitos y obtener información útil a partir de datos brutos de espectrometría de masas. El resultado es una mayor eficiencia en la investigación, una mayor precisión en los estudios proteómicos y metabolómicos, y una mejor integración de la espectrometría de masas en entornos farmacéuticos, clínicos y académicos.
Personalice este informe según sus necesidades
Obtendrá personalización en cualquier informe, sin cargo, incluidas partes de este informe o análisis a nivel de país, paquete de datos de Excel, así como también grandes ofertas y descuentos para empresas emergentes y universidades.
Mercado de software de espectrometría de masas: perspectivas estratégicas
-
Obtenga las principales tendencias clave del mercado de este informe.Esta muestra GRATUITA incluirá análisis de datos, desde tendencias del mercado hasta estimaciones y pronósticos.
Impulsores y oportunidades del mercado del software de espectrometría de masas
Factores impulsores del mercado:
- Aplicaciones crecientes en genómica y proteómica: el aumento de la investigación en genómica y proteómica está incrementando la dependencia del software de espectrometría de masas para la identificación precisa de biomarcadores.
- Aumento de la I+D en el sector farmacéutico: las empresas farmacéuticas están invirtiendo más en el descubrimiento de fármacos, lo que requiere capacidades avanzadas de procesamiento y análisis de datos.
- Adopción de la nube: la migración a una implementación basada en la nube para software de especificación masiva ofrece escalabilidad, accesibilidad y menor tiempo de implementación, lo que impulsa la adopción.
- Innovación tecnológica: la IA, los algoritmos de aprendizaje automático y la automatización están mejorando la precisión del análisis de datos y reduciendo la carga de trabajo manual.
Oportunidades de mercado:
- Expansión en los mercados de investigación emergentes: el aumento de la financiación de la investigación y de la infraestructura de las ciencias de la vida en las economías emergentes presenta un gran potencial.
- Integración con plataformas multiómicas: el software que integra sin problemas datos de espectrometría de masas con datos genómicos, transcriptómicos y metabolómicos abre nuevos casos de uso.
- Modelos híbridos y SaaS: Ofrecer una implementación híbrida local/en la nube y un software basado en suscripción podría atraer a más usuarios, especialmente a laboratorios e instituciones más pequeños.
- Análisis impulsado por IA: el desarrollo de módulos impulsados por IA para la deconvolución espectral, la selección de picos y la cuantificación podría ser un diferenciador clave.
Análisis de segmentación del informe de mercado de software de espectrometría de masas
Por tipo de implementación:
- Basado en la nube
- En las instalaciones
Por aplicación:
- Compañías farmacéuticas
- Organizaciones de investigación e instituciones académicas
Por geografía:
- América del norte
- Europa
- Asia Pacífico
- Oriente Medio y África
- América del Sur y Central
Perspectivas regionales del mercado de software de espectrometría de masas
Los analistas de The Insight Partners han explicado detalladamente las tendencias regionales y los factores que influyen en el mercado de software de espectrometría de masas durante el período de pronóstico. Esta sección también analiza los segmentos y la geografía del mercado de software de espectrometría de masas en América del Norte, Europa, Asia Pacífico, Oriente Medio y África, y América del Sur y Central.
Alcance del informe de mercado de software de espectrometría de masas
| Atributo del informe | Detalles |
|---|---|
| Tamaño del mercado en 2025 | 7.350 millones de dólares estadounidenses |
| Tamaño del mercado en 2034 | US$ 12.96 mil millones |
| CAGR global (2026-2034) | 6,5% |
| Datos históricos | 2021-2024 |
| Período de pronóstico | 2026-2034 |
| Segmentos cubiertos |
Por tipo de implementación
|
| Regiones y países cubiertos |
América del norte
|
| Líderes del mercado y perfiles de empresas clave |
|
Densidad de actores del mercado de software de espectrometría de masas: comprensión de su impacto en la dinámica empresarial
El mercado del software de espectrometría de masas está creciendo rápidamente, impulsado por la creciente demanda de los usuarios finales debido a factores como la evolución de las preferencias de los consumidores, los avances tecnológicos y un mayor conocimiento de los beneficios del producto. A medida que aumenta la demanda, las empresas amplían su oferta, innovan para satisfacer las necesidades de los consumidores y aprovechan las tendencias emergentes, lo que impulsa aún más el crecimiento del mercado.
- Obtenga una descripción general de los principales actores clave del mercado de software de espectrometría de masas
Análisis de la cuota de mercado del software de espectrometría de masas por geografía
- América del Norte: históricamente dominante debido a una sólida infraestructura de investigación en ciencias biológicas, una gran presencia farmacéutica y una adopción temprana de tecnologías de nube e IA.
- Europa: esta región tiene una demanda significativa impulsada por la investigación académica, una regulación estricta y una industria biotecnológica madura.
- APAC: El mercado de más rápido crecimiento, impulsado por el aumento del gasto en I+D, el número cada vez mayor de empresas de biotecnología y el apoyo gubernamental para establecer infraestructura de investigación.
- Oriente Medio y África, y América del Sur y Central: Esta región ofrece mercados emergentes donde las inversiones en instituciones de investigación y capacidades en ciencias de la vida están en aumento. Las soluciones en la nube y los modelos SaaS presentarán futuras oportunidades de crecimiento.
Densidad de actores del mercado de software de espectrometría de masas: comprensión de su impacto en la dinámica empresarial
El mercado de software de espectrometría de masas está relativamente concentrado, con unos pocos actores clave que dominan el mercado, pero también cuenta con varios proveedores especializados.
Estrategias de diferenciación competitiva:
- Desarrollo de módulos habilitados para IA/ML para mejorar la interpretación de datos espectrales.
- Ofrecemos software escalable basado en la nube para satisfacer las necesidades de laboratorios de investigación de distintos tamaños.
- Asociaciones estratégicas o fusiones y adquisiciones para integrar capacidades en plataformas de datos multiómicos.
- Proporcionar herramientas de procesamiento de datos especializadas para proteómica, metabolómica y descubrimiento de biomarcadores.
Oportunidades y movimientos estratégicos:
- Asociación con laboratorios de investigación y desarrollo farmacéuticos para desarrollar conjuntamente soluciones de software personalizadas.
- Invertir en I+D para ofrecer análisis predictivos y retroalimentación espectral en tiempo real.
- Expansión a mercados poco penetrados a través de implementaciones localizadas, capacitación y plataformas en la nube.
- Ofrecer plataformas modulares que permitan una adopción incremental (por ejemplo, comenzar con el análisis de datos y agregar control y visualización más adelante).
Principales empresas del mercado de software de espectrometría de masas:
- Thermo Fisher Scientific Inc.
- Tecnologías Agilent, Inc.
- Corporación Waters
- Corporación Bruker
- Sciex (Corporación Danaher)
- Instrumentos científicos Shimadzu
- Desarrollo de la química avanzada
- Soluciones Adaptas
- SpectralWorks Ltd.
Otras empresas analizadas en el contexto de esta investigación de mercado pueden incluir:
- ACD/Laboratorios
- Advion, Inc.
- Genedata AG
- JEOL Ltd.
- Corporación LECO
- OpenMS
- Proteoma Software Inc.
- MassTech Inc.
- Dinámica no lineal
- Cerno Bioscience
Noticias y desarrollos recientes del mercado de software de espectrometría de masas
- La implementación basada en la nube está ganando cada vez más terreno, y muchos proveedores destacan la accesibilidad, los menores costos de energía y la infraestructura escalable como principales ventajas.
- En el frente tecnológico, el análisis de datos impulsado por IA para la detección de picos, la deconvolución y la interpretación se está volviendo más común entre los proveedores de software, con el objetivo de mejorar el rendimiento y reducir la intervención manual.
- Movimientos estratégicos: los proveedores están formando cada vez más asociaciones con laboratorios académicos y farmacéuticos para desarrollar conjuntamente herramientas específicas del dominio, especialmente para aplicaciones de proteómica y metabolómica.
Informe de mercado de software de espectrometría de masas: cobertura y resultados
El informe "Pronóstico del mercado de software de espectrometría de masas (2021-2034)" de The Insight Partners ofrece un análisis completo y detallado que abarca:
- Tamaño del mercado global y regional y pronósticos para todos los segmentos clave.
- Tendencias del mercado en profundidad, junto con impulsores, restricciones y oportunidades.
- Análisis detallados PEST (Político, Económico, Social, Tecnológico) y FODA (Fortalezas, Debilidades, Oportunidades, Amenazas)
- Panorama competitivo: concentración del mercado, perfil de los actores destacados y sus iniciativas estratégicas recientes.
- Desarrollos de fusiones y adquisiciones, asociaciones y lanzamiento de productos.
- Perfiles de empresas líderes y emergentes, con información sobre sus carteras de productos, estrategias comerciales y posicionamiento en el mercado.

Ankita es una profesional dinámica en investigación de mercados y consultoría con más de 8 años de experiencia en los sectores de tecnología, medios de comunicación, TIC, electrónica y semiconductores. Ha liderado y ejecutado con éxito más de 100 proyectos de consultoría e investigación para clientes globales como Microsoft, Oracle, NEC Corporation, SAP, KPMG y Expeditors International. Sus principales competencias incluyen la evaluación de mercado, el análisis de datos, la previsión, la formulación de estrategias, la inteligencia competitiva y la redacción de informes.
Ankita es experta en la gestión de ciclos completos de proyecto, desde el diseño de propuestas de preventa y las conversaciones con los clientes hasta la entrega de información práctica posventa. Es experta en la gestión de equipos multifuncionales, la estructuración de módulos de investigación complejos y la alineación de soluciones con los objetivos de negocio específicos del cliente. Sus excelentes habilidades de comunicación, liderazgo y presentación le han permitido obtener constantemente resultados orientados al valor en entornos de mercado dinámicos y en constante evolución.
- Análisis histórico (2 años), año base, pronóstico (7 años) con CAGR
- Análisis PEST y FODA
- Tamaño del mercado, valor/volumen: global, regional y nacional
- Industria y panorama competitivo
- Conjunto de datos de Excel
Testimonios
El informe de mercado de sistemas SCADA de Insight Partners es completo y ofrece información valiosa sobre las tendencias actuales y las previsiones futuras. El equipo fue altamente profesional, receptivo y me brindó un gran apoyo en todo momento. Estamos muy satisfechos y recomendamos ampliamente sus servicios.
RAN KEDEM Socio, Reali Technologies LTDsSolicité un informe sobre un mercado de software muy específico y el equipo lo elaboró en pocos días. La información era muy relevante y estaba bien presentada. Posteriormente, solicité algunos cambios y adiciones al informe. El equipo fue muy receptivo y recibí el informe final en menos de una semana.
JEAN-HERVE JENN Presidente, Future AnalyticaTrabajamos con The Insight Partners para un importante estudio y pronóstico de mercado. Nos brindaron una visión clara de las oportunidades y los riesgos, lo que nos ayudó a definir nuestros planes. Su investigación fue fácil de usar y se basó en datos sólidos. Nos ayudó a tomar decisiones inteligentes y seguras. Los recomendamos ampliamente.
PIYUSH NAGPAL Vicepresidente Sénior, , High Beam GlobalThe Insight Partners realizó una investigación de mercado profunda y bien estructurada con una sólida experiencia en el sector. Su equipo fue profesional y receptivo en todo momento. El sitio web, fácil de usar, facilitó el acceso a los informes del sector. Los recomendamos ampliamente por sus servicios de investigación confiables y de alta calidad.
YUKIHIKO ADACHI Director Ejecutivo, , Deep Blue, LLCEsta es la primera vez que compro un informe de mercado de The Insight Partners. Aunque al principio tenía dudas, visité su sitio web y me sentí más cómodo al arriesgarme y comprarlo. Estoy completamente satisfecho con la calidad del informe y el servicio al cliente. Tenía varias preguntas y comentarios sobre el informe inicial, pero después de un par de conversaciones por correo electrónico con su analista, creo que tengo un informe que puedo usar como base para nuestro proceso de planificación estratégica. Muchas gracias por tomarse el tiempo y hacer de esta una experiencia positiva. Sin duda, recomendaré sus servicios y serán mi primera opción cuando necesitemos más datos de mercado.
JOHN SUZUKI Presidente y Director Ejecutivo, Director de la Junta Directiva, BK TechnologiesAgradezco su apoyo y la profesionalidad que demostraron al atender mi solicitud de información sobre el mercado de diagnóstico in vitro (IVD) para enfermedades infecciosas en Nigeria. Agradezco su paciencia, su orientación y su disposición a ofrecerme un descuento, lo que finalmente nos permitió cerrar un trato. Espero poder colaborar con The Insight Partners en el futuro, gracias a la impresión que me causó este primer encuentro.
DRA. CHIJIOKE ONYIA, DIRECTORA GENERAL, PineCrest Healthcare Ltd.Razón para comprar
- Toma de decisiones informada
- Comprensión de la dinámica del mercado
- Análisis competitivo
- Información sobre clientes
- Pronósticos del mercado
- Mitigación de riesgos
- Planificación estratégica
- Justificación de la inversión
- Identificación de mercados emergentes
- Mejora de las estrategias de marketing
- Impulso de la eficiencia operativa
- Alineación con las tendencias regulatorias


Desbloquea descuentos exclusivos en informes
Consultar ahora


 Obtenga una muestra gratuita para - Mercado de software de espectrometría de masas