Aperçu et prévisions du marché des logiciels de spectrométrie de masse (2026-2034)
Données historiques : 2021-2024 | Année de référence : 2025 | Période de prévision : 2026-2034Taille et prévisions du marché des logiciels de spectrométrie de masse (2021-2034), part de marché mondiale et régionale, tendances et analyse des opportunités de croissance : par type de déploiement (cloud et sur site) et application (entreprises pharmaceutiques, organismes et institutions de recherche, et autres)
- Statut : Données publiées
- Code du rapport : TIPRE00016153
- Catégorie : Technologie, médias et télécommunications
- Nombre de pages : 150
- Formats de rapport disponibles :


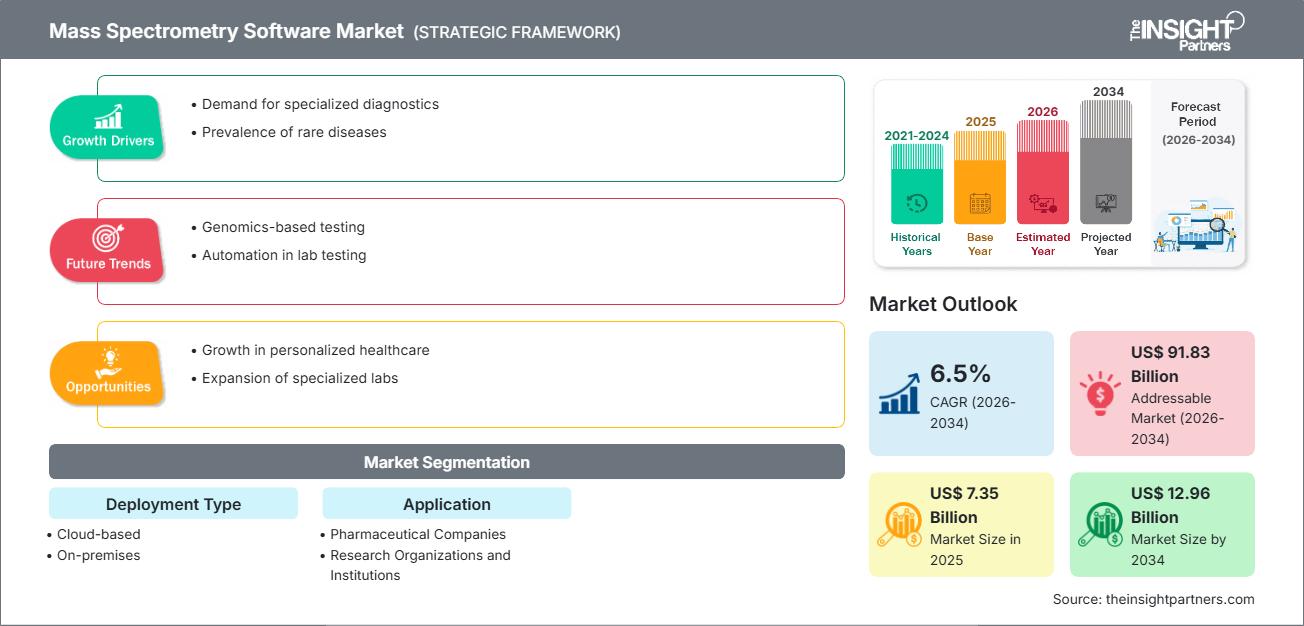
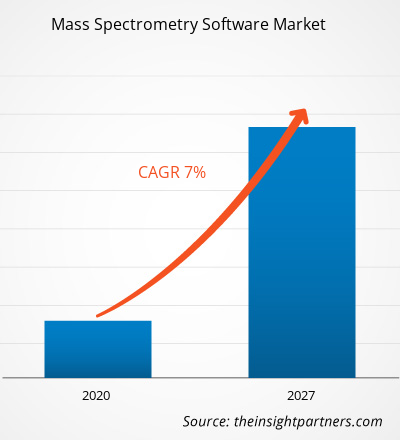
La taille du marché des logiciels de spectrométrie de masse devrait passer de 7,35 milliards de dollars US en 2025 à 12,96 milliards de dollars US en 2034, enregistrant un TCAC de 6,5 % entre 2026 et 2034.
Analyse du marché des logiciels de spectrométrie de masse
Les prévisions concernant le marché des logiciels de spectrométrie de masse indiquent une croissance soutenue, portée par l'essor des applications en génomique et protéomique, ainsi que par la demande croissante dans les secteurs de la recherche et de l'industrie pharmaceutique. Le marché est dynamisé par la demande de traitement de données à haut débit et précis, et par le recours accru aux solutions cloud pour répondre aux enjeux d'évolutivité et d'accès à distance. Par ailleurs, les progrès réalisés dans l'interprétation et l'automatisation des données grâce à l'IA et au ML contribuent également à cette croissance. L'intégration des instruments de spectrométrie de masse et l'augmentation des investissements en R&D dans les sciences de la vie dynamisent significativement le marché.
Aperçu du marché des logiciels de spectrométrie de masse
Les logiciels de spectrométrie de masse constituent une catégorie de logiciels conçus pour optimiser le flux de travail en spectrométrie de masse. Ces outils prennent en charge des tâches essentielles telles que l'acquisition, le traitement et la visualisation des données, ainsi que le pilotage des spectromètres de masse. Grâce à ces fonctionnalités, ces logiciels permettent aux scientifiques, chercheurs et analystes d'interpréter des spectres complexes, d'identifier des biomarqueurs, de quantifier des analytes et d'extraire des informations exploitables à partir des données brutes de spectrométrie de masse. Il en résulte une efficacité accrue de la recherche, une précision améliorée des études protéomiques et métabolomiques, et une meilleure intégration de la spectrométrie de masse dans les milieux pharmaceutiques, cliniques et académiques.
Personnalisez ce rapport selon vos besoins.
Vous bénéficierez d'une personnalisation gratuite de tous les rapports, y compris certaines parties de ce rapport, l'analyse par pays, le pack de données Excel, et vous profiterez également d'offres et de réductions exceptionnelles pour les start-ups et les universités.
Marché des logiciels de spectrométrie de masse : Perspectives stratégiques
-
Découvrez les principales tendances du marché présentées dans ce rapport.Cet échantillon GRATUIT comprendra une analyse de données, allant des tendances du marché aux estimations et prévisions.
Facteurs de croissance et opportunités du marché des logiciels de spectrométrie de masse
Facteurs de marché :
- Applications croissantes en génomique et protéomique : L’essor de la recherche en génomique et protéomique accroît le recours aux logiciels de spectrométrie de masse pour une identification précise des biomarqueurs.
- Augmentation des investissements en R&D dans le secteur pharmaceutique : les entreprises pharmaceutiques investissent davantage dans la découverte de médicaments, ce qui nécessite des capacités avancées de traitement et d’analyse des données.
- Adoption du cloud : La migration vers un déploiement basé sur le cloud pour les logiciels de spectrométrie de masse offre évolutivité, accessibilité et un temps de déploiement réduit, favorisant ainsi l’adoption.
- Innovation technologique : l’IA, les algorithmes d’apprentissage automatique et l’automatisation améliorent la précision de l’analyse des données et réduisent la charge de travail manuelle.
Opportunités de marché :
- Expansion sur les marchés de recherche émergents : L’augmentation des financements de la recherche et des infrastructures en sciences de la vie dans les économies émergentes présente un potentiel majeur.
- Intégration avec les plateformes multi-omiques : un logiciel qui intègre de manière transparente les données de spectrométrie de masse avec les données de génomique, de transcriptomique et de métabolomique ouvre de nouveaux cas d’utilisation.
- Modèles hybrides et SaaS : proposer un déploiement hybride sur site/cloud et un logiciel par abonnement pourrait attirer davantage d’utilisateurs, notamment les petits laboratoires et les institutions.
- Analyse pilotée par l'IA : le développement de modules basés sur l'IA pour la déconvolution spectrale, la détection des pics et la quantification pourrait constituer un facteur de différenciation clé.
Analyse de segmentation du rapport sur le marché des logiciels de spectrométrie de masse
Par type de déploiement :
- Basé sur le cloud
- Sur site
Sur demande :
- entreprises pharmaceutiques
- organismes de recherche et institutions universitaires
Par géographie :
- Amérique du Nord
- Europe
- Asie-Pacifique
- Moyen-Orient et Afrique
- Amérique du Sud et centrale
Aperçu régional du marché des logiciels de spectrométrie de masse
Les analystes de The Insight Partners ont analysé en détail les tendances régionales et les facteurs influençant le marché des logiciels de spectrométrie de masse tout au long de la période prévisionnelle. Cette section aborde également les segments de marché et la répartition géographique du marché des logiciels de spectrométrie de masse en Amérique du Nord, en Europe, en Asie-Pacifique, au Moyen-Orient et en Afrique, ainsi qu'en Amérique du Sud et centrale.
Rapport sur le marché des logiciels de spectrométrie de masse
| Attribut du rapport | Détails |
|---|---|
| Taille du marché en 2025 | 7,35 milliards de dollars américains |
| Taille du marché d'ici 2034 | 12,96 milliards de dollars américains |
| TCAC mondial (2026 - 2034) | 6,5% |
| Données historiques | 2021-2024 |
| Période de prévision | 2026-2034 |
| Segments couverts |
Par type de déploiement
|
| Régions et pays couverts |
Amérique du Nord
|
| Leaders du marché et profils d'entreprises clés |
|
Acteurs clés du marché des logiciels de spectrométrie de masse : comprendre son impact sur la dynamique commerciale
Le marché des logiciels de spectrométrie de masse connaît une croissance rapide, portée par une demande croissante des utilisateurs finaux. Cette demande est alimentée par l'évolution des préférences des consommateurs, les progrès technologiques et une meilleure connaissance des avantages du produit. Face à cette demande grandissante, les entreprises élargissent leur offre, innovent pour répondre aux besoins des consommateurs et tirent parti des tendances émergentes, ce qui stimule davantage la croissance du marché.
- Découvrez les principaux acteurs du marché des logiciels de spectrométrie de masse
Analyse des parts de marché des logiciels de spectrométrie de masse par zone géographique
- Amérique du Nord : Historiquement dominante grâce à une solide infrastructure de recherche en sciences de la vie, une forte présence pharmaceutique et une adoption précoce des technologies du cloud et de l’IA.
- Europe : Cette région connaît une demande importante, alimentée par la recherche universitaire, une réglementation stricte et une industrie biotechnologique mature.
- Asie-Pacifique : Le marché à la croissance la plus rapide, tiré par la hausse des dépenses en R&D, le nombre croissant d’entreprises de biotechnologie et le soutien gouvernemental à la mise en place d’infrastructures de recherche.
- Moyen-Orient, Afrique, Amérique du Sud et centrale : cette région offre des marchés émergents où les investissements dans les institutions de recherche et les capacités en sciences de la vie sont en pleine croissance. Les solutions cloud et les modèles SaaS présenteront de futures perspectives de croissance.
Acteurs clés du marché des logiciels de spectrométrie de masse : comprendre son impact sur la dynamique commerciale
Le marché des logiciels de spectrométrie de masse est relativement concentré, dominé par quelques acteurs clés, mais il comprend également plusieurs fournisseurs de niche.
Stratégies de différenciation concurrentielle :
- Développement de modules basés sur l'IA/ML pour améliorer l'interprétation des données spectrales.
- Nous proposons des logiciels évolutifs basés sur le cloud pour répondre aux besoins des laboratoires de recherche de différentes tailles.
- Partenariats stratégiques ou fusions-acquisitions pour intégrer les capacités des plateformes de données multi-omiques.
- Fourniture d'outils spécialisés de traitement des données pour la protéomique, la métabolomique et la découverte de biomarqueurs.
Opportunités et initiatives stratégiques :
- Collaborer avec des laboratoires de R&D pharmaceutiques pour co-développer des solutions logicielles sur mesure.
- Investir dans la R&D pour fournir des analyses prédictives et un retour d'information spectral en temps réel.
- Expansion sur des marchés sous-exploités grâce à un déploiement localisé, à la formation et aux plateformes cloud.
- Proposer des plateformes modulaires permettant une adoption progressive (par exemple, en commençant par l'analyse des données, puis en ajoutant le contrôle et la visualisation ultérieurement).
Principales entreprises du marché des logiciels de spectrométrie de masse :
- Thermo Fisher Scientific Inc.
- Agilent Technologies, Inc.
- Société des eaux
- Société Bruker
- Sciex (Danaher Corporation)
- Instruments scientifiques Shimadzu
- Développement de la chimie avancée
- Solutions Adaptas
- SpectralWorks Ltd.
Parmi les autres entreprises analysées dans le cadre de cette étude de marché, on peut citer :
- ACD/Laboratoires
- Advion, Inc.
- Genedata AG
- JEOL Ltd.
- LECO Corporation
- OpenMS
- Logiciel Proteome Inc.
- MassTech Inc.
- Dynamique non linéaire
- Cerno Bioscience
Actualités et développements récents du marché des logiciels de spectrométrie de masse
- Le déploiement dans le cloud gagne en popularité, de nombreux fournisseurs mettant en avant l'accessibilité, la réduction des coûts énergétiques et l'évolutivité de l'infrastructure comme principaux avantages.
- Sur le plan technologique, l'analyse de données pilotée par l'IA pour la détection, la déconvolution et l'interprétation des pics se généralise chez les fournisseurs de logiciels, dans le but d'améliorer le débit et de réduire l'intervention manuelle.
- Démarches stratégiques : les fournisseurs nouent de plus en plus de partenariats avec des laboratoires universitaires et pharmaceutiques pour co-développer des outils spécifiques à un domaine, notamment pour les applications en protéomique et en métabolomique.
Rapport sur le marché des logiciels de spectrométrie de masse : contenu et livrables
Le rapport « Prévisions du marché des logiciels de spectrométrie de masse (2021-2034) » de The Insight Partners fournit une analyse complète et détaillée couvrant :
- Taille et prévisions du marché mondial et régional pour tous les segments clés.
- Analyse approfondie des tendances du marché, ainsi que des facteurs moteurs, des contraintes et des opportunités.
- Analyses PEST (Politique, Économique, Social, Technologique) et SWOT (Forces, Faiblesses, Opportunités, Menaces) détaillées
- Paysage concurrentiel : concentration du marché, profil des principaux acteurs et leurs initiatives stratégiques récentes.
- Développements liés aux fusions-acquisitions, aux partenariats et aux lancements de produits.
- Profils d'entreprises leaders et émergentes, avec un aperçu de leurs portefeuilles de produits, de leurs stratégies commerciales et de leur positionnement sur le marché.

Ankita est une professionnelle dynamique des études de marché et du conseil, forte de plus de 8 ans d'expérience dans les secteurs des technologies, des médias, des TIC, de l'électronique et des semi-conducteurs. Elle a dirigé et réalisé avec succès plus de 100 missions de conseil et d'études pour des clients internationaux tels que Microsoft, Oracle, NEC Corporation, SAP, KPMG et Expeditors International. Ses compétences clés incluent l'analyse de marché, l'analyse de données, la prévision, la formulation de stratégies, la veille concurrentielle et la rédaction de rapports.
Ankita maîtrise parfaitement la gestion de cycles de projet complets, de la conception de propositions avant-vente et des discussions avec les clients jusqu'à la fourniture d'informations exploitables après-vente. Elle maîtrise la gestion d'équipes transverses, la structuration de modules d'études complexes et l'alignement des solutions sur les objectifs commerciaux spécifiques de chaque client. Ses excellentes compétences en communication, leadership et présentation lui ont permis de fournir systématiquement des résultats à forte valeur ajoutée dans des environnements de marché dynamiques et en constante évolution.
- Analyse historique (2 ans), année de base, prévision (7 ans) avec TCAC
- Analyse PEST et SWOT
- Taille du marché Valeur / Volume - Mondial, Régional, Pays
- Industrie et paysage concurrentiel
- Ensemble de données Excel
Témoignages
Le rapport sur le marché des systèmes SCADA d'Insight Partners est complet et fournit des informations précieuses sur les tendances actuelles et les prévisions. L'équipe a fait preuve d'un grand professionnalisme, d'une grande réactivité et d'un grand soutien tout au long du projet. Nous sommes très satisfaits et recommandons vivement leurs services.
RAN KEDEM Partenaire, Reali Technologies LTDJ'ai demandé un rapport sur un marché logiciel très spécifique et l'équipe l'a produit en quelques jours. Les informations étaient très pertinentes et bien présentées. J'ai ensuite demandé des modifications et des ajouts au rapport. L'équipe a de nouveau été très réactive et j'ai reçu le rapport final en moins d'une semaine.
JEAN-HERVÉ JENN Président, Future AnalyticaNous avons collaboré avec The Insight Partners pour une importante étude de marché et des prévisions. Ils nous ont fourni une vision claire des opportunités et des risques, ce qui nous a aidés à élaborer nos plans. Leurs recherches étaient faciles à utiliser et basées sur des données solides. Elles nous ont permis de prendre des décisions éclairées et en toute confiance. Nous les recommandons vivement.
PIYUSH NAGPAL Vice-président principal, Feux de route mondiauxInsight Partners a réalisé une étude de marché pertinente et bien structurée, avec une solide expertise du domaine. Son équipe a fait preuve de professionnalisme et de réactivité tout au long du projet. Son site web convivial a facilité l'accès aux rapports sectoriels. Nous recommandons vivement ses services d'études fiables et de haute qualité.
YUKIHIKO ADACHI PDG, Bleu profond, LLC.C'est la première fois que j'achète une étude de marché auprès de The Insight Partners. J'étais un peu hésitant au début, mais j'ai consulté leur site web et me suis senti plus à l'aise pour prendre le risque d'acheter une étude de marché. Je suis entièrement satisfait de la qualité du rapport et du service client. J'avais plusieurs questions et commentaires concernant le rapport initial, mais après quelques échanges par e-mail avec leur analyste, je pense avoir obtenu un rapport qui pourra alimenter notre processus de planification stratégique. Merci beaucoup pour votre temps et pour avoir rendu cette expérience positive. Je recommanderai sans hésiter vos services et vous serez mon premier contact lorsque nous aurons besoin de données de marché supplémentaires.
JOHN SUZUKI Président-directeur général, administrateur du conseil d'administration, BK TechnologiesJe tiens à vous remercier pour votre soutien et le professionnalisme dont vous avez fait preuve lors du traitement de ma demande d'informations concernant le marché des dispositifs de diagnostic in vitro (DIV) pour les maladies infectieuses au Nigéria. J'apprécie votre patience, vos conseils et votre volonté d'offrir une réduction, ce qui nous a finalement permis de conclure un accord. Je me réjouis de collaborer à nouveau avec The Insight Partners, grâce à l'impression que vous m'avez laissée suite à cette première rencontre.
DR CHIJIOKE DIRECTEUR GÉNÉRAL D'ONYIA, PineCrest Healthcare Ltd.Raison d'acheter
- Prise de décision éclairée
- Compréhension de la dynamique du marché
- Analyse concurrentielle
- Connaissances clients
- Prévisions de marché
- Atténuation des risques
- Planification stratégique
- Justification des investissements
- Identification des marchés émergents
- Amélioration des stratégies marketing
- Amélioration de l'efficacité opérationnelle
- Alignement sur les tendances réglementaires


Débloquez des remises exclusives sur les rapports
Demander maintenant


 Obtenez un échantillon gratuit pour - Marché des logiciels de spectrométrie de masse