
Marktwachstum, Größe, Anteil, Trends, Analyse der wichtigsten Akteure und Prognose für pharmazeutische Zwischenprodukte bis 2028
Marktprognose für pharmazeutische Zwischenprodukte bis 2028 – Auswirkungen von COVID-19 und globale Analyse nach Typ (GMP und Nicht-GMP); Anwendungen (Antibiotika, fiebersenkende Analgetika, Vitamine und andere); Vertriebskanal (Distributor und Direktvertrieb) und Geografie
- Status : Veröffentlicht
- Berichtscode : TIPRE00005559
- Kategorie : Biowissenschaften
- Anzahl der Seiten : 185
- Verfügbare Berichtsformate :


- Datum der letzten Aktualisierung : June 17, 2024

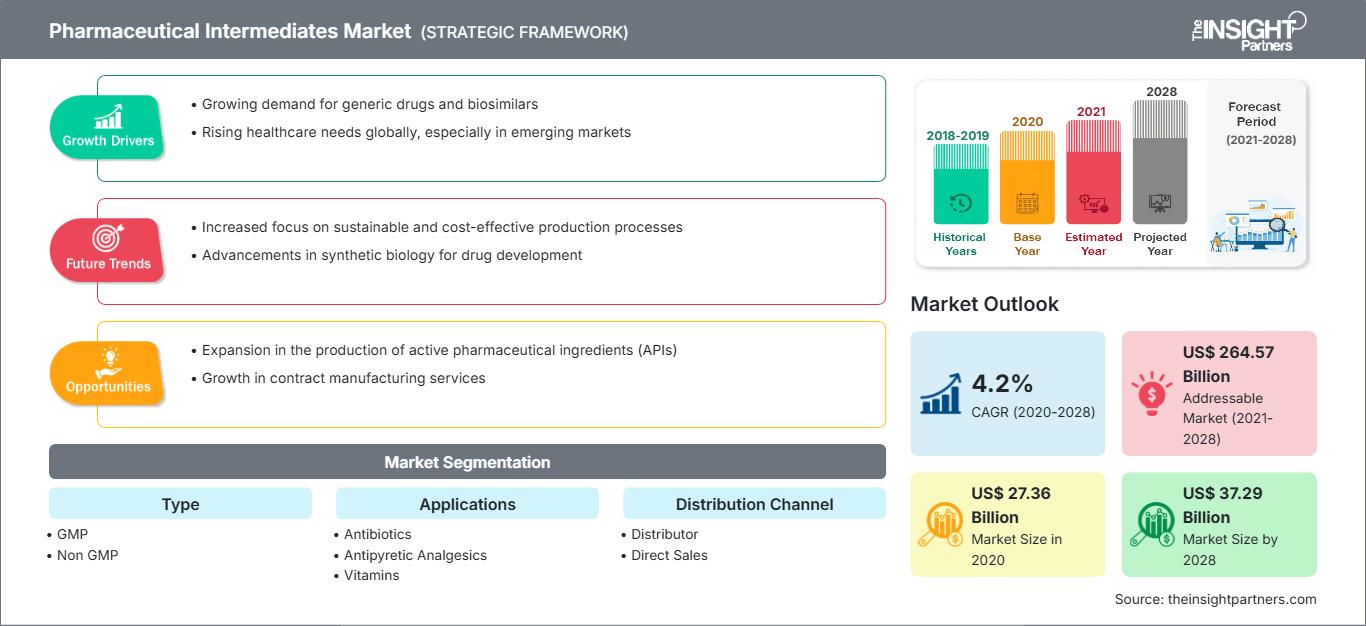
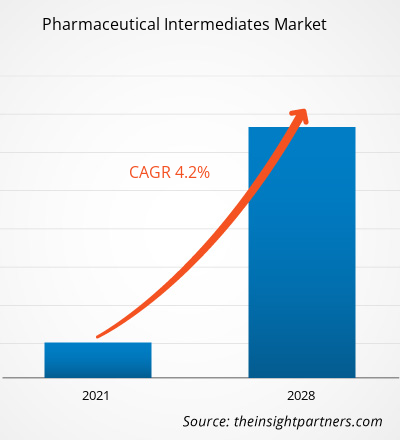
Der Markt für pharmazeutische Zwischenprodukte wird voraussichtlich von 27.356,70 Millionen US-Dollar im Jahr 2020 auf 37.290,33 Millionen US-Dollar im Jahr 2028 anwachsen. Von 2021 bis 2028 wird ein durchschnittliches jährliches Wachstum von 4,2 % erwartet.
Der Markt für pharmazeutische Zwischenprodukte wurde nach Typ, Anwendung, Vertriebskanal und Region analysiert. Der Markt ist regional in Nordamerika, Europa, den asiatisch-pazifischen Raum, den Nahen Osten und Afrika sowie Süd- und Mittelamerika unterteilt. Der Bericht konzentriert sich auf Parameter wie Markttrends, technologische Fortschritte, Marktdynamik und die Analyse der Wettbewerbslandschaft führender Unternehmen, um Einblicke und detaillierte Analysen des Marktes für pharmazeutische Zwischenprodukte zu bieten. Er enthält auch eine Analyse der COVID-19-Pandemie in allen wichtigen Regionen.
Passen Sie diesen Bericht Ihren Anforderungen an
Sie erhalten kostenlos Anpassungen an jedem Bericht, einschließlich Teilen dieses Berichts oder einer Analyse auf Länderebene, eines Excel-Datenpakets sowie tolle Angebote und Rabatte für Start-ups und Universitäten.
Markt für pharmazeutische Zwischenprodukte: Strategische Einblicke
-
Holen Sie sich die wichtigsten Markttrends aus diesem Bericht.Dieses KOSTENLOSE Beispiel umfasst Datenanalysen, die von Markttrends bis hin zu Schätzungen und Prognosen reichen.
Pharmazeutische Zwischenprodukte sind die Bausteine pharmazeutischer Wirkstoffe (APIs). Dabei handelt es sich um Rohstoffe, die während der Massenproduktion von Medikamenten molekular verändert oder verarbeitet werden. Daher steigt der Bedarf an pharmazeutischen Zwischenprodukten mit der steigenden Nachfrage nach Medikamenten zur Behandlung chronischer Krankheiten. Laut den Centers for Disease Control and Prevention (CDC) leiden 6 von 10 Erwachsenen in den USA an mindestens einer chronischen Krankheit wie Krebs, Herzkrankheiten, Lungenkrankheiten, Schlaganfall, neurologischen Erkrankungen, Diabetes und Nierenkrankheiten. Darüber hinaus haben 4 von 10 Erwachsenen im Land zwei oder mehr chronische Krankheiten. Und laut der Pressemitteilung der European Chronic Disease Alliance (ECDA) starben im Jahr 2014 in Europa 9 von 10 Menschen an chronischen Krankheiten. Somit werden 70–80 % der gesamten Gesundheitskosten für die Behandlung chronischer Krankheiten aufgewendet.
Die steigende Zahl von Infektionskrankheiten, insbesondere in Südostasien, wird in den kommenden Jahren voraussichtlich auch die Nachfrage nach APIs ankurbeln und so letztendlich das Wachstum des Marktes für pharmazeutische Zwischenprodukte vorantreiben. Laut dem überarbeiteten Bericht des Nationalen Tuberkulose-Kontrollprogramms starben beispielsweise im Jahr 2018 in Indien rund 440.000 Patienten an Tuberkulose, das sind 29 % der insgesamt 1,5 Millionen Todesfälle, die diese Krankheit weltweit verursacht hat. Somit steigert die hohe Prävalenz chronischer Krankheiten und Infektionskrankheiten die Nachfrage nach Medikamenten und unterstreicht letztendlich den Bedarf an pharmazeutischen Zwischenprodukten.
Typbasierte Erkenntnisse
Der Markt für pharmazeutische Zwischenprodukte ist nach Typ in GMP und Nicht-GMP unterteilt. Das GMP-Segment hatte 2020 den größten Marktanteil und dürfte im Prognosezeitraum mit 4,4 % die höchste durchschnittliche jährliche Wachstumsrate (CAGR) verzeichnen.
Anwendungsbasierte Erkenntnisse
Der Markt für pharmazeutische Zwischenprodukte ist nach Anwendung in Antibiotika, fiebersenkende Analgetika, Vitamine und Sonstiges unterteilt. Das Antibiotika-Segment hatte 2020 den größten Marktanteil und dürfte im Prognosezeitraum mit 4,9 % die höchste durchschnittliche jährliche Wachstumsrate (CAGR) verzeichnen.
Vertriebskanalbasierte Erkenntnisse
Auf Grundlage der Vertriebskanäle wurde der Markt für pharmazeutische Zwischenprodukte in Distributoren- und Direktvertrieb segmentiert. Das Direktvertriebssegment hatte im Jahr 2020 den größten Marktanteil, und das Vertriebssegment wird im Prognosezeitraum voraussichtlich die höchste durchschnittliche jährliche Wachstumsrate (CAGR) von 4,2 % verzeichnen.
Unternehmen, die auf dem Markt für pharmazeutische Zwischenprodukte tätig sind, verfolgen organische Strategien wie Produkteinführungen und -erweiterungen, um ihre Präsenz und ihr Produktportfolio weltweit zu erweitern und der wachsenden Nachfrage gerecht zu werden.
Pharmazeutische Zwischenprodukte
Regionale Einblicke in den Markt für pharmazeutische ZwischenprodukteDie Analysten von The Insight Partners haben die regionalen Trends und Faktoren, die den Markt für pharmazeutische Zwischenprodukte im Prognosezeitraum beeinflussen, ausführlich erläutert. In diesem Abschnitt werden auch die Marktsegmente und die geografische Lage pharmazeutischer Zwischenprodukte in Nordamerika, Europa, dem asiatisch-pazifischen Raum, dem Nahen Osten und Afrika sowie Süd- und Mittelamerika erörtert.
Umfang des Marktberichts über pharmazeutische Zwischenprodukte
| Berichtsattribut | Einzelheiten |
|---|---|
| Marktgröße in 2020 | US$ 27.36 Billion |
| Marktgröße nach 2028 | US$ 37.29 Billion |
| Globale CAGR (2020 - 2028) | 4.2% |
| Historische Daten | 2018-2019 |
| Prognosezeitraum | 2021-2028 |
| Abgedeckte Segmente |
By Typ
|
| Abgedeckte Regionen und Länder |
Nordamerika
|
| Marktführer und wichtige Unternehmensprofile |
|
Dichte der Marktteilnehmer für pharmazeutische Zwischenprodukte: Verständnis ihrer Auswirkungen auf die Geschäftsdynamik
Der Markt für pharmazeutische Zwischenprodukte wächst rasant. Die steigende Nachfrage der Endverbraucher ist auf Faktoren wie veränderte Verbraucherpräferenzen, technologische Fortschritte und ein stärkeres Bewusstsein für die Produktvorteile zurückzuführen. Mit der steigenden Nachfrage erweitern Unternehmen ihr Angebot, entwickeln Innovationen, um den Bedürfnissen der Verbraucher gerecht zu werden, und nutzen neue Trends, was das Marktwachstum weiter ankurbelt.
- Holen Sie sich die Markt für pharmazeutische Zwischenprodukte Übersicht der wichtigsten Akteure
- GMP
- Nicht-GMP
Nach Anwendung
- Antibiotika
- Fiebersenkende Analgetika
- Vitamine
- Sonstige
Nach Vertriebskanal
- Distributor
- Direktvertrieb
Nach Geografie
-
Nordamerika
- USA
- Kanada
- Mexiko
-
Europa
- Deutschland
- Frankreich
- Italien
- Vereinigte Königreich
- Spanien
- SchweizEuropa
-
Asien-Pazifik (APAC)
- China
- Indien
- Südkorea
- Japan
- Australien
- Rest von APAC
-
Naher Osten und Afrika (MEA)
- Südafrika
- Saudi Arabien
- VAE
- Türkei
- Rest von MEA
-
Süd- und Mittelamerika (SCAM)
- Brasilien
- Argentinien
- Rest von SCAM
Firmenprofile
- Pfizer, Inc
- Dishman Group
- Dextra Laboratories Limited
- Sanofi Winthrop Industries SA
- Vertellus Holdings LLC
- BASF SE
- Lianhetech
- Codexis
- Midas Pharma GmbH
- Chiracon GmbH

Mrinal ist eine erfahrene Research-Analystin mit über 8 Jahren Erfahrung in der Marktanalyse und Beratung im Bereich Life Sciences. Mit ihrer strategischen Denkweise und ihrem unerschütterlichen Streben nach Exzellenz hat sie sich umfassende Expertise in den Bereichen Pharmaprognosen, Marktchancenbewertung und Entwicklung von Branchen-Benchmarks angeeignet. Ihre Arbeit konzentriert sich darauf, umsetzbare Erkenntnisse zu liefern, die Kunden fundierte strategische Entscheidungen ermöglichen. Mrinals Kernkompetenz liegt in der Übersetzung komplexer quantitativer Datensätze in aussagekräftige Geschäftsinformationen. Ihr analytischer Scharfsinn ist entscheidend für die Entwicklung von Go-to-Market-Strategien (GTM) und die Erschließung von Wachstumschancen in der Pharma- und Medizinproduktebranche. Als vertrauenswürdige Beraterin konzentriert sie sich konsequent auf die Optimierung von Arbeitsabläufen und die Etablierung von Best Practices, um so Innovation und Betriebseffizienz für ihre Kunden zu fördern.
- Umfassende Analyse der Marktgröße und Prognosen
- Detaillierte Segmentierungsanalyse
- Tiefgehende Bewertung der Marktdynamik
- Einblicke auf regionaler und nationaler Ebene
- Wettbewerbslandschaft und Unternehmens-Benchmarking
- Strategische Business Intelligence
Erfahrungsberichte
Der SCADA-Systemmarktbericht von Insight Partners ist umfassend und bietet wertvolle Einblicke in aktuelle Trends und Zukunftsprognosen. Das Team war durchweg hochprofessionell, reaktionsschnell und hilfsbereit. Wir sind sehr zufrieden und können die Dienstleistungen wärmstens empfehlen.
RAN KEDEM Partner, Reali Technologies LTDsIch habe einen Bericht über einen sehr spezifischen Softwaremarkt angefordert, und das Team hat ihn innerhalb weniger Tage erstellt. Die Informationen waren sehr relevant und gut präsentiert. Anschließend habe ich einige Änderungen und Ergänzungen zum Bericht angefordert. Das Team reagierte erneut sehr schnell, und ich erhielt den Abschlussbericht in weniger als einer Woche.
JEAN-HERVE JENN Vorsitzende, Future AnalyticaWir haben mit The Insight Partners für eine wichtige Marktstudie und Prognose zusammengearbeitet. Sie gaben uns klare Einblicke in Chancen und Risiken, die uns bei der Gestaltung unserer Pläne halfen. Ihre Recherchen waren benutzerfreundlich und basierten auf soliden Daten. Sie halfen uns, kluge und sichere Entscheidungen zu treffen. Wir können sie wärmstens empfehlen.
PIYUSH NAGPAL Sr. Vizepräsident, Fernlicht GlobalDie Insight Partners lieferten aufschlussreiche, gut strukturierte Marktforschung mit fundierter Fachkompetenz. Ihr Team war durchweg professionell und reaktionsschnell. Die benutzerfreundliche Website ermöglichte den Zugriff auf Branchenberichte. Wir empfehlen sie wärmstens für zuverlässige und hochwertige Forschungsdienstleistungen.
YUKIHIKO ADACHI Geschäftsführer, Deep Blue, LLC.Dies ist das erste Mal, dass ich einen Marktbericht von The Insight Partners erworben habe. Obwohl ich zunächst unsicher war, besuchte ich die Website und fühlte mich dann sicherer, das Risiko einzugehen und einen Marktbericht zu kaufen. Ich bin mit der Qualität des Berichts und dem Kundenservice rundum zufrieden. Ich hatte einige Fragen und Anmerkungen zum ersten Bericht, aber nach einigen E-Mail-Gesprächen mit dem Analysten bin ich überzeugt, dass ich einen Bericht habe, den ich als Input für unseren strategischen Planungsprozess verwenden kann. Vielen Dank, dass Sie sich die Zeit genommen und dies zu einer positiven Erfahrung gemacht haben. Ich werde Ihren Service auf jeden Fall weiterempfehlen und Sie werden meine erste Anlaufstelle sein, wenn wir weitere Marktdaten benötigen.
JOHN SUZUKI Präsident und Chief Executive Officer, Vorstandsmitglied, BK TechnologiesIch möchte mich für Ihre Unterstützung und die Professionalität bedanken, die Sie bei der Bearbeitung meiner Informationsanfrage zum IVD-Markt für Infektionskrankheiten in Nigeria gezeigt haben. Ich schätze Ihre Geduld, Ihre Beratung und die Tatsache, dass Sie bereit waren, einen Rabatt anzubieten, der uns schließlich den Abschluss eines Geschäfts ermöglichte. Ich freue mich darauf, The Insight Partners in Zukunft wieder zu beauftragen, dank des Eindrucks, den Sie bei dieser ersten Begegnung bei mir hinterlassen haben.
DR. CHIJIOKE ONYIA GESCHÄFTSFÜHRERIN, PineCrest Healthcare Ltd.Grund zum Kauf
- Fundierte Entscheidungsfindung
- Marktdynamik verstehen
- Wettbewerbsanalyse
- Kundeneinblicke
- Marktprognosen
- Risikominimierung
- Strategische Planung
- Investitionsbegründung
- Identifizierung neuer Märkte
- Verbesserung von Marketingstrategien
- Steigerung der Betriebseffizienz
- Anpassung an regulatorische Trends


